the Creative Commons Attribution 4.0 License.
the Creative Commons Attribution 4.0 License.
 | 21 Jul 2025
Characterization of the mean and extreme Mediterranean cyclones and their variability during the period 1500 BCE to 1850 CE
Martina Messmer
Woon Mi Kim
Christoph C. Raible
Extratropical cyclones are important meteorological phenomena in the Mediterranean and are essential for local water supplies, yet they also pose significant hazards for the region as a result of extreme precipitation or wind events. Although they have been extensively studied using global and regional climate models, their spatial and temporal variability in the Late Holocene is poorly understood. Here, we study a 3350-year climatological simulation that allows us to characterize Mediterranean cyclones better and provides a baseline for more accurately assessing the long-term effects of future climate change on Mediterranean cyclones. To analyse Mediterranean cyclone characteristics, we use a seamless transient simulation from 1500 BCE to 1850 CE produced by the Community Earth System Model (CESM) with a 6-hourly temporal and 1.9°×2.5° horizontal resolutions. We found that Mediterranean cyclones exhibit pronounced multi-decadal variability in the order of 5 % throughout the entire Late Holocene with respect to several cyclone-related properties. For the cyclone frequency, a weak statistical relationship is identified with the East Atlantic (EA), East Atlantic/Western Russia (EAWR), and Scandinavian (SCAN) modes of circulation. Composite analyses of the most extreme cyclones with respect to wind speed and precipitation indicate that cyclones in the central Mediterranean have the potential to grow more intense over their entire lifetime than cyclones in the eastern Mediterranean. This is especially true for extreme wind speed cyclones, implying that people in the central Mediterranean are potentially more exposed to hazards caused by extreme cyclones.
- Article
(5015 KB) - Full-text XML
-
Supplement
(956 KB) - BibTeX
- EndNote


The Mediterranean has long been recognized as one of the most active storm track regions in the world. Due to its uniquely complex topography, Mediterranean cyclones are generally smaller in scale, less intense, and of shorter life span than cyclones in other major storm track areas (Trigo, 2006; Flaounas et al., 2014). However, these cyclones can heavily impact the Mediterranean region as a result of heavy precipitation events (Pfahl and Wernli, 2012; Flaounas et al., 2015a; Raveh-Rubin and Wernli, 2015), heavy wind storms (Nissen et al., 2010; Raveh-Rubin and Wernli, 2015), and coastal floods (Lionello et al., 2019; Ferrarin et al., 2021). These hazards can also occur simultaneously, resulting in compounding events that can have larger impacts than individual events combined (Zscheischler et al., 2018; Messmer and Simmonds, 2021; Vakrat and Hochman, 2023; Portal et al., 2024). Pfahl and Wernli (2012) showed that precipitation extremes and the presence of a cyclone are related up to 80 % of the time in the Mediterranean, whereas Nissen et al. (2010) showed that the majority of wind extremes in the Mediterranean are caused by cyclones present in the Mediterranean. Portal et al. (2024) showed that compounding rain–wind and wind wave extreme events in the Mediterranean are mostly caused by cyclones. Besides, Mediterranean cyclones are important for local water and energy supplies due to the precipitation they bring into this semi-arid region (Seager et al., 2014). However, the factors driving the variability in Mediterranean cyclone characteristics, especially extreme cyclones, are not fully understood. Thus, the purpose of this study is to deepen our understanding of Mediterranean cyclones by analysing past climate variability effects on the frequency and intensity of these types of cyclones using the Community Earth System Model (CESM; Hurrell et al., 2013).
Mediterranean cyclones occur more frequently in winter and have a frequency minimum in summer, with extreme cyclones being even less likely in summer (Flaounas et al., 2015b). The main cyclone hotspots in the Mediterranean are over the Gulf of Genoa, the Adriatic Sea, the Tyrrhenian Sea, the Aegean Sea, Cyprus, and the Sahara (Lionello et al., 2016; Flaounas et al., 2018). However, processes governing cyclone formation are distinctly different for the different regions. Cyclones in the Gulf of Genoa and the Adriatic Sea are mostly caused by lee processes related to the Alps associated with negative geopotential height anomalies over central and northern Europe (Trigo et al., 2002). Also, lee effects of the Atlas Mountains are the dominant cause of cyclogenesis over the Sahara in spring. Cyclones over the Aegean Sea are often caused by a large trough west of the area bringing vorticity to an area with warm sea surface temperatures (Trigo et al., 2002). Generally, the deepest cyclones can be found over the Gulf of Genoa and the Adriatic Sea, and cyclones over this region also tend to move more slowly than in other regions (Doiteau et al., 2024). Most Mediterranean cyclones originate in the Mediterranean basin, with only about 20 % of cyclones developing over an area outside the Mediterranean (mainly the Atlantic) (Lionello et al., 2016). Still, extreme Mediterranean cyclones are most of the time dynamically associated with an upstream cyclone in the North Atlantic (Raveh-Rubin and Flaounas, 2017). Within the Mediterranean, several subtypes of cyclones are classified. The lee cyclones forming over the Gulf of Genoa and the Adriatic Sea, as discussed before, are called Genoa lows and are a well-known subtype. They can heavily impact weather over the Alps, southern France, and Italy (Mesinger and Strickler, 1982). Sometimes, these Genoa lows follow a track northeastwards into central Europe and are then classified as Vb cyclones (van Bebber, 1891). These are quite rare events, but they can heavily impact the Alps and central Europe as they often cause heavy precipitation (Mudelsee et al., 2004; Messmer et al., 2015; Krug et al., 2021; Stucki et al., 2020). The lee cyclones formed over the Sahara are called Sharav cyclones and tend to rapidly travel eastwards. Due to their origin in arid areas, they often contain little moisture and can trigger dust storms over the Mediterranean (Alpert and Ziv, 1989). A special type of Mediterranean cyclone is the so-called medicane, which is a hybrid system between tropical and extratropical storms that often occurs in autumn and winter (Cavicchia et al., 2014). Medicanes have received lots of attention in recent years due to their intensity. However, due to their rarity, their overall socio-economic impact is not as large as that of extratropical Mediterranean cyclones (Flaounas et al., 2022).
In general, extratropical cyclone activity shows a distinct decadal variability (Feser et al., 2015). This variability can partly be explained by variations in different atmospheric modes of circulation (Seierstad et al., 2007; Walz et al., 2018). The most important mode of circulation influencing Mediterranean cyclones is the North Atlantic Oscillation (NAO). A positive NAO phase is statistically connected with a decrease in cyclone frequency over the Mediterranean, whereas an increase in cyclone frequency is found during the negative phase of the NAO (Raible et al., 2007). Moreover, the NAO is also inversely correlated to wintertime precipitation over the Mediterranean (Brandimarte et al., 2011; Montaldo and Sarigu, 2017). Hofstätter and Blöschl (2019) showed that the clustering of Vb cyclones becomes more frequent during negative NAO phases. Other modes, such as the East Atlantic (EA), Scandinavian (SCAN), East Atlantic/Western Russia (EAWR), and Polar/Eurasia (POL) modes of variability, also have a significant influence on cyclones in the Northern Hemisphere (Seierstad et al., 2007). In addition to the modes of atmospheric circulation, Walz et al. (2018) hypothesized that sea ice anomalies are a dominant factor in the inter-annual variability in Mediterranean cyclones.
Besides natural influences, there is evidence that anthropogenic climate change has altered and is expected to further affect the frequency and intensity of Mediterranean cyclones. Winter precipitation in the Mediterranean declined during the 20th century, and one of the causes is a decrease in cyclogenesis in the region (Trigo et al., 2000). In addition to that, Nissen et al. (2014) suggested that NAO values may become more positive in the future, implying a northward shift in the jet stream, which will reduce cyclone activity in the Mediterranean. An increase in pressure, a decrease in baroclinicity, and an increase in static stability are further effects of climate change decreasing the number of cyclones in the Mediterranean (Hochman et al., 2020; Raible et al., 2010).
General circulation models (GCMs) are extensively used to analyse the future impact of climate change and have also been extensively used to analyse Mediterranean cyclones and their future changes (Raible et al., 2010; Nissen et al., 2014). However, GCMs often have systematic biases related to extratropical cyclone frequency and intensity because of the low horizontal resolution and biases in land and sea surface temperatures (Zappa et al., 2013; Priestley et al., 2023). Mediterranean cyclones, which are usually of a smaller spatial scale than other extratropical cyclones, suffer even more from the low resolution in GCMs (Flaounas et al., 2013). Moreover, the relatively short period that simulations from GCMs cover makes analyses of the long-term variability in extreme cyclones more uncertain (Raible et al., 2018). Hence, large uncertainties remain for future projections concerning extreme Mediterranean cyclones.
An alternative method is to look at proxies to reconstruct the climate of the past (Xoplaki et al., 2003). However, since proxies are usually only sensitive to temperature and precipitation, and not to wind and pressure, it is complicated to reconstruct cyclone activity directly (Raible et al., 2021). Cyclone-related proxies often have to be derived from alterations in dust transport (Jong et al., 2006) or changes in sea sediment depositions (Degeai et al., 2015; Pouzet and Maanan, 2020). Still, some proxy-based records show that periods with more and less storm activity alternate during the Holocene (Degeai et al., 2015; Sabatier et al., 2012). Alternatively, reconstructions of the NAO can be used as an indirect measure of cyclone activity (Pinto and Raible, 2012; Ortega et al., 2015).
To overcome these problems, palaeoclimate modelling that simulates much longer time periods than most simulations generally do is used (Raible et al., 2021). Thereby, the GCMs attempt to reproduce past climates by considering natural and external forcings and boundary conditions. The resulting simulations of the past climate can be verified by comparing them against proxies (PAGES 2k-PMIP3 group, 2015; PAGES Hydro2k Consortium, 2017). Simulations of the past climate are also used to evaluate the ability of GCMs to represent internal climate variability and to create a climatological baseline for specific events (Harrison et al., 2015; Kageyama et al., 2018). Several studies investigated the effect of climate variability during the Holocene on extratropical cyclones in the Northern Hemisphere (Raible et al., 2021; Varma et al., 2012; Xia et al., 2016) or on a synoptic scale in the Euro-Atlantic domain using GCMs (Raible et al., 2018). Raible et al. (2018) simulated the period between 850 and 2100 CE and showed that cyclones in the North Atlantic exhibit pronounced multi-decadal variations caused by internal variability in the climate system. A similar finding was also reported by Gagen et al. (2016) for summer extratropical cyclones in the North Atlantic.
In this study, we use the CESM to investigate the effects of past climate variability on the frequency and intensity of Mediterranean cyclones. The CESM simulation consists of a single-member transient run that covers the period from 1500 BCE until 2012 CE (3512 years in total) (Kim et al., 2021). We track all cyclones in the Mediterranean and its immediate surroundings until 1850 CE. We particularly focus on extreme Mediterranean cyclones for precipitation and wind speed. This approach aids in assessing and understanding the underlying processes that affect (extreme) Mediterranean cyclones and making better projections for the future.
The paper is organized as follows: in Sect. 2, we introduce the CESM simulation and tracking algorithm for Mediterranean cyclones in more detail. In Sect. 3, we evaluate the CESM simulations and show the internal climate variability and the relation between atmospheric modes of circulation and extratropical cyclones. In Sect. 4, we show typical cyclone characteristics for different extremes for the central and eastern Mediterranean produced by CESM. Finally, in Sect. 5, we discuss the impacts of our results in a wider framework.
2.1 General circulation model and reanalysis data
The CESM version 1.2.2 is a fully coupled global climate model consisting of various component models. We used a configuration with a horizontal resolution of 1.9° (latitude) × 2.5° (longitude) in the atmosphere and over land and with a nominal 1.0°×1.0° resolution for the ocean and sea ice. The atmospheric component contains 30 vertical sigma pressure levels, and the ocean has 60 unevenly distributed layers. We used a seamless simulation spanning 1500 BCE to 2012 CE with a 6-hourly temporal resolution, branched off a spin-up equilibrated simulation with 1501 BCE conditions (Kim et al., 2021). The simulation was forced by solar irradiance, greenhouse gas (GHG) concentrations, albedo changes, and volcanic sulfur injections into the stratosphere that cover the entire simulation period. Most of the forcings were obtained from the Palaeoclimate Modelling Intercomparison Project phase 4 (PMIP4) database, and the volcanic forcing was from Sigl et al. (2021) and Carn et al. (2016). How these forcings were obtained and generated are explained in detail in Kim et al. (2021). In this study, we used geopotential height at 1000 hPa (Z1000) and 500 hPa (Z500); sea level pressure (SLP); 850 hPa temperature anomaly (T850); total precipitation, which is the sum of the large-scale and convective precipitation; and horizontal wind components at 850 and 300 hPa in the x and y direction, which are combined to wind speeds WS850 and WS300, respectively.
To evaluate the representation of Mediterranean cyclones in CESM, we compared the CESM output with the ERA5 reanalysis (Hersbach et al., 2020) for a period where both datasets overlap in time (1981–2010). ERA5 was regridded to the same spatial resolution as CESM to provide a fair comparison between the two.
2.2 Cyclone detection and tracking algorithm
We applied the cyclone detection and tracking algorithm developed by Blender et al. (1997) and extended by Schneidereit et al. (2010) to the seamless model simulation and ERA5 data. The algorithm identified minima in the Z1000 field. To exclude weak and unrealistic low-pressure systems, the cyclones need to fulfil the following requirements:
-
A minimum mean gradient of at least 20 geopotential metres (gpm) per 1000 km is achieved.
-
During the whole cyclone's lifetime, a minimum mean gradient of 30 gpm per 1000 km is achieved at least once.
-
Local minima over grid cells with an orography higher than 1000 m above sea level are excluded.
-
To connect different minima to a cyclone track, a minimum in the following time step is identified with a next-neighbour search. The new minimum of the cyclone must be within 250 km of the previous cyclone minimum.
-
The minimal lifetime of a cyclone is at least 24 h.
The cyclone identification and tracking method provided a variety of cyclone characteristics, such as the cyclone position, the radius of a cyclone, the cyclone depth, the core (central) pressure, and cyclone-related mean and extreme precipitation and wind speed. To compute the cyclone radius, first, a Gaussian function was fitted to the Z1000 field, assuming that the cyclone was azimuthally symmetric (Schneidereit et al., 2010). The cyclone radius is then defined as the distance between the cyclone centre and the point of 1.5 standard deviation (which represents the middle between the first and second inflection points), as done by Messmer and Simmonds (2021). The depth of the cyclone is defined as the difference between Z1000 in the centre of the cyclone and the Z1000 mean over the area of 1000×1000 km2.
To calculate the cyclone-related wind speed and precipitation, the maximum values of wind speed and precipitation of all grid cells within a cyclone's radius were considered (Raible et al., 2018). We also applied the tracking algorithm to the ERA5 Z1000 field to evaluate the Mediterranean cyclone characteristics in CESM, mostly focusing on the cyclone tracks.
2.3 Atmospheric modes of circulation and Mediterranean cyclones
To find the relation between atmospheric modes of circulation and Mediterranean cyclones, we first computed the most dominant modes of circulation over the North Atlantic domain in the CESM simulation. We applied an empirical orthogonal function (EOF) analysis to anomalies of Z500. For that, a 100-year period was selected from the simulation to compute the most important modes on seasonal timescales, then these modes were projected on the rest of the monthly Z500 data for the whole simulation until 1850 CE. The EOF analysis was calculated for the region between 20–80° N and 90° W–40° E, similarly to Hurrell (1995) (see Fig. S1 in the Supplement). Finally, the principal components (PCs) of the EOFs were computed and normalized. To identify a relation between atmospheric modes of circulation and Mediterranean cyclones, the Pearson correlation coefficients were estimated between the PCs and the monthly cyclone frequency, cyclone-related precipitation, and cyclone-related wind speed. We only considered grid cells where the model orography is below 1000 m and where a cyclone frequency was higher than 0.01 d−1.
2.4 Area of interest and analysis of extreme Mediterranean cyclones
Mediterranean cyclones are subject to large temporal and spatial variability (Campins et al., 2011). Therefore, we split the Mediterranean region into the central and the eastern Mediterranean (Fig. 1) and analysed extreme cyclones for each of these regions. We exclude the western Mediterranean Sea and the Iberian Peninsula, as there were only a very limited number of grid points available for this region due to the rather coarse resolution of CESM, and, based on our own analysis, the western Mediterranean is heavily influenced by the Atlantic; therefore the dominant processes here are not so relevant for the rest of the Mediterranean.
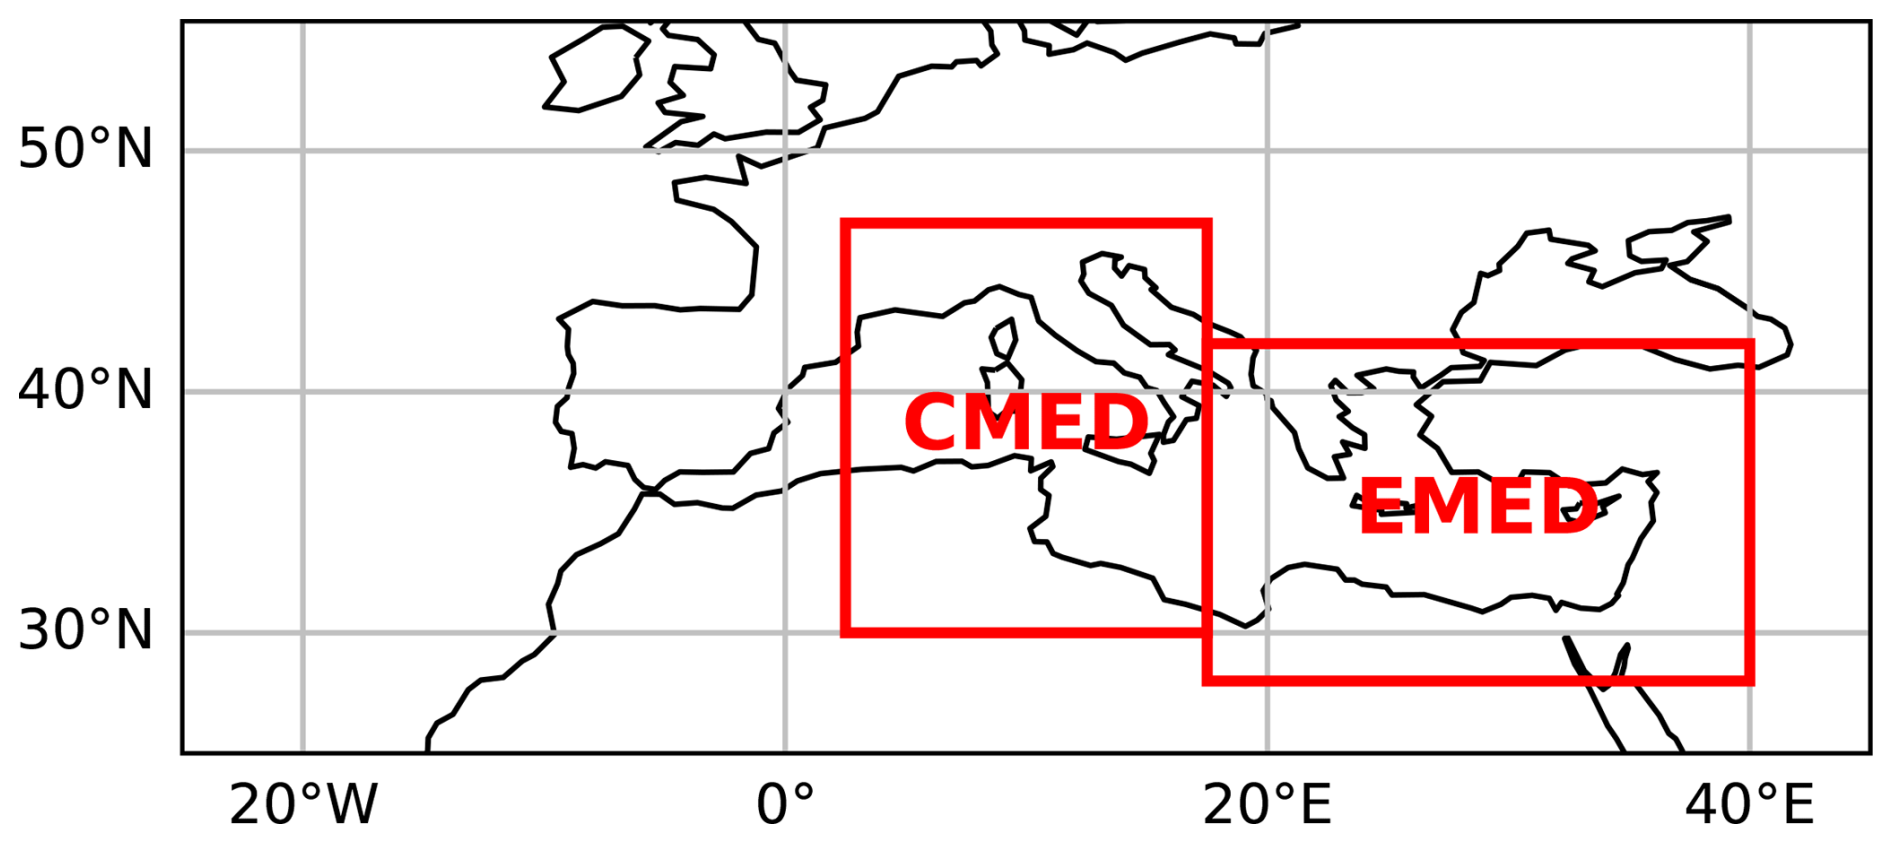
Figure 1The two regions of interest that are shown: “CMED” indicates the region defined as the central Mediterranean (between 30–47° N and 2.5–17.5° E); “EMED” indicates the region defined as the eastern Mediterranean (between 28–42° N and 17.5–40° E).
To analyse extreme cyclones, we need to select the most extreme cyclones within the tail of their probabilistic distribution. To do this, we ranked them based on WS850 (hereafter just wind speed) at the time when the cyclone reaches the lowest core sea level pressure within its track (hereafter t0) (similarly to Pfahl and Sprenger, 2016) and based on the maximum 6-hourly cyclone-related precipitation (hereafter just precipitation) within the entire track that affects the region. The location of minimum pressure is obtained while the cyclone track stays within the respective region of interest, which is either the central or the eastern Mediterranean (Fig. 1), but the track can start and end outside the corresponding region. We estimated the distributions of wind speed at t0 and of precipitation at the time step of maximum 6-hourly cyclone-related precipitation for all cyclones within the corresponding region. The distribution for precipitation is skewed towards extreme values and values close to zero. Therefore, all precipitation rates below 1 mm (6 h)−1 were excluded, and we computed the square root of the remaining precipitation to approximate a Gaussian distribution for precipitation. Compound extreme precipitation and extreme wind events related to cyclones were defined with the joint probability distribution of the precipitation and wind speed of all cyclones. Next, all the cyclones were ranked in terms of extremeness based on these distributions. We selected the 10, 100, and 1000 most extreme cyclones (hereafter EXC10, EXC100, EXC1000; EXC is used for extreme cyclones in general) for the central (out of 239 476 in total) and eastern (out of 161 768 in total) Mediterranean with respect to precipitation, wind speed, and compound events.
Finally, a composite analysis was performed on the EXC10, EXC100, and EXC1000 to investigate the spatial and temporal characteristics of cyclones associated with an extreme event. The following steps are carried out:
-
For each cyclone track, we set the reference at time t0. Every time step of the track that occurred after t0 obtains a positive index, and the time steps of the track that occurred before t0 receive a negative index.
-
For each of the 6-hourly time steps of the cyclones' tracks, all fields have been centred at the location of the cyclones, given by their core minimum pressure. With this approach, the model data for each cyclone track point was independent of its geographical location. Since all the cyclones were located in the Mediterranean basin at t0 and, therefore, within a relatively small range of latitudes, variations due to differences in latitude weights of grid cells were considered insignificant and, therefore, negligible.
-
We were only interested in the 30 h (5 time steps) before and after t0 for each cyclone to capture the intensification and decaying phase of the cyclone.
-
For every time step within these 30 h before and after t0, we compute spatial averages for EXC10, EXC100, and EXC1000. This was done for both regions for cyclones associated with cyclone-related precipitation, wind, and compound extremes. Cyclone tracks that did not appear at any of these time steps were ignored for the temporal means.
The composite analysis was applied to the precipitation, wind speed, WS300, SLP, T850, Z500, and Rossby wave packet (RWP) amplitude. The computation of the RWP amplitude is based on the method provided by Fragkoulidis et al. (2018) and is produced by calculating the amplitude of the envelope of the 300 hPa meridional wind. A Welch's t test was applied to all the temporal means and the spatial means of precipitation and wind speed between the two regions to assess whether EXCs between the two regions are significantly different.
3.1 Evaluation of the CESM simulation against ERA5
In Fig. 2, we show the cyclone frequency for the period 1981–2010 in CESM and ERA5. Considering Europe and the North Atlantic, CESM reproduces the general storm tracks stretching from Newfoundland via Iceland towards Scandinavia. However, CESM overestimates cyclone frequency over the polar North Atlantic and underestimates cyclone frequency in the subtropical North Atlantic. This bias is present in all seasons but is particularly present during DJF (Fig. 2f), with differences up to 50 %. Thus, the biases generally indicate that the simulated storm tracks in the North Atlantic have a northward bias and are to a lesser extent too zonal, especially in DJF.
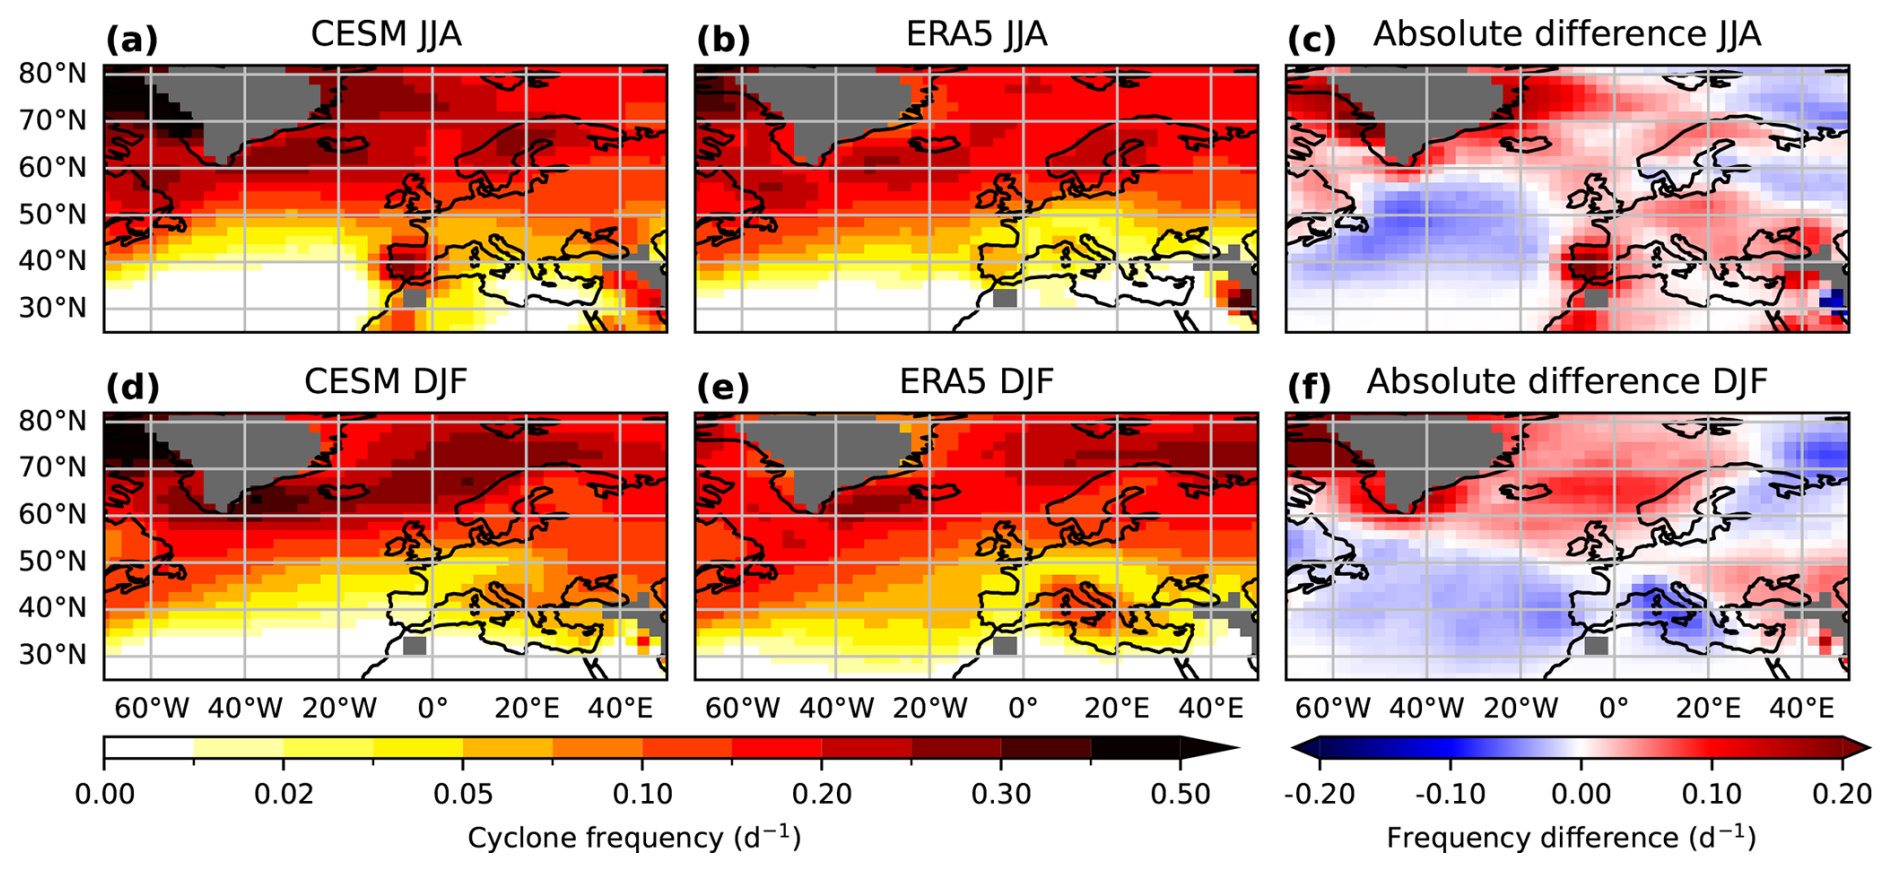
Figure 2Cyclone frequency (d−1) defined as the number of times a grid cell is located within the calculated radius of a cyclone during the respective season, divided by the number of days of the season in CESM (a, d) and ERA5 (b, c) and the difference between CESM and ERA5 (c, f) for summer (JJA; (a–c)) and winter (DJF; (d–f)) for the time period 1981–2020. The grey shading indicates areas excluded from the analysis (the model elevation is above 1000 m a.s.l.).
On a more regional scale, some noticeable biases are visible. Firstly, CESM strongly overestimates cyclone frequency west of Greenland for all seasons. These signals can mostly be ignored, since most of them are artefacts due to the presence of the Greenland ice sheet. Secondly, in the summer months, the number of cyclones over southern Europe is overestimated, especially over the Iberian Peninsula (Fig. 2c). In the central Mediterranean, the cyclone frequency is underestimated by approximately 50 % in winter (Fig. 2f). This could be related to the storm track bias in CESM; therefore, cyclones from the Atlantic penetrate the Mediterranean too little. The latter would also hamper lee cyclogenesis in the Mediterranean, further explaining the underestimation of cyclone frequency. However, the slight overestimation in the eastern Mediterranean suggests that the storm track bias in CESM only plays a role in the central Mediterranean.
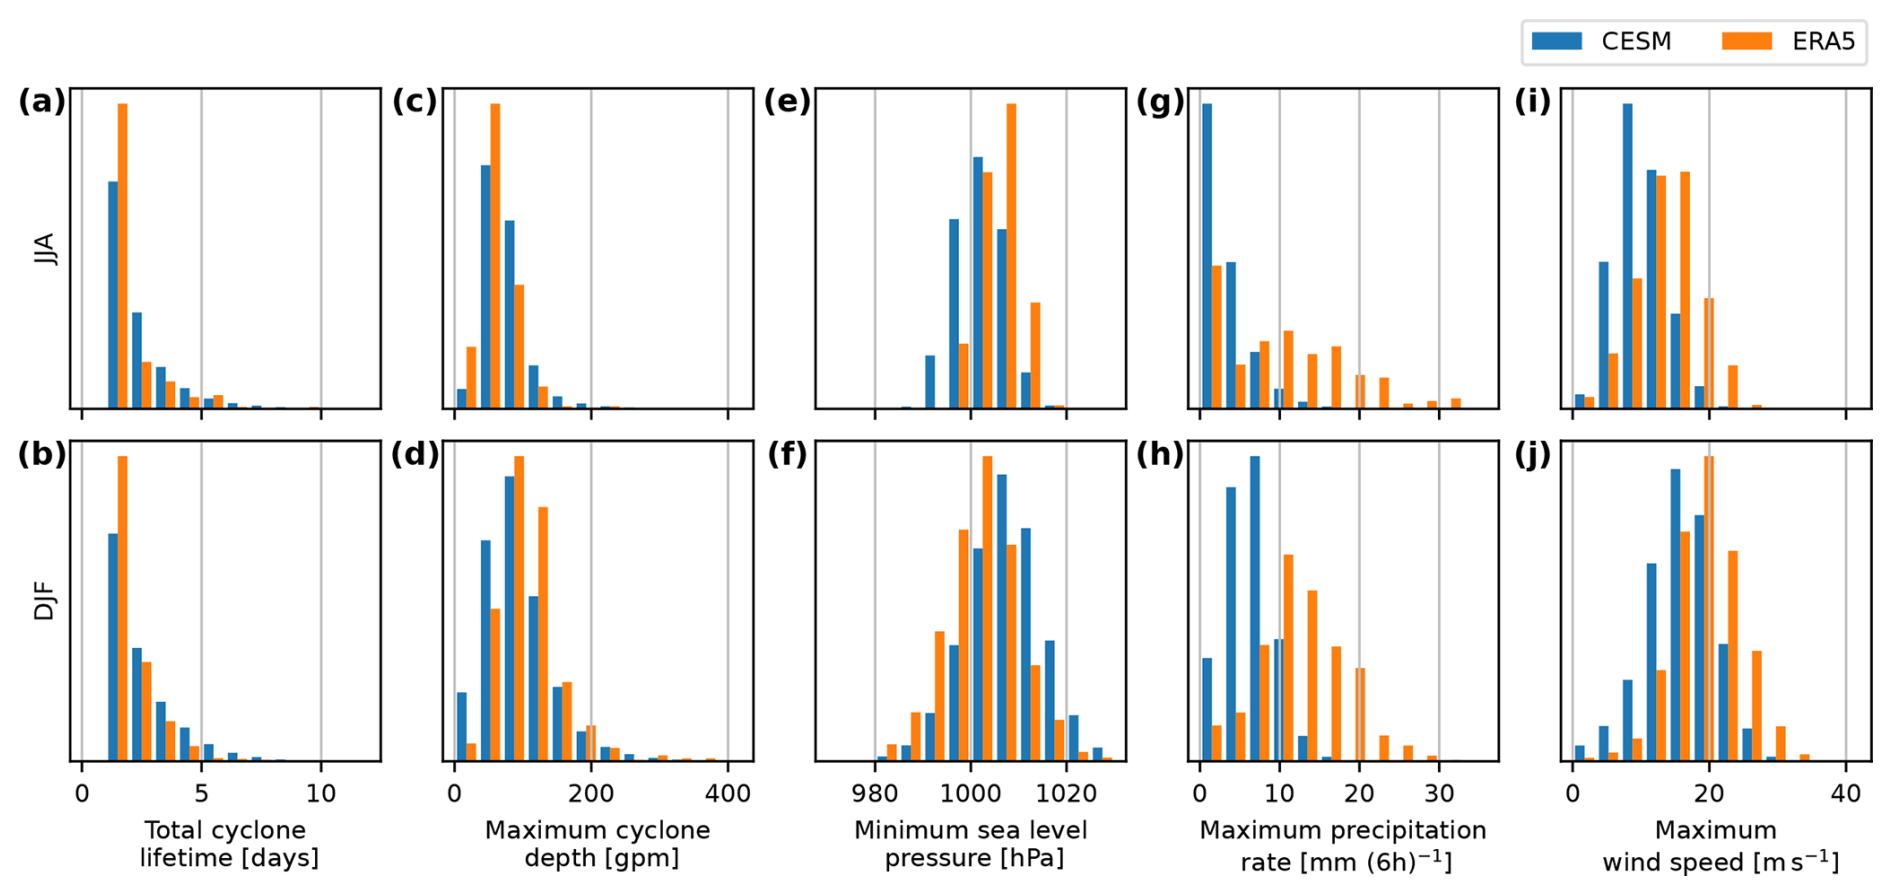
Figure 3Histograms of Mediterranean cyclone-related features in CESM (blue) and ERA5 (orange) between 1981 and 2010 in JJA (top row) and DJF (bottom row). Shown are the relative frequencies of the total lifetime of the cyclone tracks in days (a–b), the maximum cyclone depth during its lifetime (in gpm) (c–d), the minimum sea level pressure during its lifetime (in hPa) (e–f), the maximum cyclone-related precipitation rate during its lifetime (in mm (6 h)−1) (g–h), and the maximum cyclone-related wind speed during its lifetime at t0 (in m s−1) (i–j).
To assess the representation of cyclone characteristics in CESM, we compare several different cyclone-related variables in CESM and ERA5 for the Mediterranean in Fig. 3. CESM slightly overestimates the cyclone lifetime (Fig. 3a–b), while the number of very short-lived cyclones is underestimated in CESM. Maximum cyclone depth is represented well, although it is slightly underestimated in CESM (Fig. 3c–d), apart from JJA, where it is generally overestimated. CESM can reproduce the core minimum pressure for DJF (Fig. 3f), showing consistent peaks of maximum and minimum frequencies compared to ERA5. However, larger deviations between CESM and ERA5 are found for JJA, where the peak of the distribution is about 10 hPa higher for CESM compared to ERA5 (Fig. 3e). Larger biases occur for cyclone-related maximum precipitation (Fig. 3g–h) and cyclone-related maximum wind speed (Fig. 3i–j). CESM struggles to reproduce high cyclone-related precipitation events in winter and summer, where the high-end tails of the distributions are most often underestimated by 50 %. There is also an underestimation of cyclone-related high wind speed events in winter and summer, but this bias is less strong than the precipitation bias. Nevertheless, the fact that CESM mostly agrees with ERA5 on cyclone position and strength gives us confidence in the model's representation of cyclones over the Mediterranean.
3.2 Internal climate variability in CESM
To show how internal variability and past climate changes affect Mediterranean cyclones, we show 30-year running means of T850 averaged over all grid points of the two boxes (not cyclone-related) and several cyclone-related features over the period 1500 BCE to 1850 CE for the two regions combined (Fig. 4). The anomalies are with respect to the averages over the entire 3350-year period. We consider the 30-year running mean of T850 as a proxy for the state of the climate from 1500 BCE to 1850 CE (Fig. 4a). In general, pronounced multi-decadal variability is detected in Fig. 4. Warmer and colder periods alternate, with maximum anomalies in the order of 0.5 °C. The period between 1200 and 500 BCE is dominated by warmer conditions, whereas the period between 1600 and 1850 CE is dominated by colder conditions, also known as the Little Ice Age.
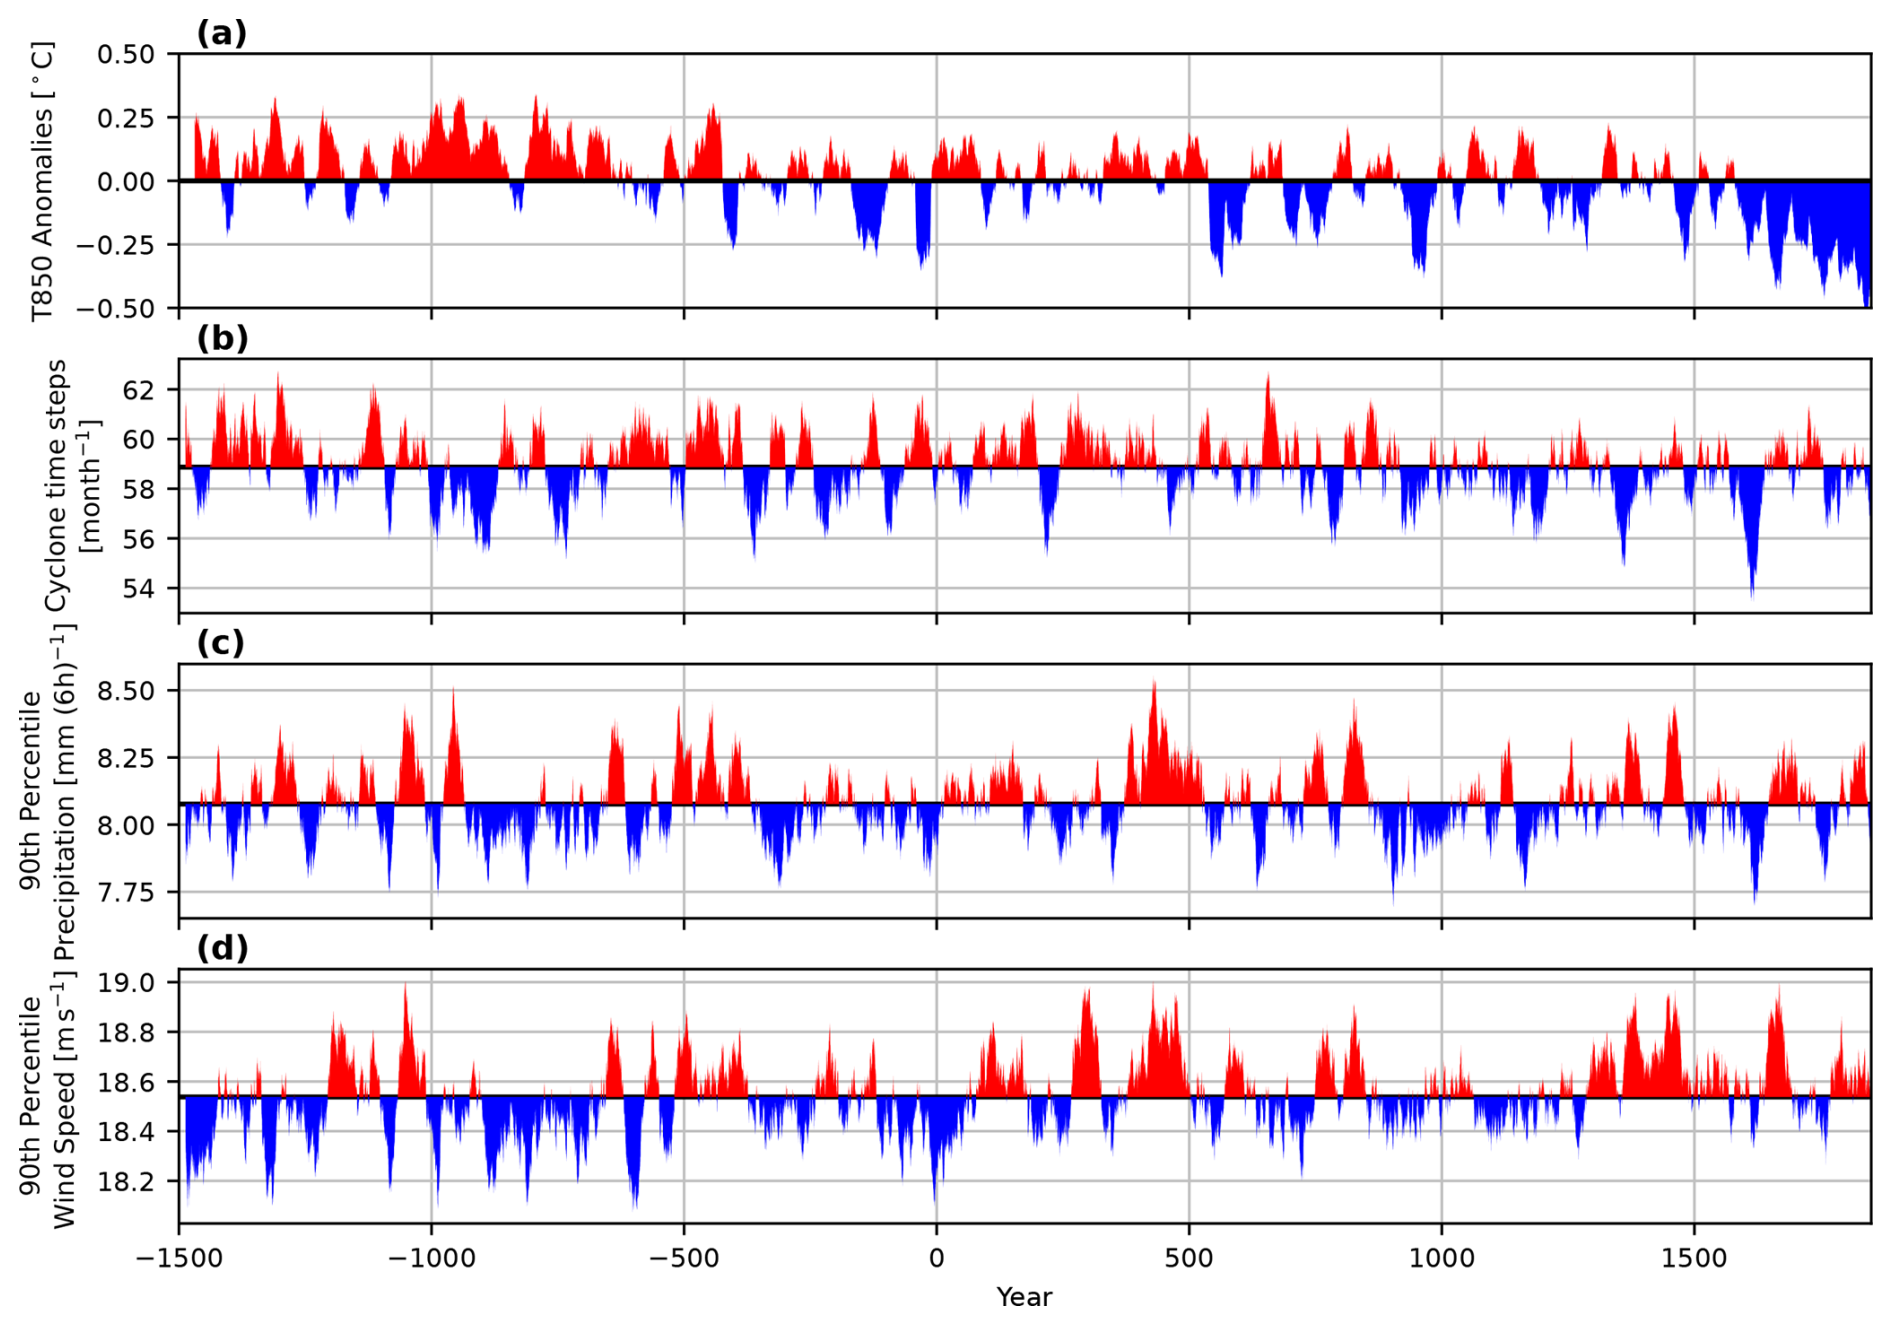
Figure 430-year running means of air temperature and several cyclone-related properties in the central and eastern Mediterranean regions (combined) during 1500 BCE and 1850 CE. Shown are (a) the 850 hPa temperature anomalies (in °C), (b) the cyclone frequency per month, (c) the 90th percentile of maximum cyclone-related precipitation (in mm (6 h)−1), and (d) the 90th percentile of maximum cyclone-related wind speed (in m s−1).
The cyclone frequency in the Mediterranean (Fig. 4b) also exhibits clear multi-decadal variability. The cyclone frequency in this figure is defined as the total number of grid cells that are occupied by a cyclone centre every month. Cyclone frequency exhibits a multi-decadal variability that varies in the order of 5 %. At the beginning of the simulation, a weak tendency towards a higher number of cyclones is found, whereas, towards the end of the simulation, there is a tendency towards fewer cyclones.
In Fig. 4c and d, we present the 30-year running mean of the 90th percentile of monthly maximum cyclone-related precipitation and cyclone-related wind speed, respectively. Identical to the other cyclone-related features, these time series are also dominated by multi-decadal variability. Periods with cyclones that achieve higher precipitation rates and wind speeds often coincide (Table S1). However, these variations are not driven by temperature anomalies or solar irradiance variations (not shown).
3.3 Atmospheric modes of circulation and cyclone features
Since the large-scale variability can be another important influence on Mediterranean cyclone frequency, we show the statistical relationships of the four most dominant modes of circulation in the North Atlantic European region with extratropical cyclones for DJF (Fig. 5). The modes are calculated with an EOF analysis applied to the CESM Z500 fields (see Sect. 2). The patterns resemble the North Atlantic Oscillation (NAO), the East Atlantic (EA) pattern, the East Atlantic/Western Russia (EAWR) pattern, and the Scandinavian (SCAN) pattern (Fig. S1). The NAO explains most of the variability in Z500 in DJF with 26.8 % (Fig. 5a), which is in agreement with previous studies (i.e. Barnston and Livezey, 1987). The NAO is followed by the SCAN pattern (11.8 %, Fig. 5d), the EA pattern (10.8 %, Fig. 5b), and the EAWR pattern (9.6 %, Fig. 5c).
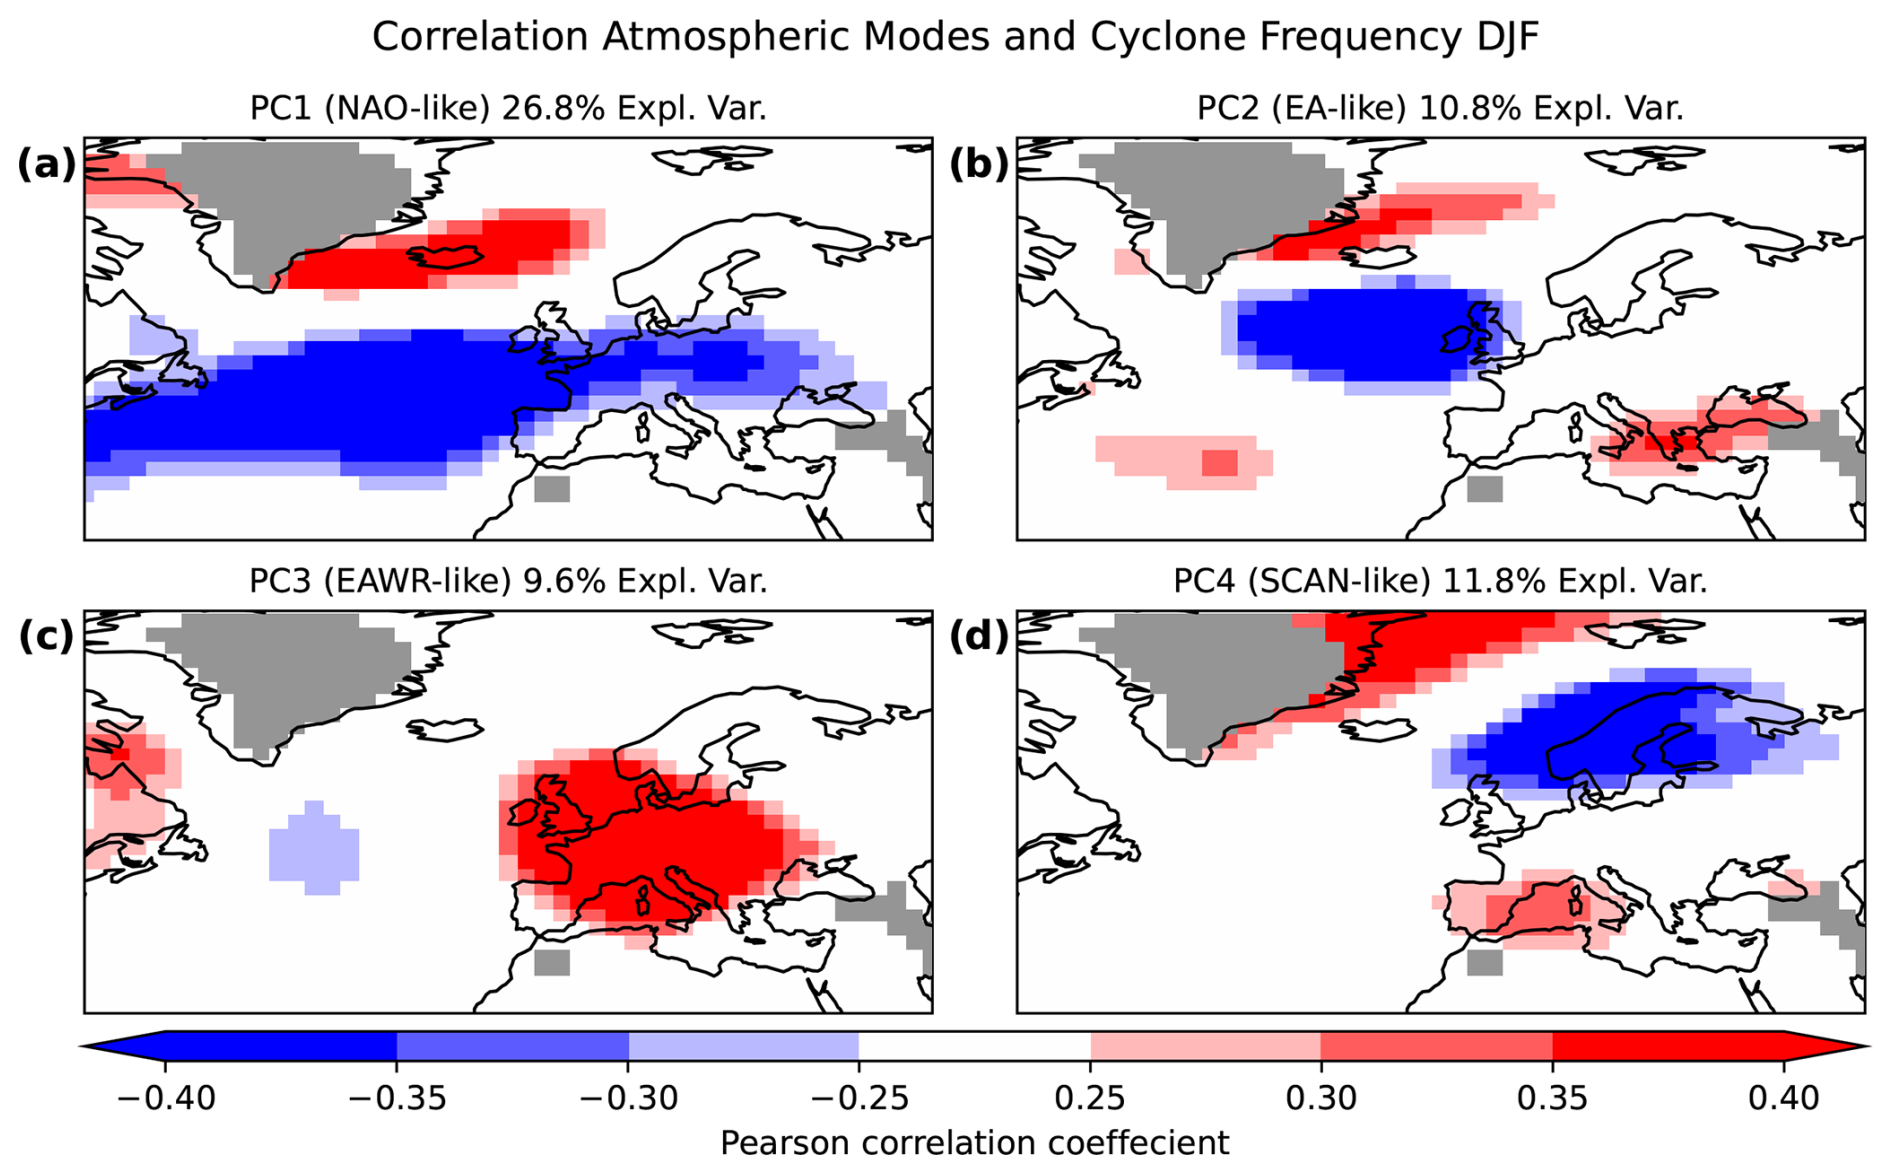
Figure 5The principal components that represent (a) the North Atlantic Oscillation (NAO), (b) the East Atlantic (EA) pattern, (c) the East Atlantic/Western Russia (EAWR) pattern, and (d) the Scandinavian (SCAN) pattern correlated to the local cyclone frequency (in d−1) using the Pearson correlation analysis. Red shading indicates a positive correlation, whereas blue shading indicates a negative correlation. The grey shading indicates grid cells with model topography above 1000 m (excluded from the analysis). All results are for DJF. The mean structures of the different patterns are shown in Fig. S1.
The NAO shows the highest correlation with cyclone frequency over the North Atlantic and central Europe (Fig. 5a). A strong negative correlation is found between the NAO and cyclone frequency over the Atlantic between 30 and 50° N (Fig. 5a), implying a northward shift in the jet when the NAO is in a positive state and vice versa. The EA mode is less impactful than the NAO on cyclone frequency (Fig. 5b). A positive EA phase is related to a decrease in cyclone frequency over the North Atlantic, whereas the area north of Iceland exhibits an increase in cyclone frequency. There is also an indication that cyclone frequency increases in the subtropical Atlantic and in the eastern Mediterranean during a positive EA phase and vice versa during a negative phase. The EAWR mode (Fig. 5c) exhibits a strong positive correlation with cyclone frequency over central Europe and the central Mediterranean, where a positive EAWR phase leads to an increase in cyclones in this area. Lastly, the SCAN mode is negatively correlated with cyclone frequency over Scandinavia and positively correlated with cyclone frequency in the Arctic Sea and in the western Mediterranean (Fig. 5d). We found no significant correlation between the four modes in Fig. 5 and cyclone-related precipitation or wind speed in the Mediterranean; therefore they are not shown.
For JJA, we find very similar patterns to those during DJF for the correlation between the atmospheric modes and cyclone frequency (Fig. S2). The main difference to DJF is that the atmospheric modes explain less variance due to the more chaotic nature of the atmosphere in summer; therefore, the correlations are less strong. We do not find any significant correlations for the Mediterranean in JJA.
In the previous sections, we mainly focused on the impact of climate variability on Mediterranean cyclones. Here, we shift the focus to the most extreme cyclones that can occur under climate conditions of the Late Holocene. In Fig. 6a–f, we show wind speed and precipitation composites for the EXC100 for the period 1500 BCE–1850 CE during DJF. Although these composites correspond to three distinct EXC types (precipitation, wind speed, and compounding events), it is important to acknowledge that an individual EXC may appear within the top 100 rankings across multiple metrics (Table S2).
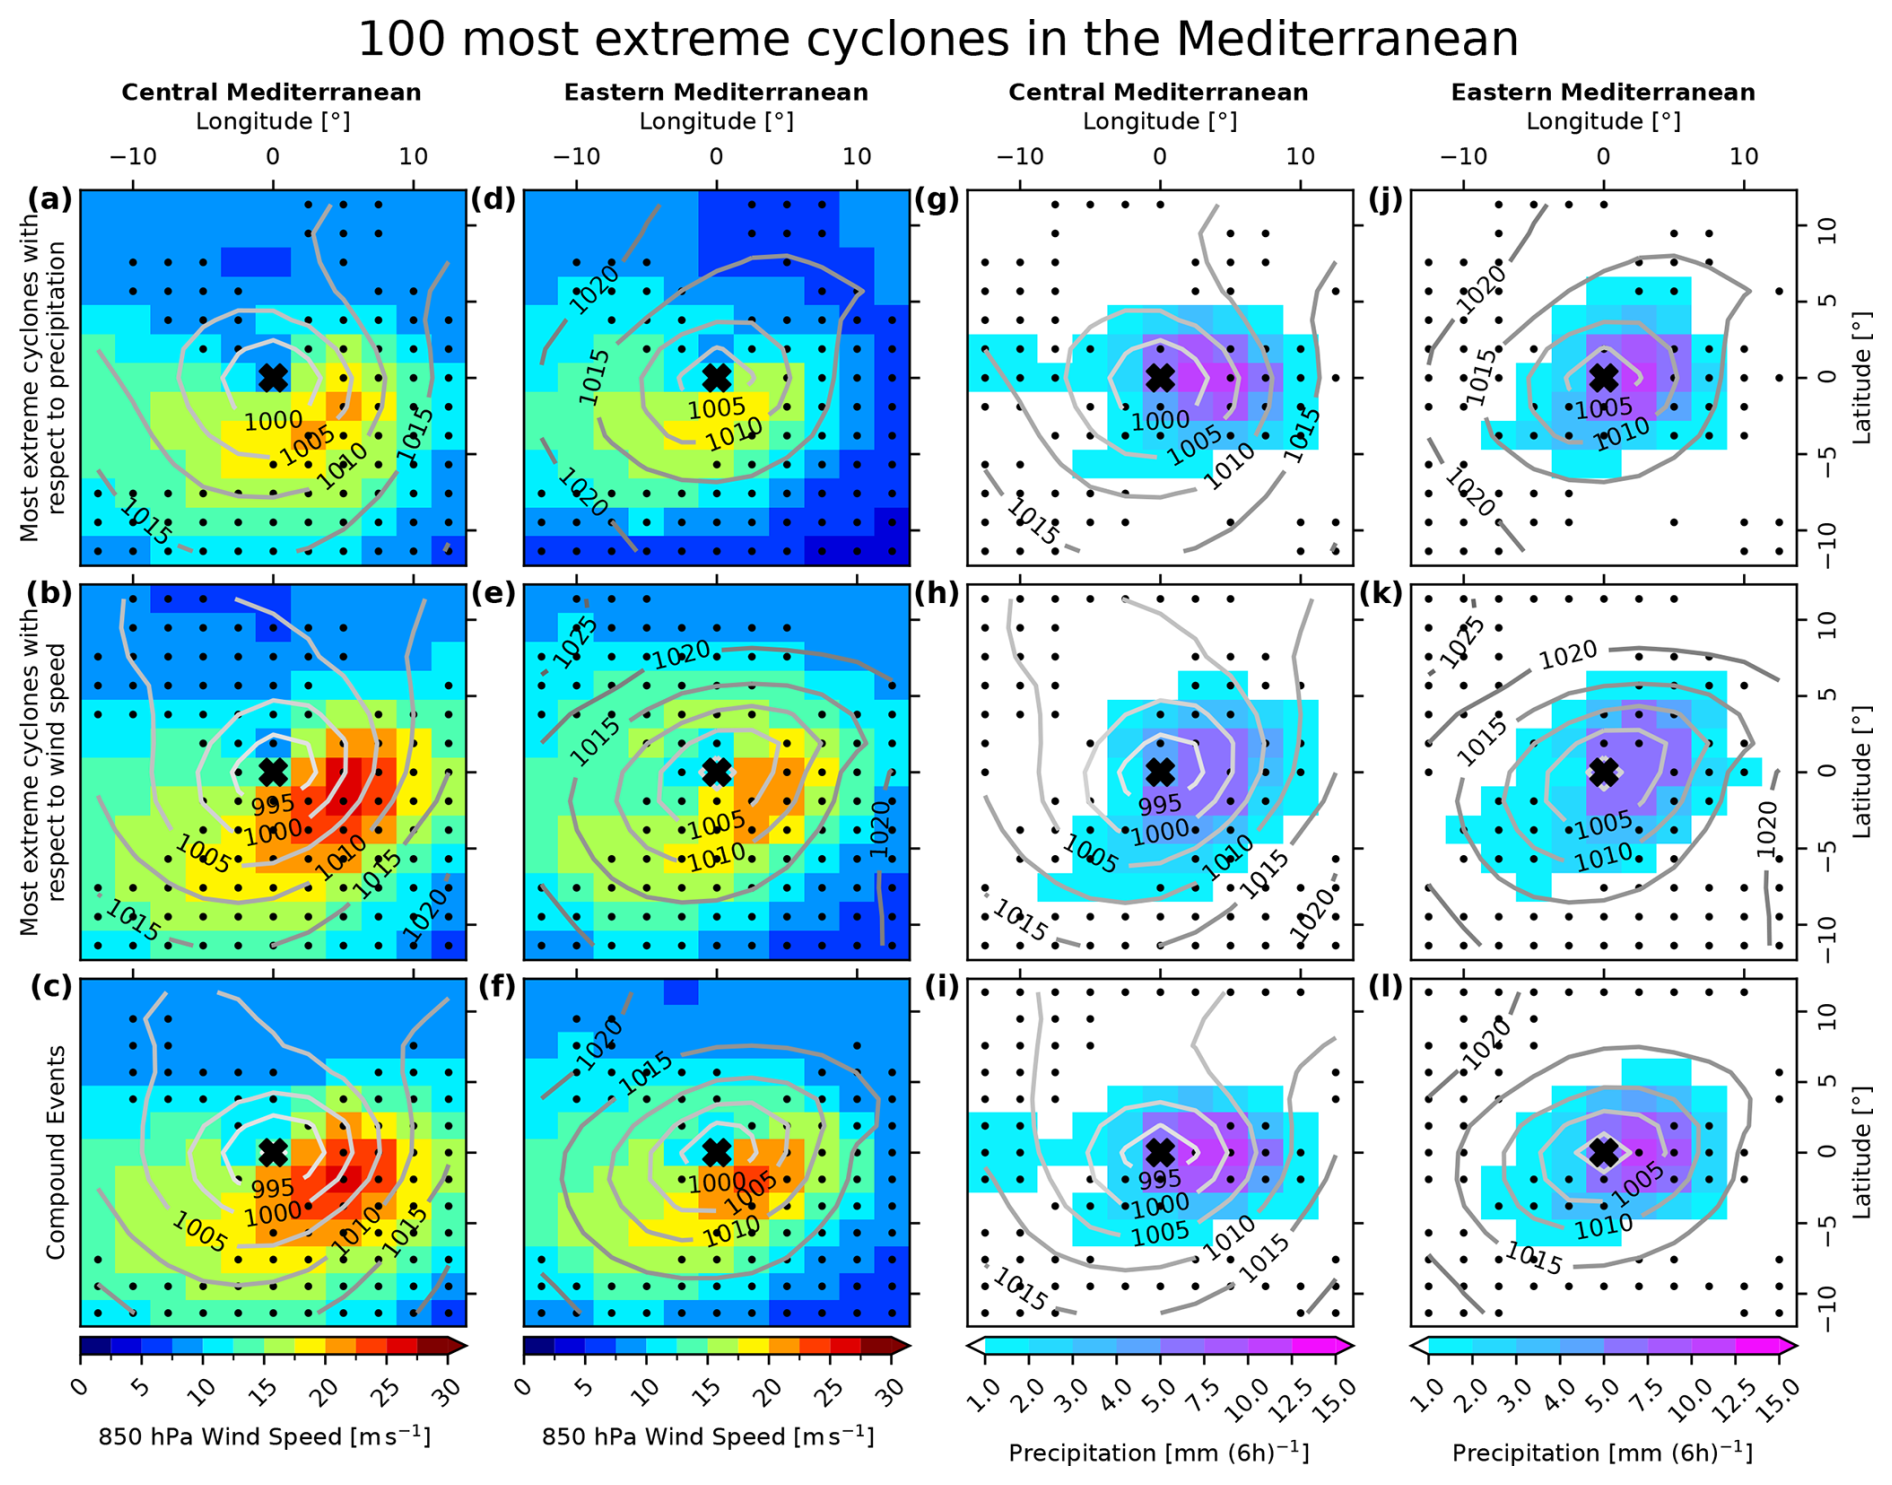
Figure 6Composite analysis for the 100 most extreme cyclones (EXC100) for the period 1500 BCE–1850 CE in the central Mediterranean (a–c, g–i) and in the eastern Mediterranean (d–f, j–l). For wind speed extremes, we use the time when the cyclone achieves minimal sea level pressure (t0); for precipitation extremes, we use the time step where maximum precipitation occurred. For composite events, we show the wind speed at t0 and the time step where maximum precipitation occurred. The EXC100 are estimated with respect to precipitation (top row), wind speed (middle row), and compounding events (bottom row). In panels (a)–(f), the colour shading shows WS850, and, in panels (g)–(l), the colour shading indicates 6-hourly precipitation. The stippling indicates where the difference for one event type is statistically significant at the 5 % level between the two regions. The grey contours indicate the composite mean sea level pressure.
In the composites, we see the general characteristics of an extratropical cyclone. The highest wind speeds are found on the southeastern flank of the EXC100. On the contrary, lower wind speeds are found on the northern flank of the EXC100 (Fig. 6a–f). The most intense precipitation is present just east of the cyclone core (Fig. 6g–l). However, typical structures associated with extratropical cyclones, such as fronts, are hard to identify due to the low horizontal resolution of the model. When comparing the composites between the regions, some notable differences are found. Generally, EXC100 in the central Mediterranean are stronger in terms of wind speed than EXC100 in the eastern Mediterranean. Wind speed EXC100 (Fig. 6b) in the central Mediterranean exceed 25 m s−1, whereas they barely exceed 20 m s−1 in the eastern Mediterranean (Fig. 6e). EXC100 are statistically significantly stronger in the central Mediterranean for the southeastern flank of the cyclone. However, wind speed EXC100 in the eastern Mediterranean are significantly stronger on the northern flank (Fig. 6e).
It must be noted that the region defined as the central Mediterranean in Fig. 1 is located more north and, therefore, may be more heavily influenced by the stronger midlatitude storm tracks. Secondly, wind speed and compounding EXC100 tend to have a lower core pressure than precipitation EXC100 in the order of 5 hPa. This holds true for the EXC100 in both the central and eastern Mediterranean. Compounding EXC100 show a similar pattern compared to wind speed EXCs for both regions.
As expected, precipitation EXC100 have much higher precipitation rates than wind speed EXCs with differences of up to 10 mm (6 h)−1. Compounding EXCs tend to produce precipitation rates comparable to those of EXCs with respect to precipitation. Differences between the central and eastern Mediterranean are statistically significant (5 % level) for precipitation EXCs, but, compared to wind speed EXCs, the grid cells that are significantly different are more randomly dispersed (stippling in Fig. 6).
The EXC100 composites for JJA show much lower extreme values with respect to wind speed and precipitation (Fig. S3). The differences for wind speed and precipitation are in the order of 50 % or more. This is expected, since cyclones in the Mediterranean are less extreme in summer compared to winter. However, EXC100 in the central Mediterranean produce stronger wind speeds and precipitation rates than in the eastern Mediterranean, where the cyclone barely appears in the composites in either sea level pressure, precipitation, or wind speed.
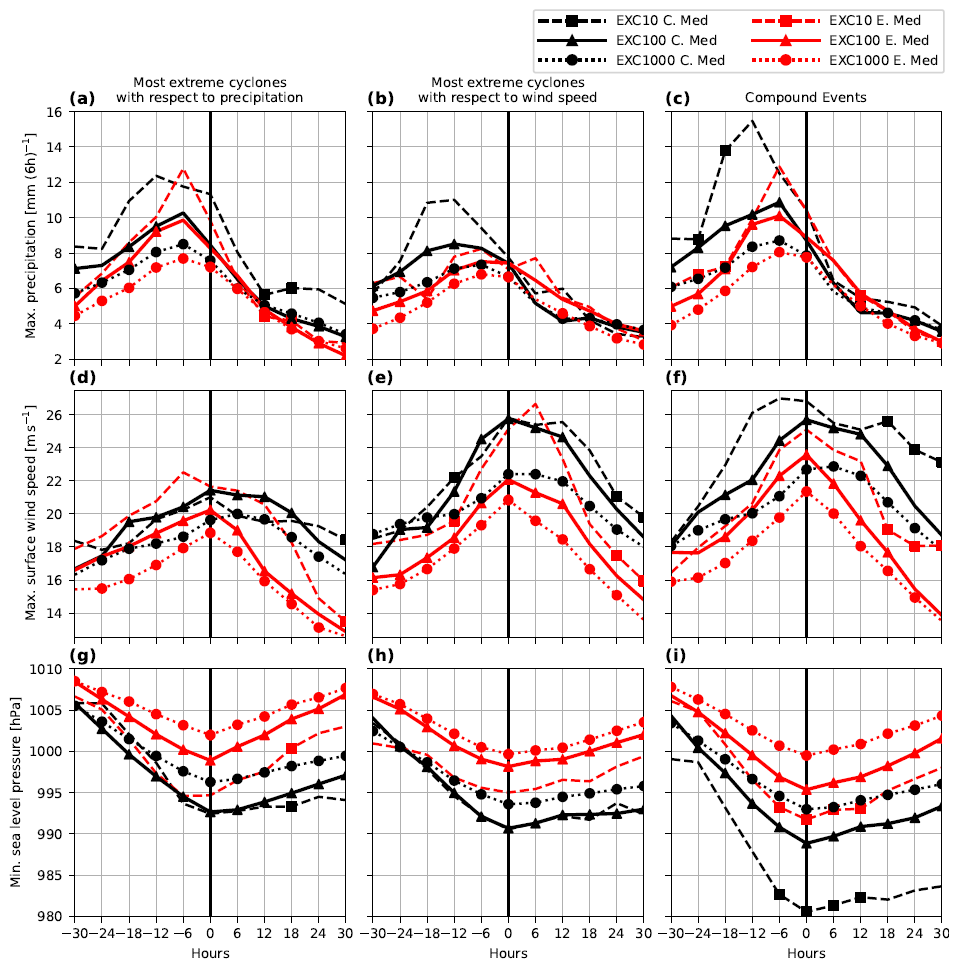
Figure 7The evolution of three extreme cyclone statistics in the central Mediterranean (in black) and in the eastern Mediterranean (in red). The values indicate the most extreme value of every composite for 6-hourly precipitation (in mm (6 h)−1) (a–c), 850 hPa wind speed (in m s−1) (d–f), and sea level pressure (in hPa) (g–i) for precipitation EXCs (a, d, g), wind speed EXCs (b, e, h), and compounding EXCs (c, f, i). The results are shown from 30 h before the extreme cyclone's minimum SLP until 30 h after the extreme cyclone's minimum SLP. The values for EXC10 (dashed line), EXC100 (solid line), and EXC1000 (dotted line) are shown. The markers indicate whether the differences between EXC10 (square), EXC100 (circle), and EXC1000 (triangle), respectively, are statistically significant at the 5 % level between the regions for a point in time.
To characterize the life cycle of extreme cyclones, we show the temporal evolution of EXC10, EXC100, and EXC1000 in the central and eastern Mediterranean during DJF (Fig. 7). We do this by selecting the most extreme value from each composite for every time step. Precipitation peaks about 6 h before t0 (Fig. 7a–c), whereas wind speed peaks at t0 (Fig. 7d–f). Interestingly, for wind speed EXCs, precipitation in the central Mediterranean tends to peak 12 h earlier than in the eastern Mediterranean (Fig. 7b). For precipitation, hardly any significant differences between the central and eastern Mediterranean can be found for the EXC100 for either precipitation, wind speed, or compounding events (Fig. 7a–c). However, the differences between the EXC1000 are significant most of the time, with EXC1000 producing more precipitation in the central Mediterranean, indicating a structural difference between less extreme cyclones in the two regions. In Fig. 7c, EXC10 stands out in terms of extremeness in precipitation in the central Mediterranean, as it reaches a maximum of around 15 mm (6 h)−1, although EXC10 shows little statistical significance along its track between the central and eastern Mediterranean for both precipitation and wind speed (Fig. 7a–f). Another notable difference between the eastern and central Mediterranean is that precipitation before t0 is generally higher in the central Mediterranean compared to the eastern Mediterranean (especially for wind speed and compounding EXC100 and EXC1000 in Fig. 7b and c), with differences of a few millimetres per 6 hours (mm (6 h)−1). However, the difference after t0 dissipates.
When looking at wind speed (Fig. 7d–f), the higher wind speeds in the central Mediterranean from Fig. 6 appear throughout the entire cyclone life span for all precipitation, wind speed, and compounding EXCs. These differences are significant for EXC100 and EXC1000 for most of their life cycle. Contrary to precipitation in Fig. 7a–c, these differences are also evident after t0 and become even larger.
EXCs deepen quickly in terms of SLP before t0, whereas they fill up more slowly after t0 (Fig. 7g–i). SLP is generally lower in the central Mediterranean than in the eastern Mediterranean, which may be due to the more southern location of the eastern Mediterranean region defined in Fig. 1. Interestingly enough, differences between EXC10, EXC100, and EXC1000 are larger for compounding events than for precipitation or wind speed EXCs, especially in the central Mediterranean.
Considering the temporal evolution during summer (Fig. S4), the differences between the eastern Mediterranean and the central Mediterranean are small for precipitation EXC100, although they consistently produce more precipitation in the central Mediterranean during their lifetime (Fig. S4a). In contrast to DJF (Fig. 7a,c), precipitation also peaks at t0 for precipitation and compounding EXCs. The differences between the two regions for wind speed EXCs and compounding events are large. EXC10 and EXC100 produce much higher wind speeds for wind speed EXCs and, to a lesser extent, compounding events in the central Mediterranean compared to the eastern Mediterranean (Fig. S4e–f). Still, apart from wind speed EXC10 and EXC100 in the central Mediterranean (Fig. S4e), wind speed and precipitation are in the order of 50 % less over the whole cyclone lifetime in JJA compared to DJF (Fig. 6). Interestingly, neither in the central Mediterranean nor in the eastern Mediterranean do SLPs fall during the deepening phase, nor do they rise again after t0 (Fig. S4g–i). Wind and compounding EXCs in JJA seem to only be able to produce wind speeds higher than 15 m s−1 in the central Mediterranean. It must be noted that our model is far too coarse to properly capture convective processes, which play an important role in summer, possibly leading to a misrepresentation of cyclone-related precipitation in JJA.
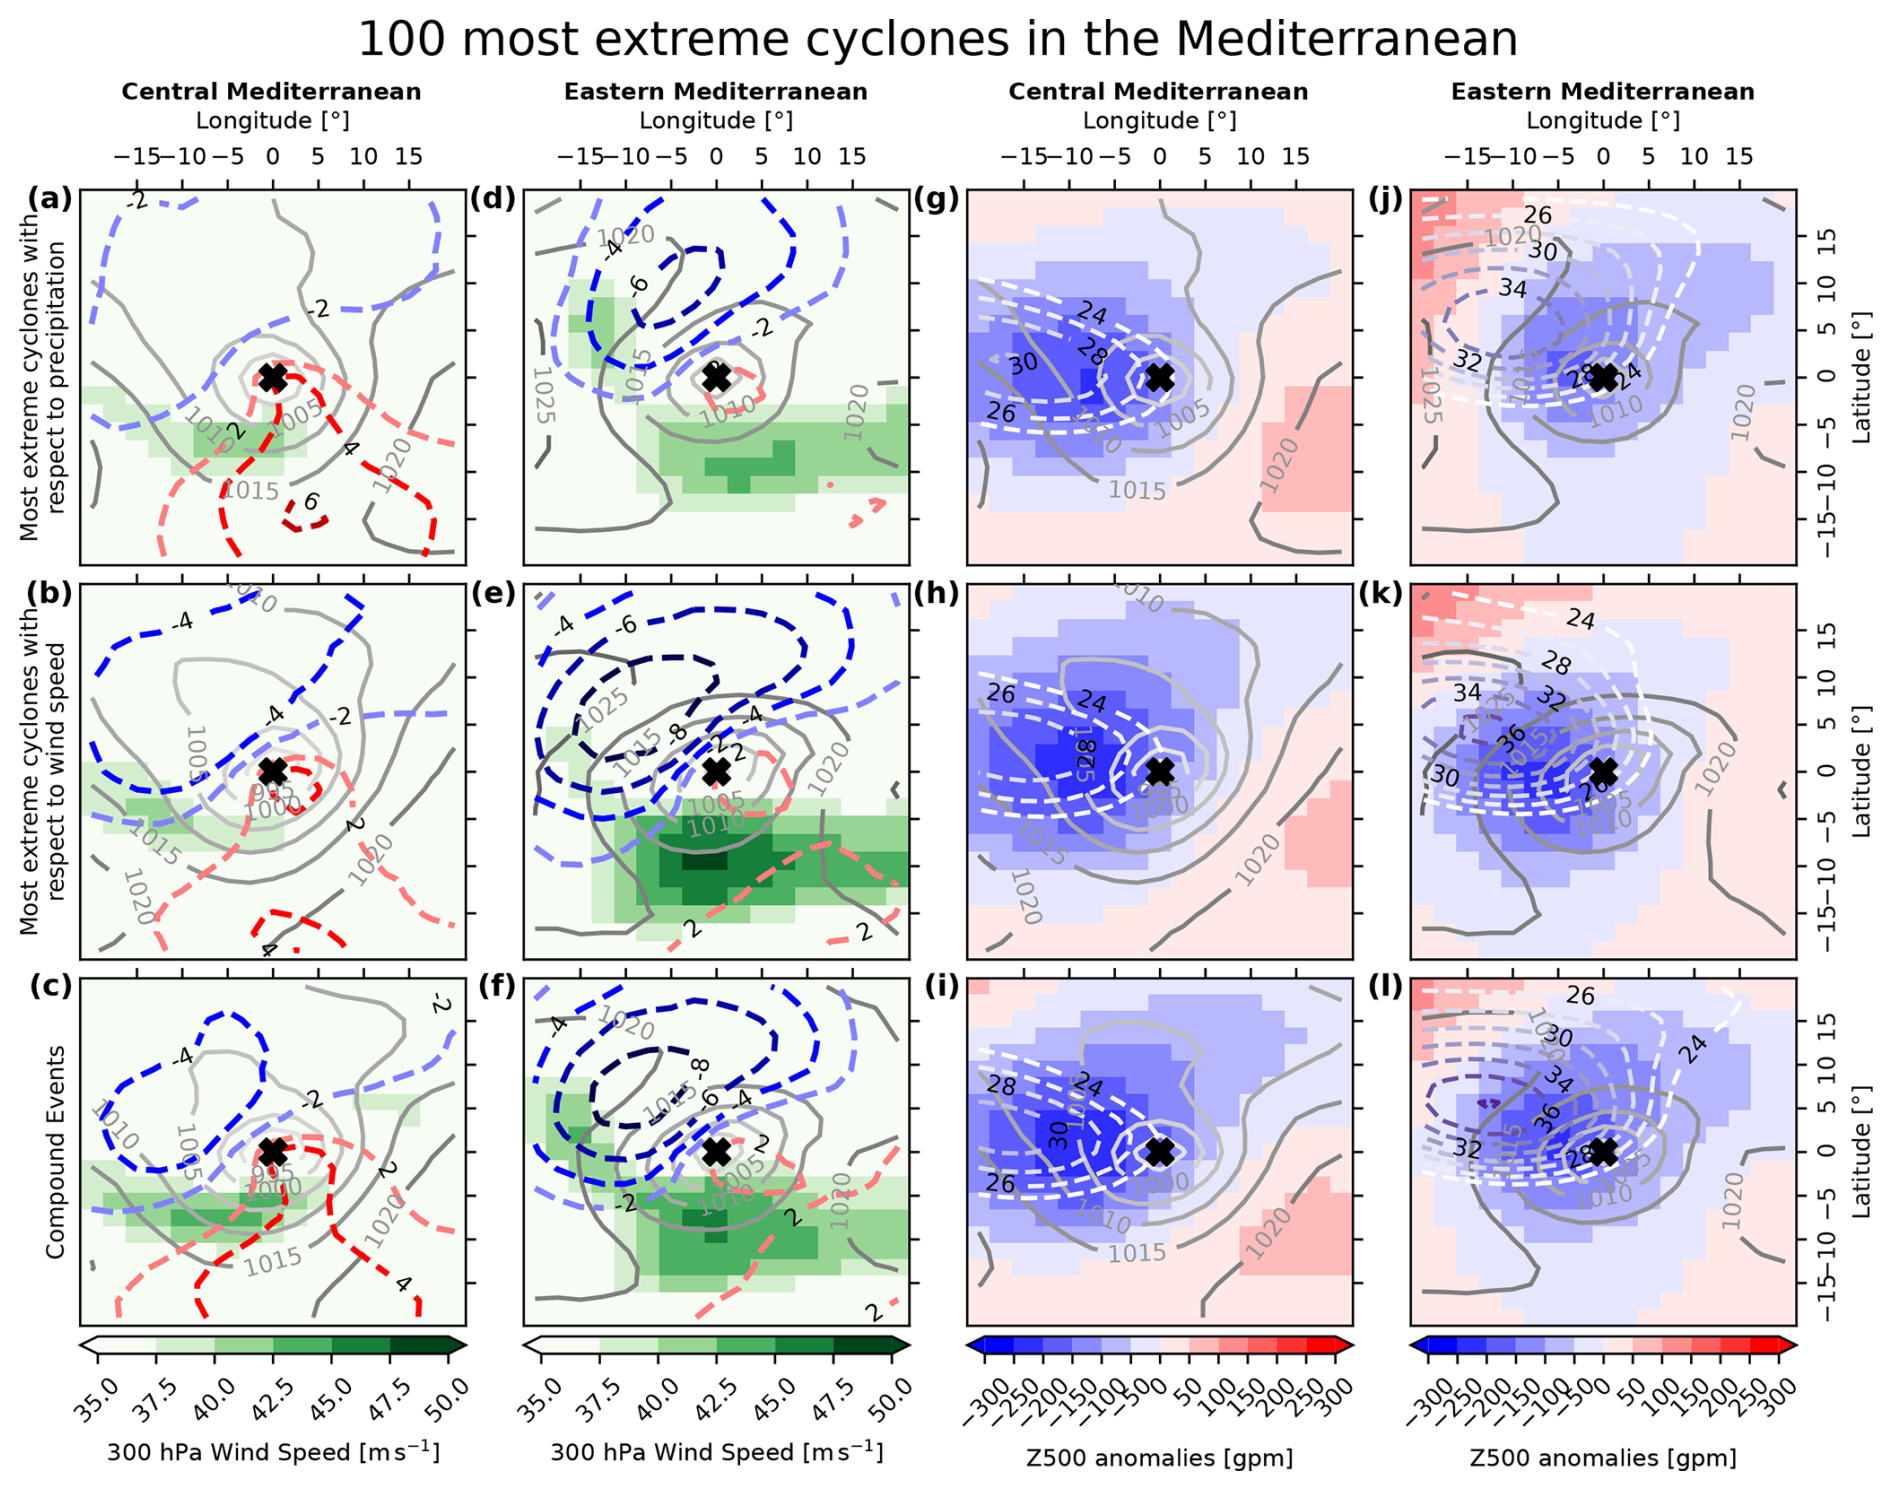
Figure 8Same as Fig. 6 but for 300 hPa wind speed (in m s−1; green shading) and 850 hPa temperature anomalies (in °C; red and blue contour lines) in panels (a)–(f). In panels (g)–(l), red–blue shadings show the 500 hPa geopotential height anomalies (in gpm), and the dashed white contour lines show the Rossby wave packet amplitude (in m s−1). The grey contour lines indicate the SLP in all panels.
To identify what drives the differences between the regions and the EXC types, we show the EXC100 composites of the conditions in the upper atmosphere. In Fig. 8a–f, cold air masses are located northwest of the EXC100 centre and warm air masses are located southeast of the EXC100 centre, highlighting the warm and cold sectors of the cyclones. The highest WS300 values are found south of the EXC100 centre, indicating that the jet stream is usually located south of the EXC100 centre.
The differences between the central and eastern Mediterranean in Fig. 8a–f are large. The jet stream south of the EXC100 centre in the eastern Mediterranean (up to 50 m s−1) is much stronger than over the central Mediterranean (up to 40 m s−1). Also, the jet stream is located southeast of the EXC100 centre in the eastern Mediterranean, whereas the jet stream in the central Mediterranean is only located south and southwest of the EXC100 centre. Given the location of our areas of interest, EXC100 in the eastern Mediterranean are generally located more south and closer to the subtropical jet. This explains the higher WS300 values in the eastern Mediterranean. Another difference between the two regions is that EXC100 in the eastern Mediterranean are related to much stronger intrusions of cold air in the lower troposphere northwest of the EXC100 centre (more than −8 °C compared to −4 °C in the central Mediterranean). Although the negative T850 anomalies are stronger over the eastern Mediterranean, EXC100 over the central Mediterranean are accompanied by stronger positive T850 anomalies over the southeastern flank of the EXC100 centre (more than 4 °C compared to 2 °C in the eastern Mediterranean).
In Fig. 8g–l, the cyclone centres are often located just east of the lowest Z500 anomalies and the maximum RWP amplitude, highlighting a westward tilting of the cyclone in the upper atmosphere that indicates that these cyclones grow baroclinically. Also, EXC100 composites are accompanied by weak positive Z500 anomalies southeast of the EXC100 centre.
Wind speed EXC100 are associated with higher WS300 values and T850 gradients. This indicates that precipitation EXC100 require less dynamical forcing than wind speed EXC100. Interestingly, positive T850 anomalies within the warm sector do not differ between EXC100 subtypes within the regions, whereas negative T850 anomalies within the cold sector are usually stronger for wind speed EXC100 and compounding EXC100 than for precipitation EXC100.
EXC100 in the central Mediterranean are accompanied by a spatially larger negative Z500 anomaly than in the eastern Mediterranean. Precipitation EXC100 are associated with less strong Z500 anomalies than the other two EXC100 types (only going up to 200 gpm). The Z500 anomalies for precipitation EXCs in the eastern Mediterranean are especially small in size.
Negative Z500 anomalies are often associated with troughs, which can be linked to intruding Rossby waves, explaining why an RWP is present for all EXC100 types and regions. The centre of the RWP is located slightly west of the centre of the Z500 anomaly. RWPs for EXC100 in the eastern Mediterranean have a larger amplitude (up to 38 m s−1) than EXC100 in the central Mediterranean (up to 30 m s−1). This indicates that intruding Rossby waves play a crucial role in cyclone development in the eastern Mediterranean. Strikingly, the RWP amplitude between EXC100 types for the same regions seems to be similar. It seems that compounding EXCs in the eastern Mediterranean (Fig. 8l) are associated with a slightly stronger RWP amplitude than precipitation and wind speed EXCs (Fig. 8j–k). However, this difference is small and cannot be seen in the central Mediterranean.
The EXC100 composites for the upper atmosphere during JJA (Fig. S5) show generally lower values for WS300, T850 anomalies, Z500 anomalies, and RWP amplitude compared to the EXC100 composites in Fig. 8. The only exceptions here are the T850 anomalies for the central Mediterranean that are stronger in JJA by about 2 °C (Fig. S5a–c). Also, the relative differences between JJA and DJF are much larger in the eastern Mediterranean compared to the central Mediterranean. The difference between the two seasons indicates that the upper atmosphere related to EXCs is much less dynamically active in summer, leading to fewer extreme cyclones. However, in JJA, the WS300 and the RWP amplitude composites are strongest in the central Mediterranean, in contrast to DJF, where WS300 and RWP amplitude are strongest in the eastern Mediterranean, suggesting the subtropical jet plays a much smaller role in the eastern Mediterranean in summer. The jet stream only plays a role for EXC100 with respect to wind speed in the eastern Mediterranean (Fig. S5e).
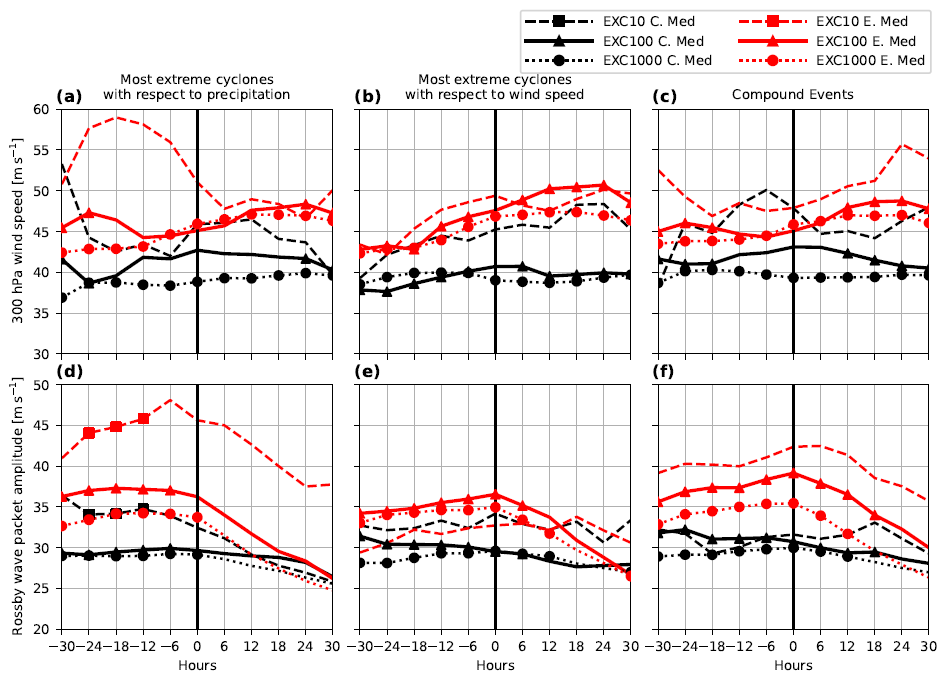
Figure 9Same as Fig. 7 but for 300 hPa wind speed (in m s−1) (a–c) and Rossby wave packet amplitude (m s−1) (d–f).
In Fig. 9, we show the time series of the maxima in WS300 (Fig. 9a–c) and RWP amplitude (Fig. 9d–e) during the cyclone lifetime. As already shown in Fig. 8, we find that, at t0, the values for RWP amplitude and WS300 are higher in the eastern Mediterranean than in the central Mediterranean. Generally speaking, this holds true for most of the EXC life cycle. However, there are some exceptions to this. For the EXC100, the differences are only statistically significant for the wind speed EXCs (Fig. 9b). Also, after t0, WS300 increases for all EXC event types in the eastern Mediterranean, leading to a larger difference for WS300 between the eastern and central Mediterranean. Also, there is only a small difference between WS300 values for EXC10, EXC100, or EXC1000 during the life cycle of a cyclone in the eastern Mediterranean (compound events being the only exception). In the central Mediterranean, only the EXC10 stand out in terms of WS300 values. This would imply that the strength of the jet stream only plays an important role for the most extreme cyclones.
Throughout the entire EXC life cycle, the RWP amplitude is also higher in the eastern Mediterranean compared to the central Mediterranean. This difference is significant for wind speed and compounding EXC100. After t0, this gap diminishes, indicating that the peak RWP amplitude plays a stronger role in EXC development for the eastern Mediterranean than for the central Mediterranean.
The temporal evolution of WS300 and RWP amplitude during JJA (Fig. S6) is similar to the temporal evolution in Fig. 9. WS300 values stay more or less constant during the whole cyclone lifetime, whereas maximum RWP amplitude decreases after t0. One exception is the RWP amplitude in the eastern Mediterranean that stays around 15 m s−1. The main differences compared to DJF are that maximum values for WS300 and RWP amplitude are lower and that the regions with the highest values are the central Mediterranean compared to the eastern Mediterranean in DJF.
In this study, the impact of climate variability on Mediterranean cyclones is analysed for the period from 1500 BCE to 1850 CE using CESM. Moreover, we present the major characteristics of extreme cyclones in the region for this time period. While substantial research has explored how present and future climatic states affect the occurrence and intensity of Mediterranean cyclones (Raible et al., 2010; Lionello et al., 2016; Hochman et al., 2020), this study is novel in providing a baseline for Mediterranean cyclones within a multi-millennial perspective not affected by anthropogenic global warming.
We find that periods with higher and lower cyclone frequency and intensity in the Mediterranean exhibit a clear multi-decadal variability in the order of 5 % from the multi-millennial mean. The dominant atmospheric modes of atmospheric circulation in the Atlantic European region only explain some of the variance in cyclone frequency in the Mediterranean, whereas they show stronger correlations with cyclone frequency in the North Atlantic and northern Europe.
Raible et al. (2018) used an older version of CESM but with a higher horizontal resolution (1.0°×1.0°) to track cyclones in the North Atlantic and over Europe. The biases they observed are similar to the results presented here, with an overestimation of cyclone frequency near the Greenland ice sheet and a northward shift in the storm tracks. Compared to the ERA5 reanalysis, we have shown that our cyclone detection and tracking algorithm within our model simulation captures the extreme cyclones in the Mediterranean region well, even though the horizontal resolution of the climate model used is too coarse, as discussed in Flaounas et al. (2013). However, it should be noted that the cyclone-related precipitation and wind speed in CESM are underestimated compared to ERA5. The weak relations between the cyclone frequency and the most dominant modes of circulation in the Mediterranean are similar to those found by Seierstad et al. (2007) and Walz et al. (2018). However, the low resolution of our model may hamper the ability to find further relations between cyclone frequency and modes of circulation. We also find that the variability in Mediterranean cyclones is very similar to what Raible et al. (2018) observed for North Atlantic cyclones in the aforementioned earlier version of CESM. They revealed that the cyclone variability is not driven by solar irradiance variations. Our results show no significant relationship between the Mediterranean cyclone variability and solar irradiance, which confirms the aforementioned study. It is reported that, in CMIP5 models with relatively coarse horizontal resolutions, the winter North Atlantic storm tracks tend to show a southward displacement and too few cyclones in the Mediterranean (Zappa et al., 2014; Müller et al., 2018). Despite our model showing a northward bias, it also produces too few cyclones in the Mediterranean. These biases influence the NAO variability, which is related to the extratropical and Mediterranean cyclone variability. Still, our simulation provides a long transient simulation of the last 3350 years, thereby allowing the investigation of long-term temporal variability in cyclones and related features.
Our extreme cyclone (EXC) composites show that wind speed EXCs are generally stronger in the central Mediterranean compared to the eastern Mediterranean. The difference between the two regions for precipitation EXCs is much less clear, and, overall, there does not seem to be a large difference between the two regions for precipitation EXCs. On average, precipitation tends to peak 6 to 12 h earlier than t0. This is consistent with Messmer and Simmonds (2021) and Raveh-Rubin and Wernli (2015), who found that precipitation peaks before wind speed in the ERA5 reanalysis, and with Booth et al. (2018), who showed that the precipitation on average peaks 12 h prior to the dynamical strength maximum of a cyclone based on satellite data. Our findings indicate that EXCs in the central Mediterranean can have a higher potential impact on society, mainly due to their higher potential wind speeds. This is amplified by the fact that EXCs in the central Mediterranean tend to be more extreme in terms of wind speed over their entire life cycle and not only at t0.
Flaounas et al. (2015b) performed a similar composite analysis of intense cyclones using a regional model with a higher horizontal resolution (20 km horizontal resolution) but considering the Mediterranean basin as a whole for the period 1989–2008. Despite the higher resolution, the structure and the location of the area with the most intense precipitation are similar to the results presented here, which gives us confidence in the ability of CESM to produce extreme cyclones despite the low resolution of our model. They also suggest that the subtropical jet might play a crucial role in cyclone development by providing barotropic shear. Despite the fact that the subtropical jet is clearly more dominant in the eastern Mediterranean in winter, this does not result in stronger cyclones over the region and may not be the driving factor for the development of EXCs.
Homar et al. (2007) showed that the central Mediterranean experiences more intense Mediterranean cyclones than the eastern Mediterranean. This is in line with our results, where we observe more intense wind speed EXCs in the central Mediterranean, since wind speed EXCs require a deeper and better developed cyclone than precipitation EXCs. However, Flaounas et al. (2023) showed that there is no difference between the two regions in the occurrence of intense cyclones using composite tracks in the ERA5 reanalysis. Nevertheless, our simulation has the advantage that, due to the long time period, the effect of natural variability should be averaged out, adding to the hypothesis of Homar et al. (2007).
To conclude, there is no obvious single driver of Mediterranean cyclone variability. Mediterranean cyclones vary on multi-decadal timescales around roughly 5 % from the multi-millennial mean. Additionally, our findings indicate that cyclones may have a stronger socio-economic impact in the central Mediterranean than in the eastern Mediterranean, especially in terms of wind speed extremes. Our study offers a climatological reference baseline for understanding extreme cyclones in the region. Having this reference baseline is also beneficial for quantifying the effects of future climate change on Mediterranean cyclones. Nonetheless, the low resolution of the model simulation used is a major drawback. Thus, future work on the long-term variability in cyclones using a higher-resolution model is needed, as pointed out by Flaounas et al. (2013). For instance, a regional climate model can be used to downscale parts of this CESM simulation to provide more realistic insights into extreme Mediterranean cyclones and their intensification processes.
The cyclone tracking was performed with the detection and tracking scheme of Blender et al. (1997) and is available on request. The other analysis steps were performed with Python scripts. As they are standard methods, they are not uploaded to a repository. These scripts are available on request.
The ERA5 data are provided by the Copernicus Climate Change Service Climate Data Store (CDS) on their website at https://doi.org/10.24381/cds.adbb2d47 (Hersbach et al., 2023a) and https://doi.org/10.24381/cds.bd0915c6 (Hersbach et al., 2023b). Post-processed CESM and ERA5 data used for the study are available at https://doi.org/10.5281/zenodo.13619444 (Doensen, 2024). Complete CESM1.2.2 data are locally stored and are available upon request.
The supplement related to this article is available online at https://doi.org/10.5194/cp-21-1305-2025-supplement.
OD, MM, WMK, and CCR contributed to the design of the study. WMK carried out the climate simulations. OD performed the principal analysis and wrote the article under the supervision of CCR. MM, WMK, and CCR provided critical feedback on the results and drafted the article together with OD. All authors contributed to the writing and scientific discussion.
The contact author has declared that none of the authors has any competing interests.
Publisher's note: Copernicus Publications remains neutral with regard to jurisdictional claims made in the text, published maps, institutional affiliations, or any other geographical representation in this paper. While Copernicus Publications makes every effort to include appropriate place names, the final responsibility lies with the authors.
We acknowledge the Swiss National Supercomputing Centre (CSCS) in Lugano, Switzerland, for providing the necessary computational resources and supercomputing architecture to perform the simulations under project no. s1248.
This research has been supported by the Schweizerischer Nationalfonds zur Förderung der Wissenschaftlichen Forschung (grant nos. IZCOZ0_205416 and 200020_172745).
This paper was edited by Laurie Menviel and reviewed by two anonymous referees.
Alpert, P. and Ziv, B.: The Sharav cyclone: observations and some theoretical considerations, J. Geophys. Res.-Atmos., 94, 18495–18514, https://doi.org/10.1029/JD094iD15p18495, 1989. a
Barnston, A. G. and Livezey, R. E.: Classification, seasonality and persistence of low-frequency atmospheric circulation patterns, Mon. Weather Rev., 115, 1083–1126, https://doi.org/10.1175/1520-0493(1987)115<1083:CSAPOL>2.0.CO;2, 1987. a
Blender, R., Fraedrich, K., and Lunkeit, F.: Identification of cyclone-track regimes in the North Atlantic, Q. J. Roy. Meteor. Soc., 123, 727–741, https://doi.org/10.1002/qj.49712353910, 1997. a, b
Booth, J. F., Naud, C. M., and Jeyaratnam, J.: Extratropical cyclone precipitation life cycles: A satellite-based analysis, Geophys. Res. Lett., 45, 8647–8654, https://doi.org/10.1029/2018GL078977, 2018. a
Brandimarte, L., Di Baldassarre, G., Bruni, G., D'Odorico, P., and Montanari, A.: Relation between the North-Atlantic Oscillation and hydroclimatic conditions in Mediterranean areas, Water Resour. Manage., 25, 1269–1279, https://doi.org/10.1007/s11269-010-9742-5, 2011. a
Campins, J., Genovés, A., Picornell, M., and Jansà, A.: Climatology of Mediterranean cyclones using the ERA-40 dataset, Int. J. Climatol., 31, 1596–1614, https://doi.org/10.1002/joc.2183, 2011. a
Carn, S., Clarisse, L., and Prata, A. J.: Multi-decadal satellite measurements of global volcanic degassing, J. Volcanol. Geoth. Res., 311, 99–134, https://doi.org/10.1016/j.jvolgeores.2016.01.002, 2016. a
Cavicchia, L., von Storch, H., and Gualdi, S.: A long-term climatology of medicanes, Clim. Dynam., 43, 1183–1195, https://doi.org/10.1007/s00382-013-1893-7, 2014. a
Degeai, J.-P., Devillers, B., Dezileau, L., Oueslati, H., and Bony, G.: Major storm periods and climate forcing in the Western Mediterranean during the Late Holocene, Quaternary Sci. Rev., 129, 37–56, https://doi.org/10.1016/j.quascirev.2015.10.009, 2015. a, b
Doensen, O.: Characterization of the mean and extreme Mediterranean cyclones and their variability during the period 1500 BCE to 1850 CE, Zenodo [data set], https://doi.org/10.5281/zenodo.13619444, 2024. a
Doiteau, B., Pantillon, F., Plu, M., Descamps, L., and Rieutord, T.: Systematic evaluation of the predictability of different Mediterranean cyclone categories, Weather Clim. Dynam., 5, 1409–1427, https://doi.org/10.5194/wcd-5-1409-2024, 2024. a
Ferrarin, C., Bajo, M., Benetazzo, A., Cavaleri, L., Chiggiato, J., Davison, S., Davolio, S., Lionello, P., Orlić, M., and Umgiesser, G.: Local and large-scale controls of the exceptional Venice floods of November 2019, Progr. Oceanogr., 197, 102628, https://doi.org/10.1016/j.pocean.2021.102628, 2021. a
Feser, F., Barcikowska, M., Krueger, O., Schenk, F., Weisse, R., and Xia, L.: Storminess over the North Atlantic and northwestern Europe – A review, Q. J. Roy. Meteor. Soc., 141, 350–382, https://doi.org/10.1002/qj.2364, 2015. a
Flaounas, E., Drobinski, P., and Bastin, S.: Dynamical downscaling of IPSL-CM5 CMIP5 historical simulations over the Mediterranean: benefits on the representation of regional surface winds and cyclogenesis, Clim. Dynam., 40, 2497–2513, https://doi.org/10.1007/s00382-012-1606-7, 2013. a, b, c
Flaounas, E., Kotroni, V., Lagouvardos, K., and Flaounas, I.: CycloTRACK (v1.0) – tracking winter extratropical cyclones based on relative vorticity: sensitivity to data filtering and other relevant parameters, Geosci. Model Dev., 7, 1841–1853, https://doi.org/10.5194/gmd-7-1841-2014, 2014. a
Flaounas, E., Lagouvardos, K., Kotroni, V., Claud, C., Delanoë, J., Flamant, C., Madonna, E., and Wernli, H.: Processes leading to heavy precipitation associated with two Mediterranean cyclones observed during the HYMEX SOP1, Q. J. Roy. Meteor. Soc., 142, 275–286, https://doi.org/10.1002/qj.2618, 2015a. a
Flaounas, E., Raveh-Rubin, S., Wernli, H., Drobinski, P., and Bastin, S.: The dynamical structure of intense Mediterranean cyclones, Clim. Dynam., 44, 2411–2427, https://doi.org/10.1007/s00382-014-2330-2, 2015b. a, b
Flaounas, E., Kelemen, F. D., Wernli, H., Gaertner, M. A., Reale, M., Sanchez-Gomez, E., Lionello, P., Calmanti, S., Podrascanin, Z., Somot, S., Akhtar, N., Romera, R., and Conte, D.: Assessment of an ensemble of ocean–atmosphere coupled and uncoupled regional climate models to reproduce the climatology of Mediterranean cyclones, Clim. Dynam., 51, 1023–1040, https://doi.org/10.1007/s00382-016-3398-7, 2018. a
Flaounas, E., Davolio, S., Raveh-Rubin, S., Pantillon, F., Miglietta, M. M., Gaertner, M. A., Hatzaki, M., Homar, V., Khodayar, S., Korres, G., Kotroni, V., Kushta, J., Reale, M., and Ricard, D.: Mediterranean cyclones: current knowledge and open questions on dynamics, prediction, climatology and impacts, Weather Clim. Dynam., 3, 173–208, https://doi.org/10.5194/wcd-3-173-2022, 2022. a
Flaounas, E., Aragão, L., Bernini, L., Dafis, S., Doiteau, B., Flocas, H., Gray, S. L., Karwat, A., Kouroutzoglou, J., Lionello, P., Miglietta, M. M., Pantillon, F., Pasquero, C., Patlakas, P., Picornell, M. Á., Porcù, F., Priestley, M. D. K., Reale, M., Roberts, M. J., Saaroni, H., Sandler, D., Scoccimarro, E., Sprenger, M., and Ziv, B.: A composite approach to produce reference datasets for extratropical cyclone tracks: application to Mediterranean cyclones, Weather Clim. Dynam., 4, 639–661, https://doi.org/10.5194/wcd-4-639-2023, 2023. a
Fragkoulidis, G., Wirth, V., Bossmann, P., and Fink, A.: Linking Northern Hemisphere temperature extremes to Rossby wave packets, Q. J. Roy. Meteor. Soc., 144, 553–566, https://doi.org/10.1002/qj.3228, 2018. a
Gagen, M. H., Zorita, E., McCarroll, D., Zahn, M., Young, G. H., and Robertson, I.: North Atlantic summer storm tracks over Europe dominated by internal variability over the past millennium, Nat. Geosci., 9, 630–635, https://doi.org/10.1038/ngeo2752, 2016. a
Harrison, S. P., Bartlein, P., Izumi, K., Li, G., Annan, J., Hargreaves, J., Braconnot, P., and Kageyama, M.: Evaluation of CMIP5 palaeo-simulations to improve climate projections, Nat. Clim. Change, 5, 735–743, https://doi.org/10.1038/nclimate2649, 2015. a
Hersbach, H., Bell, B., Berrisford, P., Hirahara, S., Horányi, A., Muñoz-Sabater, J., Nicolas, J., Peubey, C., Radu, R., Schepers, D., Simmons, A., Soci, C., Abdalla, S., Abellan, X., Balsamo, G., Bechtold, P., Biavati, G., Bidlot, J., Bonavita, M., De Chiara, G., Dahlgren, P., Dee, D., Diamantakis, M., Dragani, R., Flemming, J., Forbes, R., Fuentes, M., Geer, A., Haimberger, L., Healy, S., Hogan, R. J., Hólm, E., Janisková, M., Keeley, S., Laloyaux, P., Lopez, P., Lupu, C., Radnoti, G., de Rosnay, P., Rozum, I., Vamborg, F., Villaume, S., and Thépaut, J.: The ERA5 global reanalysis, Q. J. Roy. Meteor. Soc., 146, 1999–2049, https://doi.org/10.1002/qj.3803, 2020. a
Hersbach, H., Bell, B., Berrisford, P., Biavati, G., Horányi, A., Muñoz Sabater, J., Nicolas, J., Peubey, C., Radu, R., Rozum, I., Schepers, D., Simmons, A., Soci, C., Dee, D., and Thépaut, J.-N.: ERA5 hourly data on single levels from 1940 to present, Copernicus Climate Change Service (C3S) Climate Data Store (CDS) [data set], https://doi.org/10.24381/cds.adbb2d47, 2023a. a
Hersbach, H., Bell, B., Berrisford, P., Biavati, G., Horányi, A., Muñoz Sabater, J., Nicolas, J., Peubey, C., Radu, R., Rozum, I., Schepers, D., Simmons, A., Soci, C., Dee, D., and Thépaut, J.-N.: ERA5 hourly data on pressure levels from 1940 to present, Copernicus Climate Change Service (C3S) Climate Data Store (CDS), https://doi.org/10.24381/cds.bd0915c6, 2023b. a
Hochman, A., Alpert, P., Kunin, P., Rostkier-Edelstein, D., Harpaz, T., Saaroni, H., and Messori, G.: The dynamics of cyclones in the twentyfirst century: the Eastern Mediterranean as an example, Clim. Dynam., 54, 561–574, https://doi.org/10.1007/s00382-019-05017-3, 2020. a, b
Hofstätter, M. and Blöschl, G.: Vb cyclones synchronized with the Arctic-/North Atlantic oscillation, J. Geophys. Res.-Atmos., 124, 3259–3278, https://doi.org/10.1029/2018JD029420, 2019. a
Homar, V., Jansà, A., Campins, J., Genovés, A., and Ramis, C.: Towards a systematic climatology of sensitivities of Mediterranean high impact weather: a contribution based on intense cyclones, Nat. Hazards Earth Syst. Sci., 7, 445–454, https://doi.org/10.5194/nhess-7-445-2007, 2007. a, b
Hurrell, J. W.: Decadal trends in the North Atlantic Oscillation: Regional temperatures and precipitation, Science, 269, 676–679, https://doi.org/10.1126/science.269.5224.676, 1995. a
Hurrell, J. W., Holland, M. M., Gent, P. R., Ghan, S., Kay, J. E., Kushner, P. J., Lamarque, J.-F., Large, W. G., Lawrence, D., Lindsay, K., Lipscomb, W. H., Long, M. C., Mahowald, N., Marsh, D. R., Neale, R. B., Rasch, P., Vavrus, S., Vertenstein, M., Bader, D., Collins, W. D., Hack, J. J., Kiehl, J., and Marshall, S.: The community earth system model: a framework for collaborative research, B. Am. Meteorol. Soc., 94, 1339–1360, https://doi.org/10.1175/BAMS-D-12-00121.1, 2013. a
Jong, R. D., Björck, S., Björkman, L., and Clemmensen, L. B.: Storminess variation during the last 6500 years as reconstructed from an ombrotrophic peat bog in Halland, southwest Sweden, J. Quaternary Sci., 21, 905–919, https://doi.org/10.1002/jqs.1011, 2006. a
Kageyama, M., Braconnot, P., Harrison, S. P., Haywood, A. M., Jungclaus, J. H., Otto-Bliesner, B. L., Peterschmitt, J.-Y., Abe-Ouchi, A., Albani, S., Bartlein, P. J., Brierley, C., Crucifix, M., Dolan, A., Fernandez-Donado, L., Fischer, H., Hopcroft, P. O., Ivanovic, R. F., Lambert, F., Lunt, D. J., Mahowald, N. M., Peltier, W. R., Phipps, S. J., Roche, D. M., Schmidt, G. A., Tarasov, L., Valdes, P. J., Zhang, Q., and Zhou, T.: The PMIP4 contribution to CMIP6 – Part 1: Overview and over-arching analysis plan, Geosci. Model Dev., 11, 1033–1057, https://doi.org/10.5194/gmd-11-1033-2018, 2018. a
Kim, W. M., Blender, R., Sigl, M., Messmer, M., and Raible, C. C.: Statistical characteristics of extreme daily precipitation during 1501 BCE–1849 CE in the Community Earth System Model, Clim. Past, 17, 2031–2053, https://doi.org/10.5194/cp-17-2031-2021, 2021. a, b, c
Krug, A., Pothapakula, P. K., Primo, C., and Ahrens, B.: Heavy Vb-cyclone precipitation: a transfer entropy application showcase, Meteorol. Z., 30, 279–284, https://doi.org/10.1127/metz/2021/1071, 2021. a
Lionello, P., Trigo, I. F., Gil, V., Liberato, M. L. R., Nissen, K. M., Pinto, J. G., Raible, C. C., Reale, M., Tanzarella, A., Trigo, R. M., Ulbrich, S., and Ulbrich, U.: Objective climatology of cyclones in the Mediterranean region: a consensus view among methods with different system identification and tracking criteria, Tellus A, 68, 29391, https://doi.org/10.3402/tellusa.v68.29391, 2016. a, b, c
Lionello, P., Conte, D., and Reale, M.: The effect of cyclones crossing the Mediterranean region on sea level anomalies on the Mediterranean Sea coast, Nat. Hazards Earth Syst. Sci., 19, 1541–1564, https://doi.org/10.5194/nhess-19-1541-2019, 2019. a
Mesinger, F. and Strickler, R. F.: Effect of mountains on Genoa cyclogeneses, J. Meteorol. Soc. Jpn. Ser. II, 60, 326–338, https://doi.org/10.2151/jmsj1965.60.1_326, 1982. a
Messmer, M. and Simmonds, I.: Global analysis of cyclone-induced compound precipitation and wind extreme events, Weather and Climate Extremes, 32, 100324, https://doi.org/10.1016/j.wace.2021.100324, 2021. a, b, c
Messmer, M., Gómez-Navarro, J. J., and Raible, C. C.: Climatology of Vb cyclones, physical mechanisms and their impact on extreme precipitation over Central Europe, Earth Syst. Dynam., 6, 541–553, https://doi.org/10.5194/esd-6-541-2015, 2015. a
Montaldo, N. and Sarigu, A.: Potential links between the North Atlantic Oscillation and decreasing precipitation and runoff on a Mediterranean area, J. Hydrol., 553, 419–437, https://doi.org/10.1016/j.jhydrol.2017.08.018, 2017. a
Mudelsee, M., Börngen, M., Tetzlaff, G., and Grünewald, U.: Extreme floods in central Europe over the past 500 years: Role of cyclone pathway “Zugstrasse Vb”, J. Geophys. Res.-Atmos., 109, D23101, https://doi.org/10.1029/2004JD005034, 2004. a
Müller, W. A., Jungclaus, J. H., Mauritsen, T., Baehr, J., Bittner, M., Budich, R., Bunzel, F., Esch, M., Ghosh, R., Haak, H., Ilyina, T., Kleine, T., Kornblueh, L., Li, H., Modali, K., Notz, D., Pohlmann, H., Roeckner, E., Stemmler, I., Tian, F., and Marotzke, J.: A higher-resolution version of the max planck institute earth system model (MPI-ESM1. 2-HR), J. Adv. Model. Earth Sy., 10, 1383–1413, https://doi.org/10.1029/2017MS001217, 2018. a
Nissen, K. M., Leckebusch, G. C., Pinto, J. G., Renggli, D., Ulbrich, S., and Ulbrich, U.: Cyclones causing wind storms in the Mediterranean: characteristics, trends and links to large-scale patterns, Nat. Hazards Earth Syst. Sci., 10, 1379–1391, https://doi.org/10.5194/nhess-10-1379-2010, 2010. a, b
Nissen, K. M., Leckebusch, G. C., Pinto, J. G., and Ulbrich, U.: Mediterranean cyclones and windstorms in a changing climate, Reg. Environ. Change, 14, 1873–1890, https://doi.org/10.1007/s10113-012-0400-8, 2014. a, b
Ortega, P., Lehner, F., Swingedouw, D., Masson-Delmotte, V., Raible, C. C., Casado, M., and Yiou, P.: A model-tested North Atlantic Oscillation reconstruction for the past millennium, Nature, 523, 71–74, https://doi.org/10.1038/nature14518, 2015. a
PAGES 2k-PMIP3 group: Continental-scale temperature variability in PMIP3 simulations and PAGES 2k regional temperature reconstructions over the past millennium, Clim. Past, 11, 1673–1699, https://doi.org/10.5194/cp-11-1673-2015, 2015. a
PAGES Hydro2k Consortium: Comparing proxy and model estimates of hydroclimate variability and change over the Common Era, Clim. Past, 13, 1851–1900, https://doi.org/10.5194/cp-13-1851-2017, 2017. a
Pfahl, S. and Sprenger, M.: On the relationship between extratropical cyclone precipitation and intensity, Geophys. Res. Lett., 43, 1752–1758, https://doi.org/10.1002/2016GL068018, 2016. a
Pfahl, S. and Wernli, H.: Quantifying the relevance of cyclones for precipitation extremes, J. Climate, 25, 6770–6780, https://doi.org/10.1175/JCLI-D-11-00705.1, 2012. a, b
Pinto, J. G. and Raible, C. C.: Past and recent changes in the North Atlantic oscillation, WIRES Clim. Change, 3, 79–90, https://doi.org/10.1002/wcc.150, 2012. a
Portal, A., Raveh-Rubin, S., Catto, J. L., Givon, Y., and Martius, O.: Linking compound weather extremes to Mediterranean cyclones, fronts, and airstreams, Weather Clim. Dynam., 5, 1043–1060, https://doi.org/10.5194/wcd-5-1043-2024, 2024. a, b
Pouzet, P. and Maanan, M.: Temporal approaches of historical extreme storm events based on sedimentological archives, J. Afr. Earth Sci., 162, 103710, https://doi.org/10.1016/j.jafrearsci.2019.103710, 2020. a
Priestley, M. D., Ackerley, D., Catto, J. L., and Hodges, K. I.: Drivers of biases in the CMIP6 extratropical storm tracks. Part I: Northern Hemisphere, J. Climate, 36, 1451–1467, https://doi.org/10.1175/JCLI-D-20-0976.1, 2023. a
Raible, C., Yoshimori, M., Stocker, T., and Casty, C.: Extreme midlatitude cyclones and their implications for precipitation and wind speed extremes in simulations of the Maunder Minimum versus present day conditions, Clim. Dynam., 28, 409–423, https://doi.org/10.1007/s00382-006-0188-7, 2007. a
Raible, C. C., Ziv, B., Saaroni, H., and Wild, M.: Winter synoptic-scale variability over the Mediterranean Basin under future climate conditions as simulated by the ECHAM5, Clim. Dynam., 35, 473–488, https://doi.org/10.1007/s00382-009-0678-5, 2010. a, b, c
Raible, C. C., Messmer, M., Lehner, F., Stocker, T. F., and Blender, R.: Extratropical cyclone statistics during the last millennium and the 21st century, Clim. Past, 14, 1499–1514, https://doi.org/10.5194/cp-14-1499-2018, 2018. a, b, c, d, e, f
Raible, C. C., Pinto, J. G., Ludwig, P., and Messmer, M.: A review of past changes in extratropical cyclones in the northern hemisphere and what can be learned for the future, WIRES Clim. Change, 12, e680, https://doi.org/10.1002/wcc.680, 2021. a, b, c
Raveh-Rubin, S. and Flaounas, E.: A dynamical link between deep Atlantic extratropical cyclones and intense Mediterranean cyclones, Atmos. Sci. Lett., 18, 215–221, https://doi.org/10.1002/asl.745, 2017. a
Raveh-Rubin, S. and Wernli, H.: Large-scale wind and precipitation extremes in the Mediterranean: a climatological analysis for 1979–2012, Q. J. Roy. Meteor. Soc., 141, 2404–2417, https://doi.org/10.1002/qj.2531, 2015. a, b, c
Sabatier, P., Dezileau, L., Colin, C., Briqueu, L., Bouchette, F., Martinez, P., Siani, G., Raynal, O., and Von Grafenstein, U.: 7000 years of paleostorm activity in the NW Mediterranean Sea in response to Holocene climate events, Quaternary Res., 77, 1–11, https://doi.org/10.1016/j.yqres.2011.09.002, 2012. a
Schneidereit, A., Blender, R., and Fraedrich, K.: A radius–depth model for midlatitude cyclones in reanalysis data and simulations, Q. J. Roy. Meteor. Soc., 136, 50–60, https://doi.org/10.1002/qj.523, 2010. a, b
Seager, R., Liu, H., Henderson, N., Simpson, I., Kelley, C., Shaw, T., Kushnir, Y., and Ting, M.: Causes of increasing aridification of the Mediterranean region in response to rising greenhouse gases, J. Climate, 27, 4655–4676, https://doi.org/10.1175/JCLI-D-13-00446.1, 2014. a
Seierstad, I., Stephenson, D., and Kvamstø, N.: How useful are teleconnection patterns for explaining variability in extratropical storminess?, Tellus A, 59, 170–181, https://doi.org/10.1111/j.1600-0870.2007.00226.x, 2007. a, b, c
Sigl, M., Toohey, M., McConnell, J. R., Cole-Dai, J., and Severi, M.: HolVol: Reconstructed volcanic stratospheric sulfur injections and aerosol optical depth for the Holocene (9500 BCE to 1900 CE), PANGAEA [data set], https://doi.org/10.1594/PANGAEA.928646, 2021. a
Stucki, P., Froidevaux, P., Zamuriano, M., Isotta, F. A., Messmer, M., and Martynov, A.: Simulations of the 2005, 1910, and 1876 Vb cyclones over the Alps – sensitivity to model physics and cyclonic moisture flux, Nat. Hazards Earth Syst. Sci., 20, 35–57, https://doi.org/10.5194/nhess-20-35-2020, 2020. a
Trigo, I. F.: Climatology and interannual variability of storm-tracks in the Euro-Atlantic sector: a comparison between ERA-40 and NCEP/NCAR reanalyses, Clim. Dynam., 26, 127–143, https://doi.org/10.1007/s00382-005-0065-9, 2006. a
Trigo, I. F., Davies, T. D., and Bigg, G. R.: Decline in Mediterranean rainfall caused by weakening of Mediterranean cyclones, Geophys. Res. Lett., 27, 2913–2916, https://doi.org/10.1029/2000GL011526, 2000. a
Trigo, I. F., Bigg, G. R., and Davies, T. D.: Climatology of cyclogenesis mechanisms in the Mediterranean, Mon. Weather Rev., 130, 549–569, https://doi.org/10.1175/1520-0493(2002)130<0549:COCMIT>2.0.CO;2, 2002. a, b
Vakrat, E. and Hochman, A.: Dynamical systems insights on cyclonic compound “wet” and “windy” extremes in the Eastern Mediterranean, Q. J. Roy. Meteor. Soc., 149, 3593–3606, https://doi.org/10.1002/qj.4575, 2023. a
van Bebber, W. J.: Die Zugstrassen der barometrischen Minima, Meteorol. Z., 8, 361–366, https://doi.org/10.1515/9783112683064-007, 1891. a
Varma, V., Prange, M., Merkel, U., Kleinen, T., Lohmann, G., Pfeiffer, M., Renssen, H., Wagner, A., Wagner, S., and Schulz, M.: Holocene evolution of the Southern Hemisphere westerly winds in transient simulations with global climate models, Clim. Past, 8, 391–402, https://doi.org/10.5194/cp-8-391-2012, 2012. a
Walz, M. A., Befort, D. J., Kirchner-Bossi, N. O., Ulbrich, U., and Leckebusch, G. C.: Modelling serial clustering and inter-annual variability of European winter windstorms based on large-scale drivers, Int. J. Climatol., 38, 3044–3057, https://doi.org/10.1002/joc.5481, 2018. a, b, c
Xia, L., von Storch, H., Feser, F., and Wu, J.: A study of quasi-millennial extratropical winter cyclone activity over the Southern Hemisphere, Clim. Dynam., 47, 2121–2138, https://doi.org/10.1007/s00382-015-2954-x, 2016. a
Xoplaki, E., González-Rouco, J. F., Luterbacher, J., and Wanner, H.: Mediterranean summer air temperature variability and its connection to the large-scale atmospheric circulation and SSTs, Clim. Dynam., 20, 723–739, https://doi.org/10.1007/s00382-003-0304-x, 2003. a
Zappa, G., Shaffrey, L. C., and Hodges, K. I.: The ability of CMIP5 models to simulate North Atlantic extratropical cyclones, J. Climate, 26, 5379–5396, https://doi.org/10.1175/JCLI-D-12-00501.1, 2013. a
Zappa, G., Masato, G., Shaffrey, L., Woollings, T., and Hodges, K.: Linking Northern Hemisphere blocking and storm track biases in the CMIP5 climate models, Geophys. Res. Lett., 41, 135–139, https://doi.org/10.1002/2013GL058480, 2014. a
Zscheischler, J., Westra, S., van den Hurk, B. J. J. M., Seneviratne, S. I., Ward, P. J., Pitman, A., AghaKouchak, A., Bresch, D. N., Leonard, M., Wahl, T., and Zhang, X.: Future climate risk from compound events, Nat. Clim. Change, 8, 469–477, https://doi.org/10.1038/s41558-018-0156-3, 2018. a