the Creative Commons Attribution 4.0 License.
the Creative Commons Attribution 4.0 License.
 | 17 Jul 2025
Precession-driven low-latitude hydrological cycle paced by shifting perihelion
Hu Yang
Xiaoxu Shi
Xulong Wang
Qingsong Liu
Yi Zhong
Xiaodong Liu
Youbin Sun
Yanjun Cai
Fei Liu
Gerrit Lohmann
Martin Werner
Zhimin Jian
Tainã M. L. Pinho
Hai Cheng
Lijuan Lu
Jiping Liu
Chao-Yuan Yang
Qinghua Yang
Yongyun Hu
Xing Cheng
Jingyu Zhang
Dake Chen
Palaeoclimate proxies reveal a significant precessional impact on the low-latitude hydrological cycle. Classical theory suggests that precession modulates the inter-hemisphere summer insolation difference and hence controls the meridional displacement of the Intertropical Convergence Zone (ITCZ). Accordingly, low-latitude precipitation variations are expected to be in phase (for the Northern Hemisphere) or anti-phase (for the Southern Hemisphere) with the Northern Hemisphere summer insolation. However, increasing numbers of proxies, particularly those that are absolutely dated, reveal that variations in terrestrial precipitation at different low latitudes follow distinct precession rhythms that are very often out of phase with hemispheric summer insolation. The mechanism underlying such spatial–temporal complexity remains elusive. In this study, we performed theoretical analysis, climate simulations, and synthesis of geological records to hypothesise that the low-latitude hydrological cycle is paced by shifting perihelion rather than by the hemispheric summer insolation. More specifically, precession of the Earth’s rotation axis shifts the season and latitude of perihelion. Here, the latitude of perihelion is introduced as the latitude of Earth's subsolar point during perihelion, which is the location where the most intense solar radiation is concentrated. At the time of perihelion, intense solar radiation heats the land faster than the ocean due to differing thermal inertia. This thermodynamically moves the tropical convection from the ocean to the land, contributing to enhancing the terrestrial precipitation around the perihelion latitude. As the precessional phase changes, perihelion moves toward different latitudes, causing asynchronous maximums in terrestrial precipitation at different latitudes. Perihelion can occur in any season; therefore, the insolation in individual seasons is equally important in shaping the orbital-scale climate changes at low latitudes. This offers new insight into the Milankovitch theory, which highlights summer insolation's role in shaping orbital-scale climate change.
- Article
(6566 KB) - Full-text XML
-
Supplement
(1685 KB) - BibTeX
- EndNote


By redistributing solar radiation across different latitudes and seasons, Earth's orbital changes exerted a significant impact on past climate change (Milankovitch, 1941; Berger, 1978, 1988). In high-latitude regions, these orbital-scale climate changes are characterised by cyclic expansion and retreat of ice sheets, with periodicities of ∼ 41 or ∼ 100 kiloyears (ka) (Lisiecki and Raymo, 2005), modulated by the Milankovitch cycles of obliquity and eccentricity (Milankovitch, 1941). In contrast, low-latitude climate changes are marked by periodic variations in hydrological cycle with dominant periods of ∼ 23 ka, aligning with the Milankovitch cycles of precession (Clement et al., 2004; Cruz Jr. et al., 2005; Braconnot et al., 2008; Carolin et al., 2013; Cheng et al., 2016; Wang et al., 2014a; Huang et al., 2020; Cheng et al., 2022). These precessional fluctuations are widely documented in the precipitation-related proxies from Africa (Kutzbach, 1981; Kuper and Kropelin, 2006; Hély et al., 2014; El-Shenawy et al., 2018), Asia (An et al., 2000; Wang et al., 2007, 2008; Carolin et al., 2013, 2016; Li et al., 2024), Australia (Beaufort et al., 2010), and South America (Baker et al., 2001; Wang et al., 2004; Cruz Jr. et al., 2005). Among these changes, the periodic greening of the Sahara stands out as one of the most fascinating phenomena (DeMenocal and Tierney, 2012; Skonieczny et al., 2019; Armstrong et al., 2023).
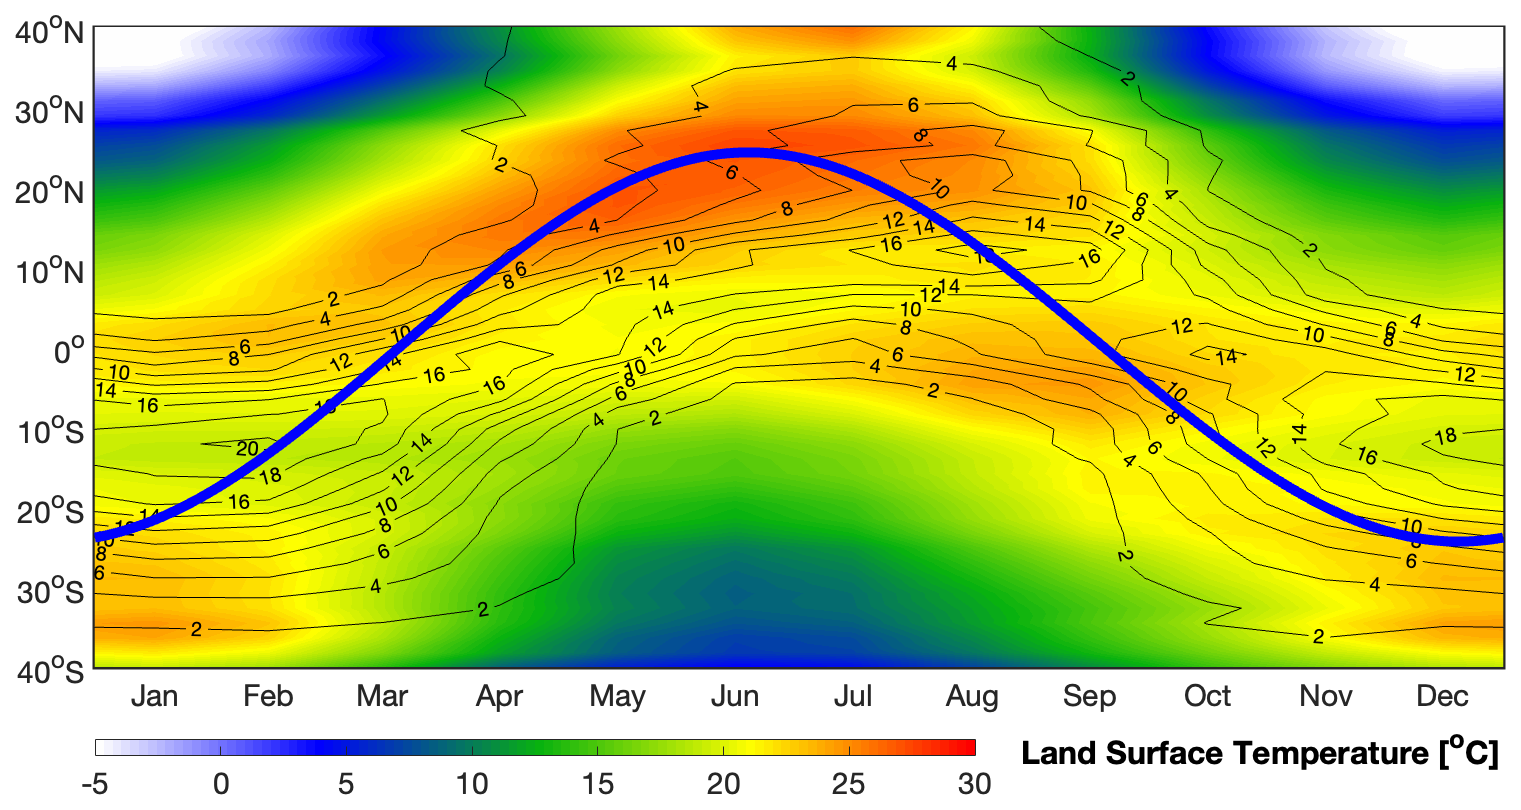
Figure 1Seasonal migration of the Earth's subsolar point (thick blue line), thermal Equator over land (shading), and precipitation over land (black contours). Shading represents zonal mean land surface temperature. Contours show the zonal mean precipitation on land (unit: mm d−1). The seasonal movement of the Earth's subsolar point fundamentally determines the position of the Earth's thermal Equator, where deep convection and low-latitude precipitation take place. Due to the thermal inertia of Earth, the thermal Equator and land precipitation do not precisely coincide with the timing of maximal solar radiation, i.e. the Earth's subsolar point, but rather experience a delay of approximately 1–2 months. Results are based on the ensemble mean of the 24 simulations with different precessional phases (see Methodology).
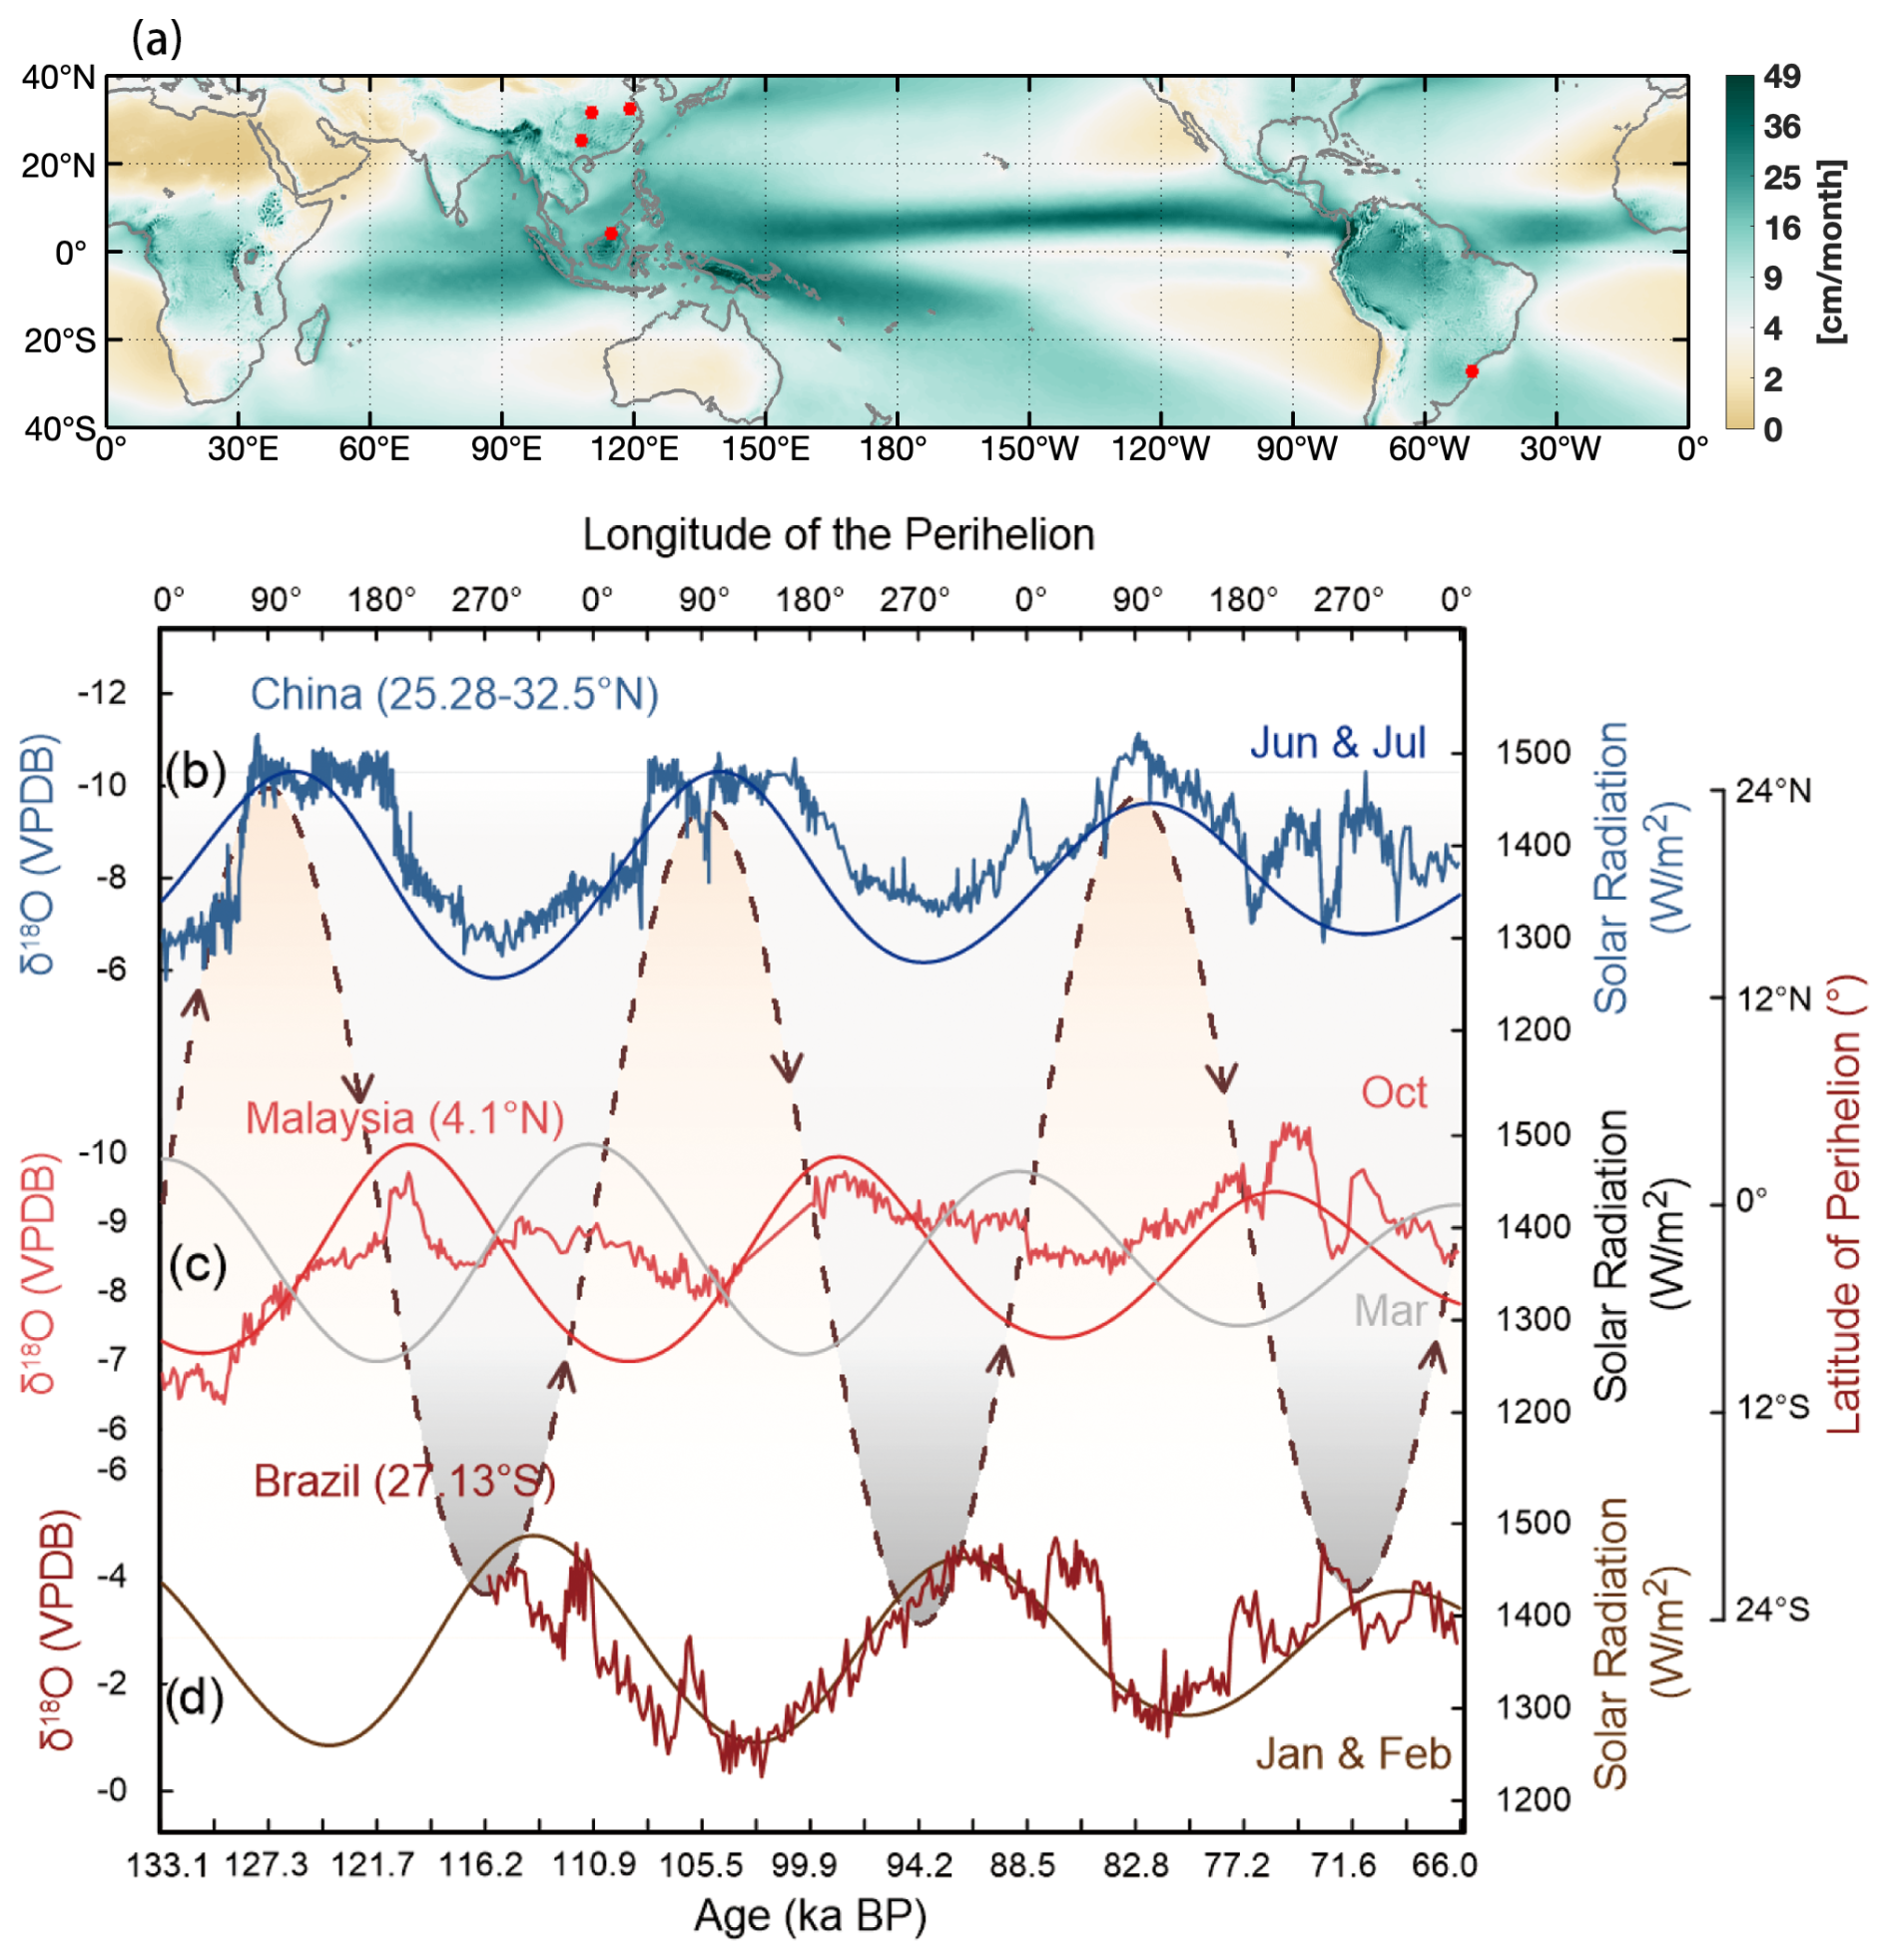
Figure 2(a) Climatology map of annual mean precipitation over low latitudes. Stalagmite oxygen isotope evolution in (b) China (Cheng et al., 2016), (c) Malaysia (4.1° N, 114.9° E) (Carolin et al., 2013, 2016), and (d) Brazil (22° S, 16° W) (Cruz Jr. et al., 2005). The locations of these records are shown in Fig. 2a. The intensity of solar radiation in the rainy seasons is plotted as well: for China, it is the averaged solar radiation in June and July; for Malaysia, it is the solar radiation in October and March; for Brazil, it is the mean solar radiation in January and February. The dashed line illustrates the meridional migration of perihelion latitude (see detailed definition in Sect. 3). To better illustrate the terrestrial precipitation optimums at different precessional phases, we translate the age into precessional phase, which is shown in the upper axis. When the perihelion occurs in a certain season and overheads at a certain latitude, the seasonal solar radiation and terrestrial precipitation reach their maxima.
Low-latitude precipitation primarily comes from the seasonal north–south migration of the Intertropical Convergence Zone (ITCZ), which follows the march of the Earth's thermal Equator (Fig. 1) (Gadgil, 2018). Early studies proposed that precession regulates the inter-hemispheric summer insolation difference and modulates the meridional migration of the ITCZ (Kutzbach, 1981; Wang et al., 2014a; Schneider et al., 2014). Increased Northern Hemisphere summer insolation (perihelion) corresponds to decreased Southern Hemisphere summer insolation (aphelion). Accordingly, variations in ITCZ precipitation are expected to align with changes in summer insolation, exhibiting an anti-phase relationship between the Northern Hemisphere and the Southern Hemisphere (Wang et al., 2004, 2006, 2014a, 2017; Cruz Jr. et al., 2005; Cheng et al., 2012, 2013) (Fig. 2b and d). However, in the past 2 decades, an increasing number of proxies have shown that, although low-latitude terrestrial precipitation displays significant precessional variations, their evolution patterns are not necessarily in phase with the Northern/Southern Hemisphere summer insolation (An et al., 2000; Wang et al., 2004; Clemens and Prell, 2007; Carolin et al., 2013, 2016; Zhou et al., 2022). For example, the reconstructed optimums of the East Asian summer monsoon at different geographical locations were asynchronous with each other, suggesting that the precipitation optimums do not all occur at the same time (An et al., 2000; Cai et al., 2010; Ran and Feng, 2013; Chen et al., 2015; Liu et al., 2015; Zhou et al., 2022). The Indian summer monsoon, reconstructed from sediment cores of the Arabian Sea, shows an early Holocene optimum (Thamban et al., 2007) significantly preceding that of the East Asian summer monsoon (Sun et al., 2006; Liu et al., 2015). Over Africa, archaeological and geological evidence indicates that the recent termination of the Sahara greening shows a time-transgressive pattern and occurred earlier in northern Africa than in the south (Kuper and Kropelin, 2006; Shanahan et al., 2015). Speleothem records and travertine deposits collected around northeastern Brazil (10° S) suggest that the local wet periods presented themselves during the high-insolation periods of austral autumn rather than austral summer (Wang et al., 2004). Near the Equator, a Malaysian speleothem δ18O record, reflecting local precipitation strength, exhibits an evolutionary pattern comparable to neither the Northern Hemisphere summer insolation nor the Southern Hemisphere summer insolation but to insolation in October (Carolin et al., 2013) (Fig. 2c).
The cause of the asynchronous relationship between terrestrial precipitation and summer insolation has been investigated extensively form both modelling and proxy–model comparison perspectives (Short and Mengel, 1986; Braconnot and Marti, 2003; Zhao et al., 2005; Kuper and Kropelin, 2006; Clemens and Prell, 2007; Shanahan et al., 2015; Ran and Feng, 2013; Chen et al., 2015; Cheng et al., 2021; Zhou et al., 2022). These studies propose that the control of summer insolation on the hydrological cycle could be disrupted by a variety of factors, including fluctuation of CO2 (Lu et al., 2013; McGrath et al., 2021), internal ocean–atmosphere feedback (Clemens and Prell, 2007; Carolin et al., 2013, 2016), the presence of ice sheets (Chiang and Bitz, 2005; Chen et al., 2015; Wu et al., 2023b), delayed ocean warming (Ran and Feng, 2013), sea level fluctuations (Griffiths et al., 2009; Windler et al., 2021), and millennial-scale abrupt climate changes originating from high latitudes (Wang et al., 2008; Chiang and Friedman, 2012). In addition to these possibilities, recent studies have shown that the sensitivity of different proxies to precipitation may lead to artificial “asynchronous” timing of the reconstructed precipitation optimum (Cheng et al., 2021; Zheng et al., 2023; Wen et al., 2024).
Despite these facts, transient and time-slice simulations solely forced by orbital forcing yield asynchronous precipitation variations against summer insolation (Braconnot and Marti, 2003; Kutzbach et al., 2008; Erb et al., 2015; Bischoff et al., 2017; Liu et al., 2022). This raises the question of whether (or not) terrestrial precipitation follows changes in hemispheric summer insolation. By performing simulations with different precessional phases, Braconnot and Marti (2003) found that the calendar timing of maximum insolation (perihelion) affects the seasonality of the Indian monsoon. They proposed that insolation in other seasons may also important, especially in determining the seasonal timing of the Indian summer monsoon. Focusing on the East Asian monsoon, Zhou et al. (2022) suggested that insolation in different months may contribute to a time-transgressive pattern of East Asian monsoon optimums, with earlier occurrence in southern China and later occurrence in northern China. By running an isotope-enabled transient simulation covering the past 300 ka, Liu et al. (2022) found that the precipitation δ18O in Asia is primarily affected by the temperature and insolation during the rainy seasons rather than by the averaged boreal summer insolation.
In this study, we present theoretical analysis, climate model simulations, and synthesis of geologic records from different latitudes to hypothesise that the precession-driven low-latitude hydrological cycle is regulated by shifting perihelion across different seasons and latitudes. Consequently, the precipitation optimums at different latitudes occur in a naturally asynchronous manner.
2.1 Model simulations
Using the Alfred Wegener Institute Earth System Model (AWI-ESM; Sidorenko et al., 2015, 2019), we conduct two sets of experiments to study the dynamics of a precession-driven, low-latitude hydrological cycle. The AWI-ESM is a coupled ocean–atmosphere model, consisting of the atmospheric component ECHAM6 (Giorgetta et al., 2013) and the oceanic component FESOM (Wang et al., 2014b; Danilov et al., 2017). The oceanic component employs an unstructured mesh, with relatively high resolution (up to 25 km) in polar regions, in coastal areas, and at the Equator, while the atmospheric component has a spatial resolution of 1.875°. In our experiments, we implement a dynamic vegetation, which dynamically alters the vegetation coverage and the surface albedo in response to climate changes. More detailed information on the model setup can also be found in Shi and Lohmann (2016).
2.1.1 Idealised Earth system without tilted Earth rotation axis
In the first experiment, we create an idealised Earth system without seasonal migration of Earth's subsolar point (obliquity =0) while introducing a relatively elliptical orbit of the Earth (eccentricity =0.058). In this experiment, perihelion takes place in June and aphelion takes place in December. We run the simulation for 1000 years, with the results of the last 100 years used for analysis. This experiment is designed to examine how changing the Earth–Sun distance, or perihelion, affects tropical precipitation over land.
2.1.2 Simulations reconstructing a precessional cycle
In the second experiment, we perform a set of simulations to reconstruct the climate change within a precessional cycle. In these simulations, the obliquity is set to be 24.5°. We ran 24 sensitivity simulations using different precessional phases, i.e. 0°, 15°, 30°, … 345°. To allow the low-latitude climate to reach a quasi-equilibrium state to insolation forcing, we integrated the model for 300 years, and the mean climate of the last 100 years was used to represent the climate at the corresponding precession phase.
All 24 of these simulations are initialised from a pre-industrial simulation which was part of PMIP4 (Kageyama et al., 2018). For all simulations, the greenhouse gas concentrations in the atmosphere, the land–sea distribution, and the ice sheet configuration are fixed as the pre-industrial conditions.
Natural climate variability is ubiquitous and can sometimes conceal external forcing. To highlight the external precessional forcing in climate change, in all simulations, the eccentricity is set to a relatively high value (0.058), which represents the highest eccentricity during the Quaternary (Berger, 1978). Consequently, this configuration exposes the Earth to 26 % more solar radiation during perihelion than during aphelion. Additionally, we examine the climatology mean model results from the last 100 years. This further eliminates the climate noise from natural variability.
The definition of seasonality, which is influenced by slow variations in the Earth's orbit, plays a key role in determining the calculated seasonal cycle of the climate. Application of the Gregorian calendar where the lengths of the months and seasons are fixed results in a drift in the occurrence date of different seasons. In particular, the applied high eccentricity (0.058) leads to a shift in the date of the autumn equinox by up to 27 d within our simulations. This may lead artificial biases when comparing monthly temperature and precipitation across different simulations with different precessional phases (Kutzbach and Gallimore, 1988; Joussaume and Braconnot, 1997). In contrast to the “fix-day” Gregorian calendar widely used today, the angular calendar calculates the lengths of the months and seasons according to a fixed angle along the Earth’s orbit. When comparing simulation results for different orbital configurations, it is essential to use the angular calendar to ensure that the data for comparison are from the same position along the Earth's orbit (Joussaume and Braconnot, 1997; Pollard and Reusch, 2002). To address this, we applied a calendar correction on our model results (temperature, precipitation, insolation) by changing the monthly mean data from the Gregorian calendar to an angular calendar. Detailed methodology can be found in Shi et al. (2022).
2.2 Speleothem proxies
With precise chronologies and widespread distribution, speleothem records are widely used to reconstruct the past hydrological cycle (Kaushal et al., 2024). To verify our hypothesis, we synthesise the speleothem δ18O records from China, Malaysia, and Brazil. The record from China was composited by Cheng et al. (2016) based on several samples from the Sanbao (31°40′ N, 110°26′ E), Hulu (32°30′ N, 119°10′ E), and Dongge (25°17′ N, 108°5′ E) caves (Wang et al., 2001, 2008; Dykoski et al., 2005; Kelly et al., 2006; Cheng et al., 2009). The Malaysia records were collected in different caves in Gunung Mulu National Park, Borneo, Malaysia (4° N, 115° E) (Carolin et al., 2013, 2016). The Brazil record was collected from the Botuvera Cave (27°13′24′′ S, 49°09′20′′ W) (Cruz Jr. et al., 2005). These δ18O records are believed to represent the changes in local precipitation amounts, as indicated by the original publications (Cruz Jr. et al., 2005; Carolin et al., 2013; Cheng et al., 2016).
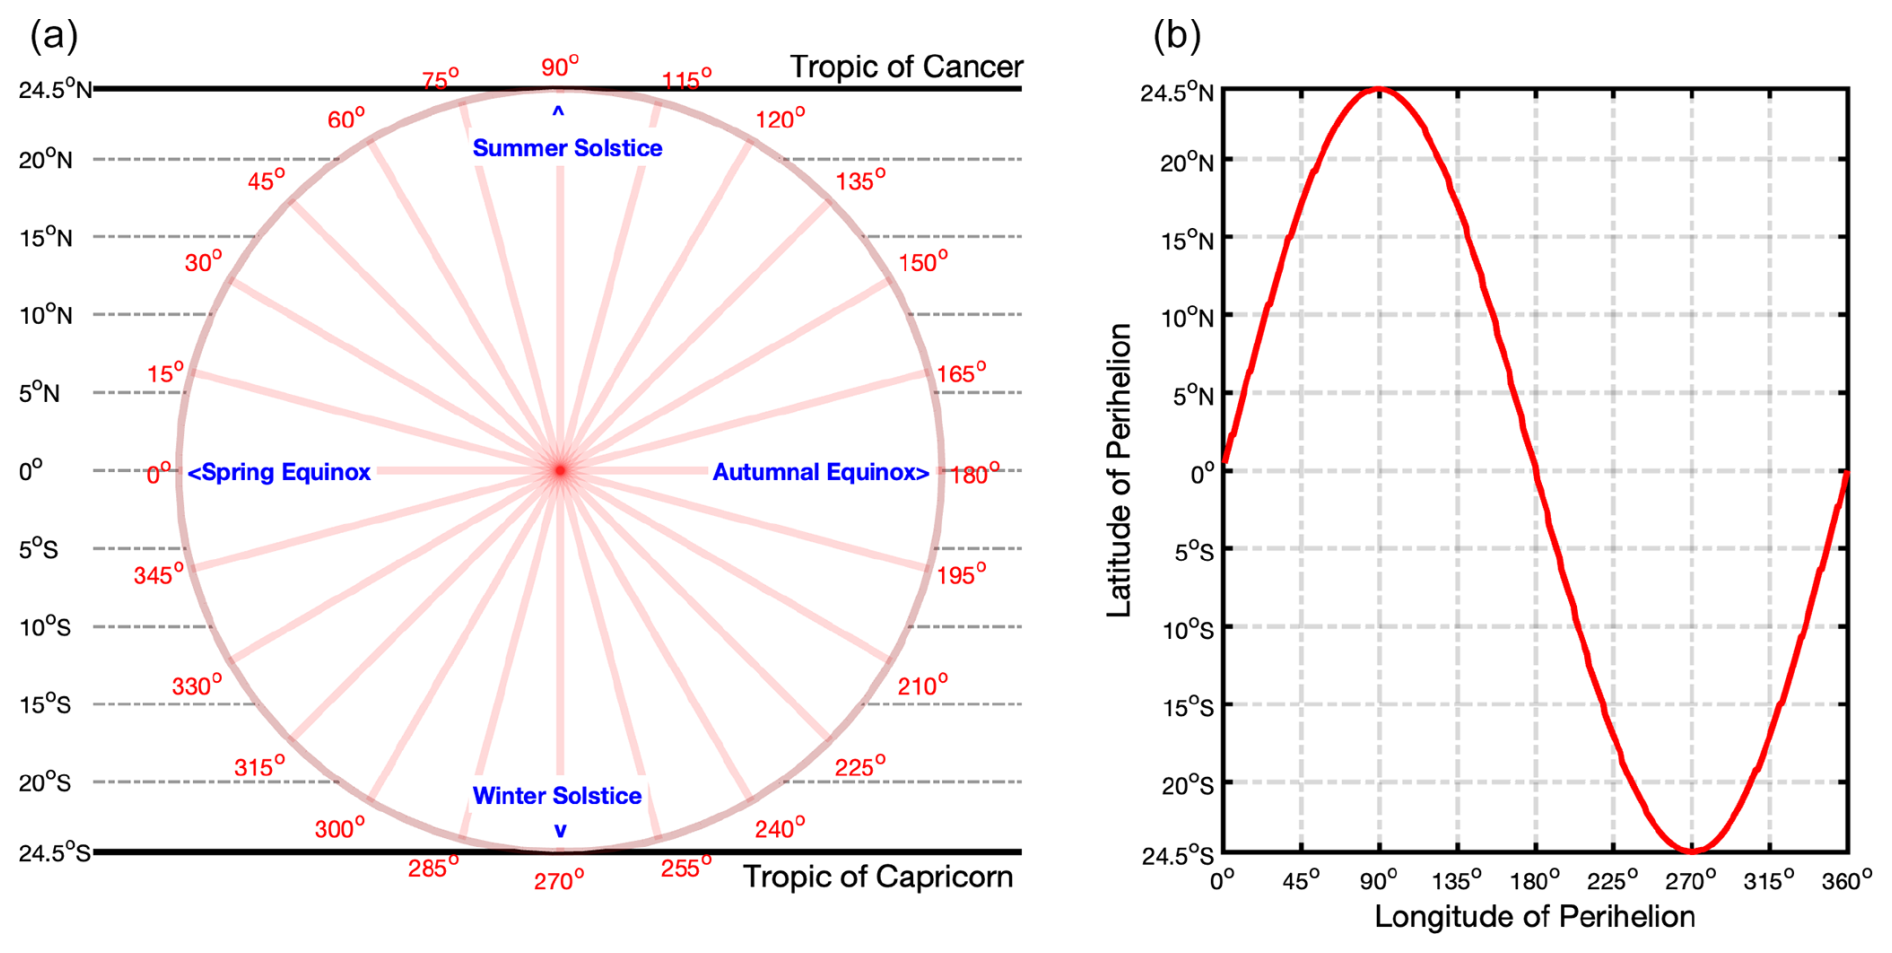
Figure 3The latitudinal movement of the perihelion and Earth's subsolar point within a precessional cycle and an annual cycle, respectively. The labels outside the circle give the precessional phase, namely the longitude of the perihelion. The labels inside the circle locate the position of season. Within 1 year, the Earth's subsolar point marches between the Tropic of Cancer and the Tropic of Capricorn. Within a precessional cycle, the latitude of perihelion also migrates between the Tropic of Cancer and the Tropic of Capricorn. The dashed grey lines give the latitudinal coordinates. At the time of perihelion, the incoming solar radiation at the perihelion latitude reaches the maximum within a precessional cycle. To better understand this figure, see Supplement Movie S1 (https://doi.org/10.5281/zenodo.11395459; Yang, 2024a), which visually conveys an explanatory description of the seasonal solar radiation variations within a precessional cycle.
2.3 Method
2.3.1 Calculation of solar radiation pattern
To understand how the solar radiation fluctuates throughout a precessional cycle, we compute seasonal solar radiation patterns using MATLAB with aids from two tools, namely “Orbital, the Box” (Lougheed, 2021) and the Earth Orbit Model v2.1 (Kostadinov and Gilb, 2014). These tools were developed based on the theoretical framework presented in Berger (1978), Laskar (1990), and Laskar et al. (1993).
2.3.2 Tracking the thermal Equator
The ITCZ precipitation takes place over the Earth's warmest region, i.e. the thermal Equator. To understand the movement of tropical precipitation, we track the thermal Equator based on moist static energy (analogous to equivalent potential temperature) using the following equation:
where S is the moist static energy, Cp is the specific heat at constant pressure, T is the absolute air temperature, g is the gravitational constant, z is the geopotential height above sea level, Lv is the latent heat of vaporisation, and q is the water vapour specific humidity (Neelin and Held, 1987; Wallace and Hobbs, 2006). The region with the highest moist static energy is the thermal Equator, where deep convection occurs (Barry and Chorley, 2009).
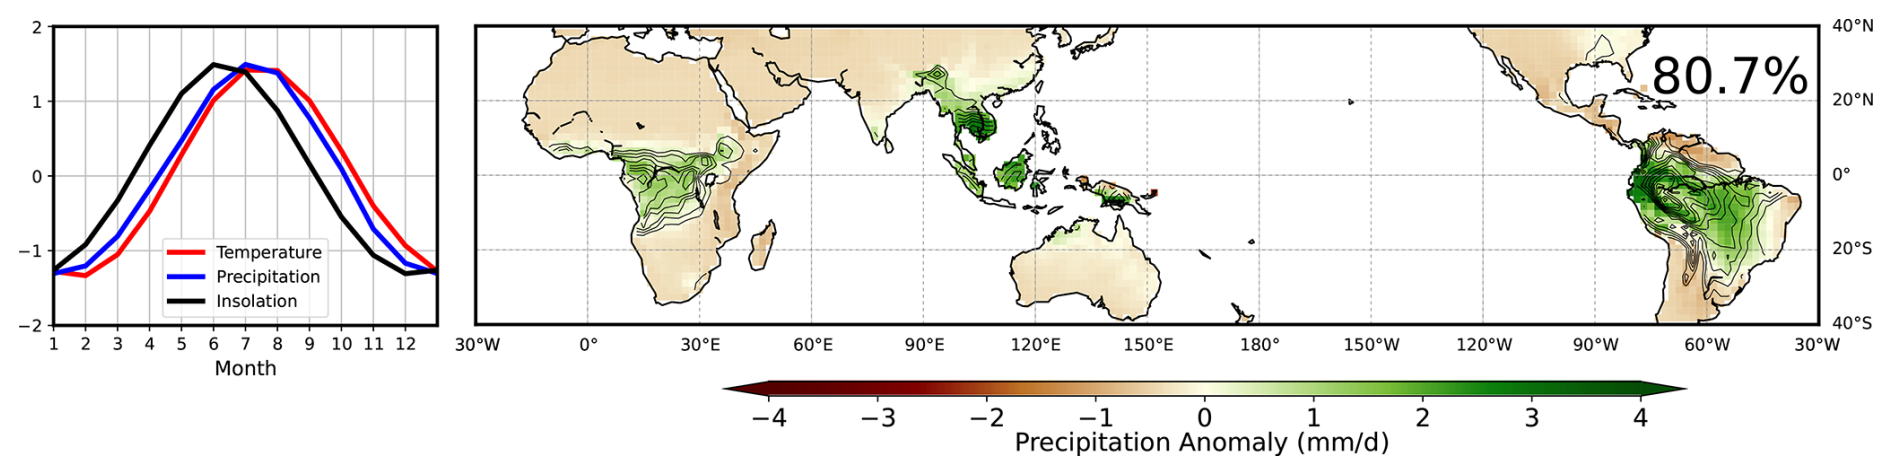
Figure 4Temporal and spatial evolutions of terrestrial precipitation in the idealised Earth system experiment, with zero obliquity and high eccentricity (0.058). The shading in the right panel illustrates the spatial pattern of the leading mode (contains 80.7 % of terrestrial precipitation co-variance) of empirical orthogonal function (EOF) analysis on the monthly convective precipitation over land. The contours illustrate the climatology precipitation. The blue line in the left panel shows the corresponding principal component, illustrating the temporal evolution of the terrestrial precipitation strength. The evolution of the area-weighted land surface temperature (red line) and incoming solar radiation (black line) is plotted as well. In this experiment, perihelion occurs in June, corresponding to maximum incoming solar radiation in June and maximum precipitation over land 1–2 months later (July and August).
2.3.3 Empirical orthogonal function analysis
The empirical orthogonal function (EOF) analysis (Hannachi et al., 2007) is used to identify the spatial and temporal characteristics of terrestrial precipitation at low latitudes. EOF analysis is widely applied in Earth science. It is generally used to simplify a spatial–temporal data set by converting it into spatial patterns of variability and temporal evolution of these patterns. For the idealised Earth system experiment without tilted Earth rotation axis, we applied EOF analysis on the climatology monthly convective precipitation over land between 40° S–40° N (Fig. 4). For the 24 simulations recovering a precessional cycle, we applied EOF analysis on the individual monthly convective precipitation over land. For example, December precipitation in the 24 simulations is selected and applied to an EOF analysis to generate Fig. 5a. Area weighting is not applied in the calculation.
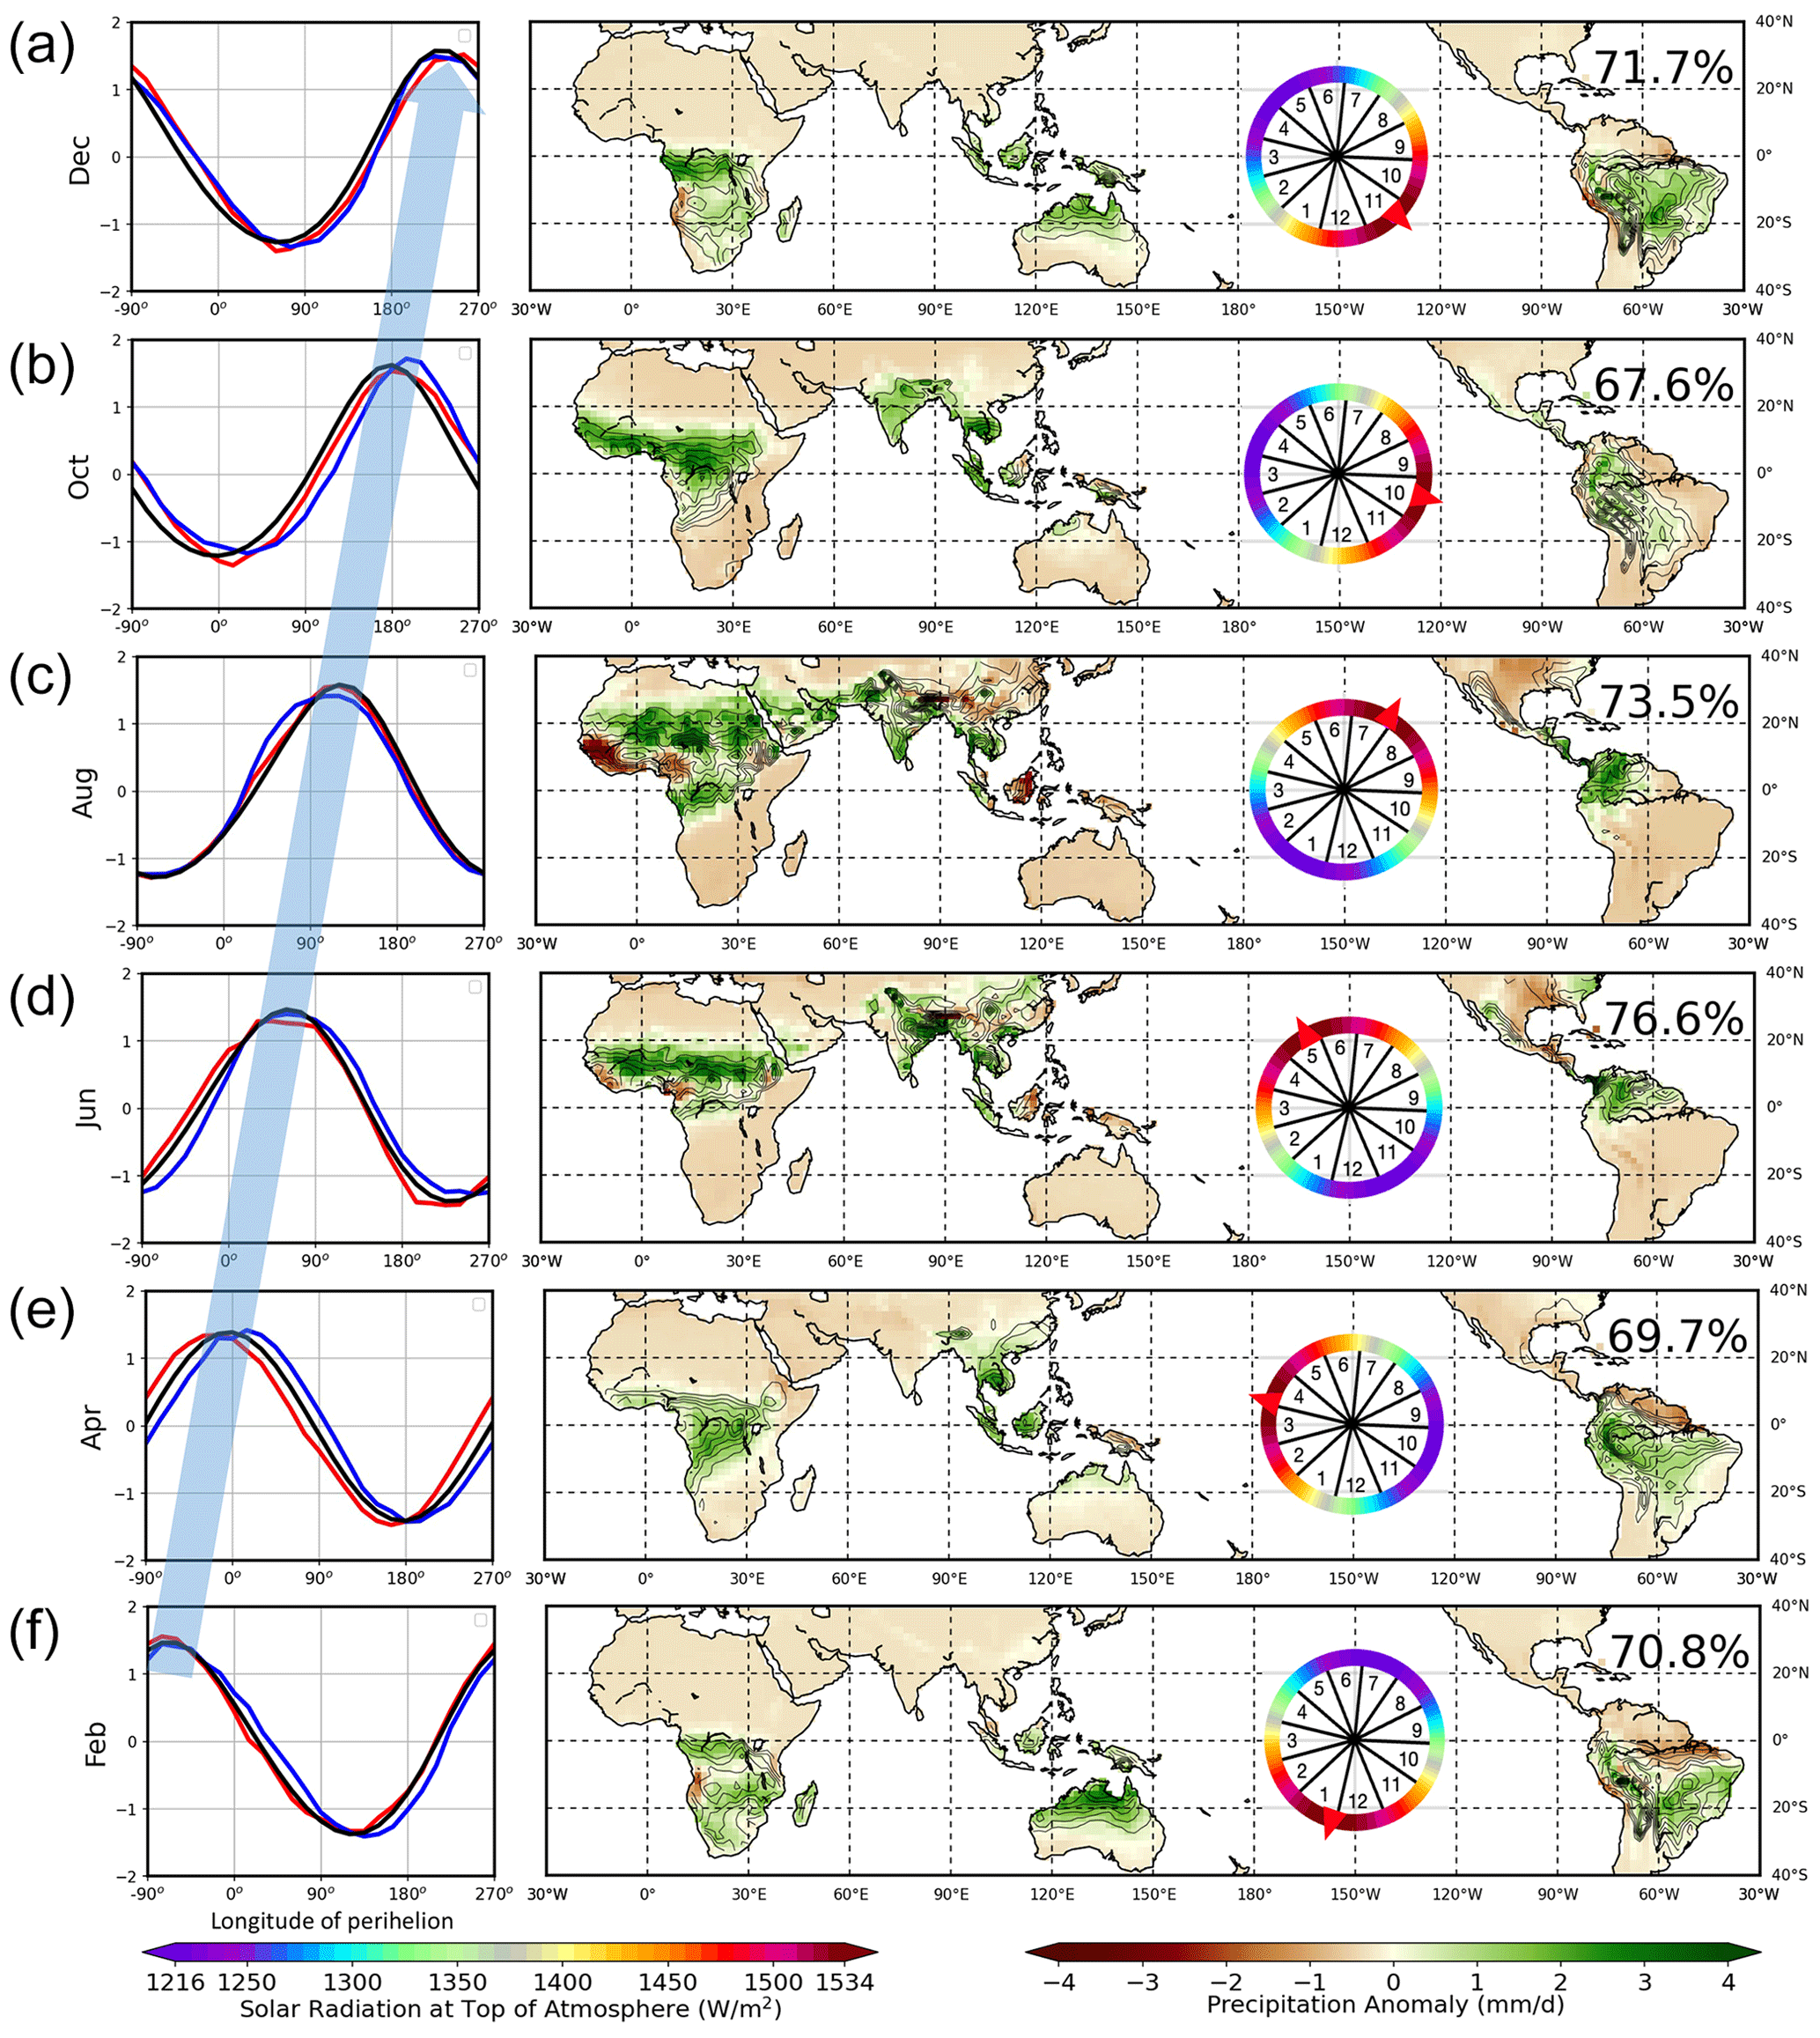
Figure 5Temporal and spatial evolutions of terrestrial precipitation in different seasons. The shading in the right panel illustrates the spatial pattern of the leading mode of empirical orthogonal function (EOF) analysis on the monthly terrestrial precipitation simulated by AWI-ESM recovering a precessional cycle. The number in the upper-right corner of each subpanel displays the contribution of the first principal component of EOF to the overall variance. The contours illustrate the climatological precipitation in the corresponding month. The blue lines in the left panels show the corresponding principal component of EOF analysis, illustrating the temporal evolution of the terrestrial precipitation strength. The evolution of the area-weighted land surface temperature (between 40° S–40° N; red line) and global mean incoming solar radiation (black line) is plotted as well. Note that the plotted solar radiation is from 1 month before. For example, for the panel of February/August, the solar radiation in January/July is plotted. For easy comparison, all time series are normalised. The coloured circles illustrate the solar radiation distribution during the precessional phase when the corresponding seasonal terrestrial precipitation peaks. The numbers in this circle give the location of the individual month. The red arrows point to the timing and meridional position of perihelion. The blue arrow in the left panels illustrates the asynchronous precipitation optimums across different latitudes and seasons.
To understand the mechanism of how precession governs the low-latitude hydrological cycle, we first look at how precession affects the solar radiation received by the Earth.
The Earth's orbit around the Sun is not a perfect circle but an ellipse. When the Earth's distance from the Sun is at its shortest, i.e. perihelion, it receives the strongest solar radiation. Currently, perihelion happens in boreal winter, when the Earth’s subsolar point closes to the Tropic of Capricorn (Fig. S2d). By changing the orientation of the Earth's rotation axis, precession gradually delays the calendar timing of perihelion by around 25.1 min yr−1. This is equivalent to the Earth's subsolar point at perihelion migrating by about 500 m yr−1. At about 11 ka, perihelion occurred in boreal summer, when the Earth’s subsolar point was closest to the Tropic of Cancer (Fig. S2b). Therefore, precession not only shifts the calendar timing of perihelion but also the “latitude of perihelion”. Here, we introduce the latitude of perihelion, which is the latitude of Earth's subsolar point during perihelion (Fig. S2). This latitudinal zone represents the region with the most intense incoming solar radiation. Logically, it also corresponds to the strongest thermal Equator if the solar heating effect is instantaneous.
To detail when and where perihelion occurs, Fig. 3 shows the calendar timing and latitude of perihelion at different precessional phases (longitude of perihelion). Similarly to the movement of the Earth's subsolar point over the course of 1 year, the latitude of perihelion migrates between the tropics of Cancer and Capricorn over the course of a precessional cycle. Movie S1 further clarifies this. Whenever (the season) and wherever (the latitude) perihelion occurs, the solar radiation in the corresponding season and perihelion latitude reaches its maximum in a precessional cycle.
To investigate how perihelion impacts low-latitude climate change, we conducted an idealised Earth system experiment using AWI-ESM. In this idealised Earth system, the Earth's rotation axis is not tilted (zero obliquity). The Earth's orbit is set to be relatively elliptical (see Sect. 2.1.1). As a result, the thermal Equator and the associated tropical rain belt are constrained in the vicinity of the geographic Equator. However, due to variations in the distance between the Earth and the Sun, temperature and precipitation exhibit a seasonality (Fig. 4).
At perihelion, the incoming solar radiation maximises. Due to the different thermal inertia between the land and the ocean, the atmospheric heating over land is stronger than that over the ocean. This leads to a faster increase in moist static energy over land than over the ocean (Fig. S3). As tropical deep convection tends to occur towards the warmest regions with the highest moist static energy (Neelin and Held, 1987; Battisti et al., 2014; Schneider et al., 2014; Geen et al., 2020), we observed maximum convective precipitation over land 1–2 months after the perihelion (Fig. 4). In brief, perihelion promotes tropical precipitation over land. With this understanding, we switch to a more complex Earth system with a tilted rotation axis and shifting perihelion.
The above experiment depicts a very idealised Earth. To simulate the climate in a more realistic world, we conducted another set of numerical experiments using AWI-ESM. This time, the Earth's rotation axis is tilted (obliquity =24.5°). Therefore, the Earth's subsolar point marches between the tropics of Cancer and Capricorn, driving a seasonal migration of ITCZ and terrestrial precipitation (Fig. 1). We manipulated the precessional phase to reconstruct the climate changes over the course of a precessional cycle (see Sect. 2.1.2). Specifically, 24 time-slice simulations were performed with the precessional phase (namely the longitude of the perihelion) varying from 0 to 345° with an interval of 15° (Fig. 3). Due to different precessional phases, when (the calendar timing) and where (the latitude) the perihelion takes place varies among these experiments (Fig. 3).
Because low-latitude land precipitation is concentrated at different latitudes in different months (Fig. 1), we investigate how precipitation evolves in each month over a precession cycle. EOF analysis was applied to explore the spatial and temporal characteristics of terrestrial precipitation oscillation. This allows us to identify where (the geographical location) and when (the precessional phase) the terrestrial precipitation peaks.
In February, the ITCZ and predominant terrestrial precipitation locate at its southernmost latitudes (Figs. 1 and 5f, contours). EOF analysis on the February precipitation reveals that the strongest terrestrial precipitation is around the precessional phase of −75° (Fig. 5f, blue line). This corresponds to the perihelion occurring 1.5 months earlier (in early January, as shown in Fig. 5f with a coloured circle) at its southernmost latitudes.
The ITCZ and associated rain belt locate around the Equator in April (Figs. 1 and 5e, contours). We found the strongest April precipitation around the precessional phase of 15° (Fig. 5e, blue line) when perihelion occurs in March, with the latitude of perihelion being around the Equator (Fig. 5e, coloured circle).
Following the seasonal migration of Earth's subsolar point, the rain belt moves northward and reaches its northernmost position in August (Figs. 1 and 5c, contours). Within a precession cycle, August terrestrial precipitation peaks near the precessional phase of 120° (Fig. 5c, blue line), corresponding to a late July perihelion. This means that the perihelion latitude is almost at its northernmost position (Fig. 5c, coloured circle).
From August to February, the terrestrial precipitation migrates southward, completing an annual cycle (Fig. 1). Whenever (the season) and wherever (the latitude) perihelion occurs, the related seasonal and latitudinal terrestrial precipitation reaches its maximum. This leads asynchronous terrestrial precipitation optimum at different seasons and latitudes (Fig. 5, blue arrow in the left panels).
There is good co-variation between the seasonal insolation intensity (Fig. 5, black lines), land surface temperature (Fig. 5, red lines), and terrestrial precipitation (Fig. 5, blue lines). We propose that perihelion maximises the incoming solar radiation and drives the greatest land–sea heating contrast. This thermodynamically moves the thermal Equator and the corresponding tropical convection from ocean to land (Fig. S4) (Battisti et al., 2014) and forces the strongest seasonal terrestrial precipitation within a precessional cycle. The simulated increased/decreased precipitation over land/ocean after the perihelion is supported by geologic records, which show decreased/increase δ18O over land/ocean (Cheng et al., 2016; Huang et al., 2020; Jian et al., 2022). Due to the Earth’s thermal inertia, the thermal Equator and seasonal terrestrial precipitation are not synchronised with the insolation in the same month but with the insolation about 1–2 months earlier. In agreement, such a delay has been also revealed by many other model simulations (Kutzbach et al., 2008; Erb et al., 2015; Donohoe et al., 2020; Liu et al., 2022).
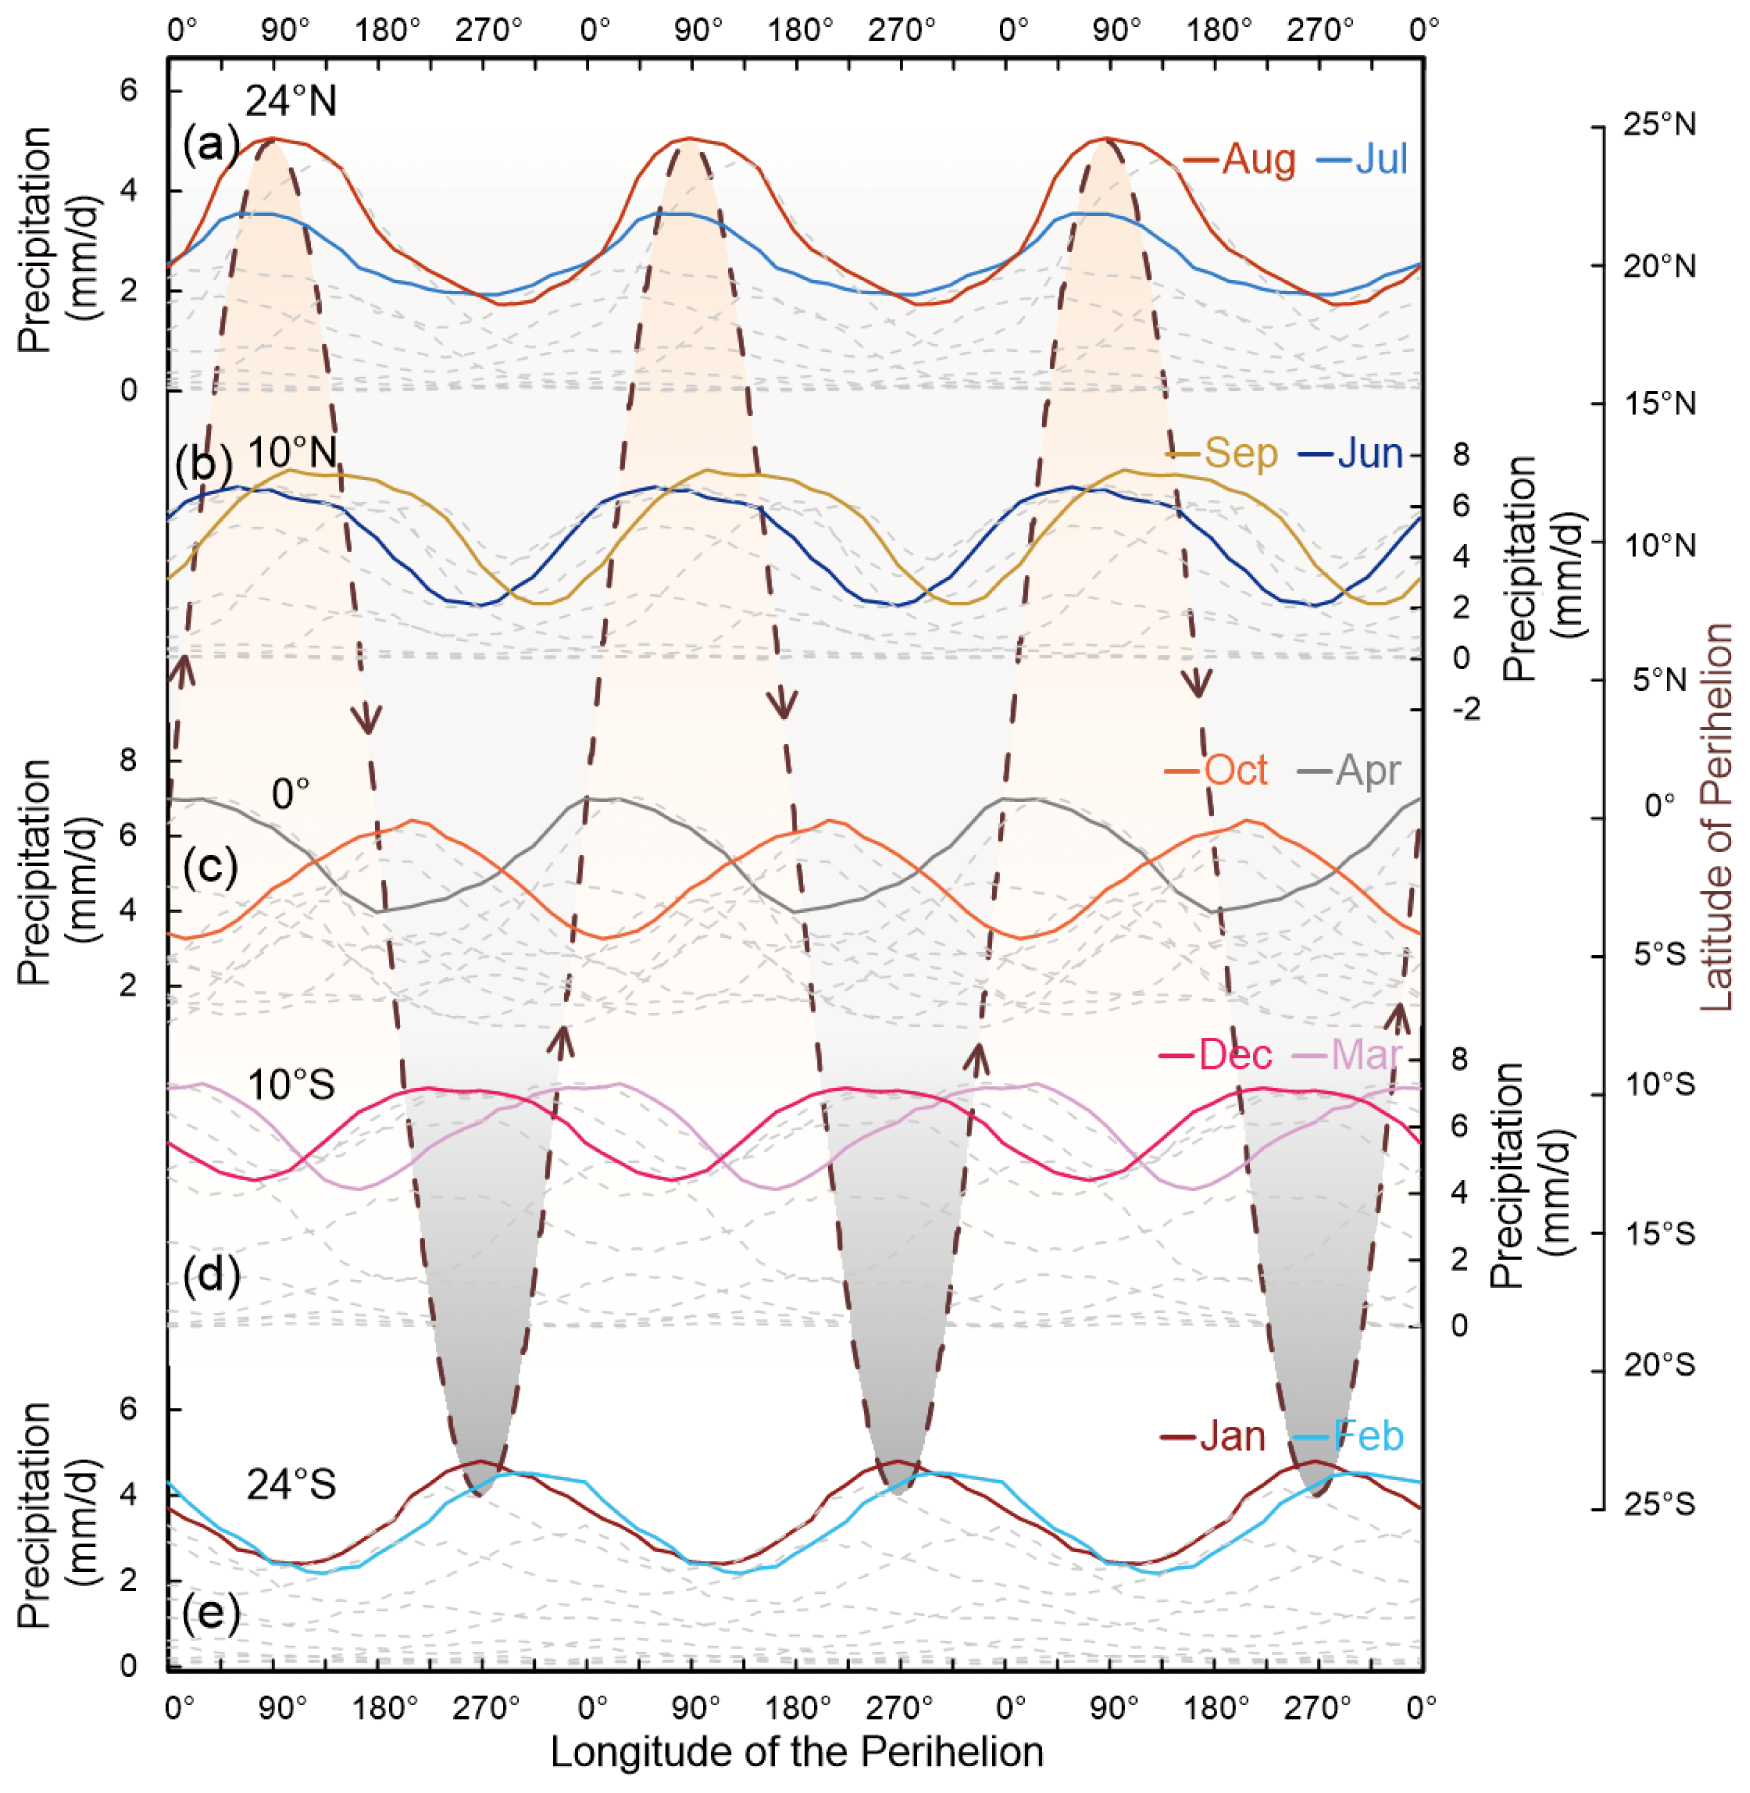
Figure 6The simulated evolution of monthly precipitation at different latitudinal bands over three precessional cycles. The precipitation is calculated as zonal mean terrestrial precipitation over latitudinal bands covering a width of 5°. For each latitudinal band, the rainy seasons are highlighted with coloured lines, and precipitation in other months is shown as dashed grey lines. The dashed copper line illustrates the meridional movement of Earth's perihelion between the Tropic of Cancer and the Tropic of Capricorn, namely the latitude of perihelion. Whenever (the season) and wherever (the latitude) perihelion occurs, the local terrestrial precipitation in the corresponding month reaches its maximum within a precessional cycle.
In a precessional cycle, the perihelion shifts toward different seasons and perihelion latitudes. This results in the strongest solar radiation and terrestrial precipitation in the corresponding season and latitudes (Fig. 6). Theoretically, for the tropical latitudes between the tropics of Cancer and Capricorn, there are two passages of perihelion latitude within a precession cycle. For instance, at the Equator, the first perihelion passage occurs at a precessional phase of 0° around the spring equinox (Fig. 3). The second perihelion passage occurs at a precessional phase of 180° around the autumnal equinox (Fig. 3). Consequently, at the Equator, the temporal interval between these two perihelion passages spans half of a precessional cycle, resulting in cyclic variations in precipitation with a period of half a precession cycle (Fig. 6c).
For the area outside the equatorial zone, the time interval between the two successive perihelion passages varies across different latitudes (Fig. 3 and Movie S1). With increasing latitude, these two perihelion passages take place closer to each other and merge into a single insolation and precipitation maximum at latitudes higher than the Tropic of Cancer (Fig. 3). This phenomenon is evident in our analysis of monthly precipitation patterns derived from zonal mean precipitation in different latitudinal belts (Fig. 6).
It is worth mentioning that we have conducted an analysis of the precipitation using a zonal mean framework. Nevertheless, region-specific variations in the precipitation signal are evident in Fig. 4. These regional characteristics are obviously affected by the land–sea distribution and topography effect.
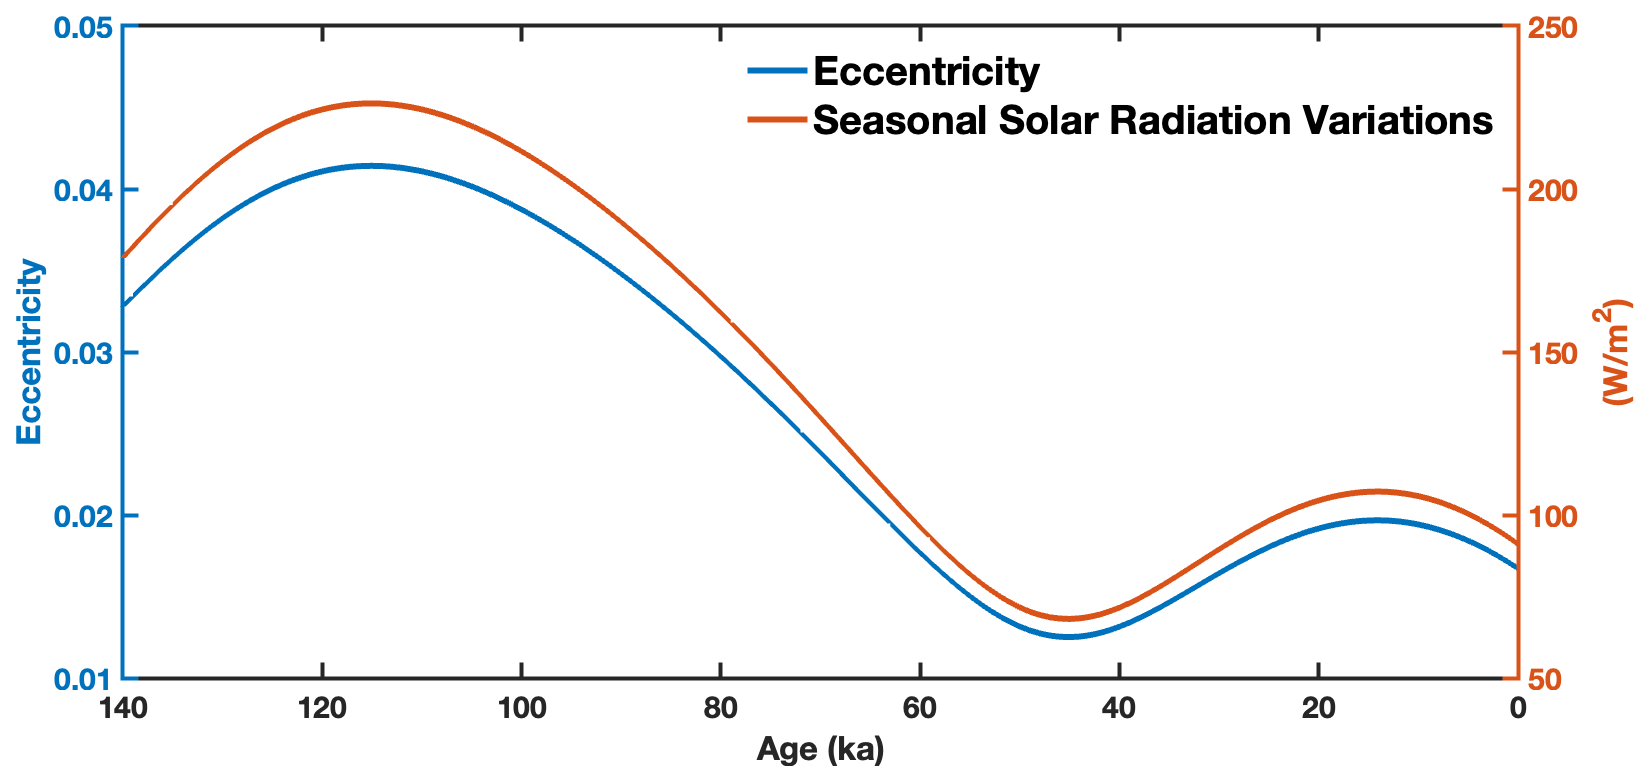
Figure 7Eccentricity and magnitude of seasonal variations in solar radiation intensity over the past 140 ka. The eccentricity is calculated according to Berger (1978), and the amplitude of seasonal incoming solar radiation intensity is computed as the difference between the solar radiation at perihelion and aphelion.
Besides model simulations, a realistic precession cycle can also be examined in the sparsely distributed geologic archives. There is a relatively abundant collection of proxies for the most recent precession cycle, spanning the past 23 ka. However, these records may not be ideal for deriving precession-associated climate changes, due to the limitation of the relatively low eccentricity (Berger, 1978, 1988), which diminishes the influence of precession on driving climate variations (Fig. 7) (Braconnot and Marti, 2003; Bosmans et al., 2018; Chiang et al., 2022; Beaufort and Sarr, 2024; Wu et al., 2023a). Moreover, the scenario becomes more complex due to a variety of factors, such as the rapid disintegration of ice sheets, rising sea levels, increasing greenhouse gas concentrations, and abrupt climate changes (Griffiths et al., 2009; Weber and Tuenter, 2011; Wang et al., 2014a; Chen et al., 2015; Chiang and Friedman, 2012; Clemens et al., 2021). Given the amplification of the precessional signal during periods of high eccentricity (Chiang and Broccoli, 2023) (Fig. 7), our investigation focused on the interval spanning 66–133 ka, thus encompassing three complete precessional cycles.
The chronology of many proxies is astronomically tuned to the Northern Hemisphere summer insolation, making them inappropriate for addressing the asynchronous signals at different latitudes. Here, we utilise the absolute-dated speleothem δ18O records which were widely used as proxies of precipitation amount, despite the fact that they are also somewhat affected by other factors (Dykoski et al., 2005; Lachniet, 2009; Cai et al., 2010; Fairchild and Baker, 2012; Parker et al., 2021). We synthesise proxies from China (Cheng et al., 2016), Malaysia (Carolin et al., 2013, 2016), and Brazil (Cruz Jr. et al., 2005) to test our hypothesis (Fig. 2). These records are selected because they are representative of three typical regions (i.e. northern limit, Equator, and southern limit of low latitude) and have continuous long coverage and high-resolution uranium–thorium chronologies. Moreover, these records also document the precession-dominated precipitation variations well.
Tropical speleothem δ18O records typically reflect an amount (or infiltration)-weighted annual mean precipitation δ18O and are therefore typically biased towards the rainy season (Kwiecien et al., 2022; Liu et al., 2022). Modern observations indicate that the rainy season near southeastern China is boreal summer, whereas the dominant rainy season in Brazil is boreal winter. In the vicinity of Malaysia, there are two prevailing rainy seasons, namely the boreal spring and autumn (Fig. S1 in the Supplement). Accordingly, we expect that the δ18O signals in the selected regions reflect precipitation changes in their corresponding rainy seasons.
As depicted in Fig. 2b, the perihelion latitude reaches its northernmost position at the 90° precessional phase, corresponding to maximum insolation in boreal summer and maximum precipitation in eastern Asian summer. Around the precessional phase of 180°, the latitude of perihelion is close to the Equator, corresponding to maximum insolation in autumnal equinox (Figs. 3 and S2c). The maximum boreal autumn insolation drives the maximum equatorial precipitation, as evidenced by the speleothem record from Malaysia around 121.7 and 99.9 ka (Fig. 2c). As perihelion migrates to its southernmost position, i.e. at the 270° precessional phase (Figs. 3 and S2d), the precipitation optimum is identified in Brazil, in agreement with the boreal winter insolation maxima (Fig. 2d). At a precessional phase of 0°, perihelion occurs around the Equator in spring equinox (Figs. 3 and S2a). This leads to maximal insolation in March (Fig. 2c, grey line). We find maximum precipitation signals in the Malaysia speleothem record (Fig. 2c, red line) around 110.9 and 88.5 ka, corresponding to two maxima in March insolation. The perihelion moves to its northernmost position at the precessional phase of 90°, thus completing a full precessional cycle. For the East Asian and South American summer precipitation, they reach their minima during the hemispheric summer insolation minima. In contrast, at the Equator, the minimum precipitation occurs not during seasonal insolation minima but during the time when insolation is relatively weak in both rainy seasons, i.e. at the precession phases of 90 and 270° (Fig. 6c), approximately 116.2, 105.5, and 82.8 ka (Fig. 2c).
Regionally, there are not perfect agreements between the seasonal insolation variations and speleothem records. For example, the Chinese proxies peak at 90° longitude of perihelion around 127.3 ka. They stay high until after 121.7 ka. This long-term precipitation optimum was likely maintained by relatively high CO2 during the last interglacial period. Moreover, millennial-scale abrupt climate changes originating from the North Atlantic also play a role in shaping the precipitation across the low latitudes (Wang et al., 2008; Chiang and Friedman, 2012). This is evident in the abrupt jumps in δ18O signals from all different latitudes (Fig. 2). In addition, we noticed that the manifestation of October insolation in half the precessional signals in the Malaysia record is relatively stronger than that of the insolation in March. This is likely attributed to a stronger boreal autumn rain than the boreal spring rain in Malaysia (Fig. S1).
The results based on the speleothem records suggest that, wherever the perihelion occurs, the local terrestrial precipitation peaks. This exhibits an asynchronous precipitation optimum following the meridional migration of perihelion (Fig. 1, dashed line). Near the Equator, half-precessional signals are identified, in agreement with our model simulations (Fig. 6) and many other records from the tropical area (Trauth and Strecker, 1996; Trauth et al., 2003; Verschuren et al., 2009; Jian et al., 2020).
It is interesting to note that shifting perihelion causes changes in the rainy seasons. An earlier study found that the shift in maximum summer insolation has a strong impact on the Asian monsoon (Braconnot and Marti, 2003). Boreal spring perihelion leads early northward migration of the Northern Hemisphere westerly jet (Wu et al., 2023a). In our simulations, we identify that the dominant rainy season shifted from June to September near the 10° N latitudinal belt. At the Equator, the dominant rainy season switches from April to October following the shift in perihelion (Fig. 6). This could complicate the comparison between proxies and models, as variations in the rainy seasons are difficult to distinguish by proxies (Kwiecien et al., 2022).
In this study, we investigate the dynamics of asynchronous evolution of low-latitude precipitation under precession forcing, a long-standing conundrum in palaeoclimate research. We hypothesise that the precessional-scale low-latitude hydrological cycle is paced by shifting perihelion rather than the hemispheric summer insolation. Using two sets of idealised climate model simulations, we showed that whenever and wherever perihelion occurs, the tropical terrestrial precipitation peaks in the corresponding perihelion season and latitudinal band. Under this new framework, the low-latitude precipitation naturally follows distinct rhythms. Speleothem proxies from three typical latitudes were included to test our hypothesis, which shows that the regional precipitation optimum matches the meridional migration of perihelion latitude.
Previous studies have used transient simulations to investigate the dynamics of orbital-scale climate changes. These simulations introduced transient forcing attributed to the Earth's changing orbit (Kutzbach et al., 2008; He, 2011; Singarayer et al., 2017; Liu et al., 2022), CO2, the land–sea mask, and ice sheet configurations (Liu et al., 2009). Despite being more realistic, the simulations with various forcing factors have added difficulty in disentangling the dynamics of the impact of precession on low-latitude climate changes (Chen et al., 2015; Cheng et al., 2021; Griffiths et al., 2009; Ran and Feng, 2013). Time-slice simulations with precession extremes were also performed (Kutzbach, 1981; Braconnot et al., 2008; Battisti et al., 2014; Erb et al., 2015; Bosmans et al., 2018; Jalihal et al., 2019) to assess the role of precession in climate change. However, they are unable to capture the diverse evolution patterns of low-latitude precipitation, as revealed by proxies (An et al., 2000; Wang et al., 2004; Cruz Jr. et al., 2005; Cheng et al., 2013; Carolin et al., 2013, 2016; Zhou et al., 2022). In this study, we performed simulations purely forced by a varying precessional phase. The results reveal that the low-latitude terrestrial precipitation maxima follow a shifting perihelion, with a time lag of 1–2 months.
Traditionally, low-latitude precipitation was regarded as a manifestation of global monsoon, which is usually defined as occurring in hemispheric summer (Wang and Ding, 2008; Wang et al., 2014a, 2017; Geen et al., 2020). Therefore, the inter-hemispheric summer insolation difference was regarded as the main driver of precipitation changes at low latitudes (Wang et al., 2014a; Schneider et al., 2014). Under this framework, the non-summer precipitation has received less attention. In reality, the ITCZ-related precipitation occurs in different seasons (Fig. 1), not necessarily during the hemispheric summer. Therefore, a comprehensive hypothesis should explain precipitation changes not only in the hemispheric summer but also in other seasons. We find that shifting perihelion likely plays an important role in the fluctuations of seasonal and latitudinal tropical precipitation.
Several studies have shown that the distance effect, or perihelion and aphelion, has an impact on low-latitude seasonality in addition to the march of Earth's subsolar point (Braconnot et al., 2008; Chiang et al., 2022; Beaufort and Sarr, 2024; Wu et al., 2023a; Chiang and Broccoli, 2023; Hunt et al., 2023). Increased solar radiation can thermodynamically shift the tropical convergence zone from ocean to land (Battisti et al., 2014); thus the terrestrial precipitation is enhanced at perihelion. Perihelion occurs in different seasons and latitudes, driving enhancement of terrestrial precipitation in the corresponding seasons and latitudes. From this point of view, insolation in individual seasons is equally important in determining the evolution of low-latitude precipitation.
Astronomical tuning is widely used to establish the chronology of palaeo-proxies. By doing this, the phasing of proxies is artificially synchronised. However, our results indicate that the astronomically driven climate changes can naturally follow diverse rhythms. This questions the reliability of the astronomical tuning strategy. For example, absolutely dated proxies indicate an asynchronous onset and termination of Sahara greening at different latitudes (Kuper and Kropelin, 2006; Hély et al., 2014; Shanahan et al., 2015). Synchronising the ages of proxies from different regions may lead to biases of a few millennia and introduce difficulties in understanding their dynamics. Based on our model simulations (Fig. 6), we suggest that astronomical tuning should target the insolation 1–2 months before the local rainy season, at least for precipitation-related proxies in low latitudes.
We evaluated our hypothesis using limited speleothem δ18O records as proxies of the precipitation amount. However, speleothem δ18O signals can be influenced not only by changes in precipitation amount but also by a variety of other factors (Baker et al., 2019), such as the moisture source (Maher and Thompson, 2012), the transport pathway (Griffiths et al., 2009; Wurtzel et al., 2018), the degree of upstream precipitation (Cheng et al., 2013; Shi et al., 2025), atmospheric circulation (Breitenbach et al., 2010; Sinha et al., 2015), cave microclimate (Vieten et al., 2016; Sekhon et al., 2021; Treble et al., 2022; Patterson et al., 2024), or a combination of these processes (Dykoski et al., 2005; Lachniet, 2009; Fairchild and Baker, 2012; Baker et al., 2019; Parker et al., 2021). This causes additional uncertainties. Therefore, validating using a wide range of additional proxies is necessary and welcomed.
The present study focuses solely on how precession affects the low-latitude hydrological cycle. Besides precession, many other factors also contribute to shaping the ITCZ precipitation. For example, high obliquity increases the hemispheric summer insolation, thereby contributing to an increase in hemispheric monsoon precipitation (Erb et al., 2015; Bischoff et al., 2017; Bosmans et al., 2018). The presence of high-latitude ice sheets introduces hemispheric cooling, moving the ITCZ away from the cold hemisphere (Chiang and Bitz, 2005; Weber and Tuenter, 2011; Chen et al., 2015; Clemens et al., 2021; Wu et al., 2023b). Similarly, abrupt North Atlantic cooling events associated with the collapse of the Atlantic Meridional Overturning Circulation drive the southward shift in the ITCZ (Wang et al., 2008; Chiang and Friedman, 2012; Singarayer et al., 2017). Sea level fluctuations alter the land–sea distribution, affecting the supply of moisture and therefore regional precipitation (Griffiths et al., 2009). The combination of these factors results in a complex evolution of precipitation changes (Bischoff et al., 2017; Lyu et al., 2021; Yuan et al., 2023), which may also give rise to asynchronous precipitation signals throughout low-latitude regions.
By detailing the position and seasonal timing of perihelion (Fig. 3), the precession-induced terrestrial precipitation maxima can easily be predicted at a given latitude and season. Currently, perihelion takes place around the Tropic of Capricorn; the Southern Hemisphere summer monsoon is relatively strong. Over the next few thousand years, following the movement of perihelion towards the Equator, the equatorial terrestrial precipitation around the spring equinox will be enhanced. Compared to the classical theory, which highlights the role of summer insolation in driving a synchronous ITCZ migration, we hypothesise an asynchronous nature of low-latitude precipitation optimums following the shifting perihelion. This offers a more plausible explanation for the observed asynchronous response of low-latitude precipitation to precessional forcing.
The model output used in this study can be accessed at https://doi.org/10.5281/zenodo.13681175 (Yang, 2024b).
The supplement related to this article is available online at https://doi.org/10.5194/cp-21-1263-2025-supplement.
HY conceived the idea, performed the model simulations, and wrote the first draft. XXS presented the calendar correction of model results. QSL identified the half-precessional signal in the Malaysia records. XDL suggested including discussion on the half-precessional signal in the tropics. YBS provided a suggestion to arrange the proxy order in Fig. 2. YJC helped to search available proxies to support this study. LJL helped to redraw Figs. 2 and 6 using CorelDraw. All authors participated in the discussion and revision of the article.
The contact author has declared that none of the authors has any competing interests.
Publisher’s note: Copernicus Publications remains neutral with regard to jurisdictional claims made in the text, published maps, institutional affiliations, or any other geographical representation in this paper. While Copernicus Publications makes every effort to include appropriate place names, the final responsibility lies with the authors.
We acknowledge Marie-France Loutre and the two anonymous reviewers for providing valuable comments to improve the article. This study was supported by Southern Marine Science and Engineering Guangdong Laboratory (Zhuhai; grant no. SML2023SP204), the Ocean Negative Carbon Emissions (ONCE) programme, and the National Natural Science Foundation of China. The AWI-ESM simulations were conducted on the Deutsche Klimarechenzentrum (DKRZ) and AWI supercomputer (Ollie).
This research has been supported by the Southern Marine Science and Engineering Guangdong Laboratory (Zhuhai) (grant no. SML2023SP204), the Global Ocean Negative Carbon Emissions (ONCE) programme, and the National Natural Science Foundation of China.
This paper was edited by Russell Drysdale and reviewed by two anonymous referees.
An, Z., Porter, S. C., Kutzbach, J. E., Xihao, W., Suming, W., Xiaodong, L., Xiaoqiang, L., and Weijian, Z.: Asynchronous Holocene optimum of the East Asian monsoon, Quaternary Sci. Rev., 19, 743–762, 2000. a, b, c, d
Armstrong, E., Tallavaara, M., Hopcroft, P. O., and Valdes, P. J.: North African humid periods over the past 800,000 years, Nat. Commun., 14, 5549, https://doi.org/10.1038/s41467-023-41219-4, 2023. a
Baker, A., Hartmann, A., Duan, W., Hankin, S., Comas-Bru, L., Cuthbert, M. O., Treble, P. C., Banner, J., Genty, D., Baldini, L. M., Bartolomé, M., Moreno, A., Pérez-Mejías, C., and Werner, M.: Global analysis reveals climatic controls on the oxygen isotope composition of cave drip water, Nat. Commun., 10, 2984, https://doi.org/10.1038/s41467-019-11027-w, 2019. a, b
Baker, P. A., Rigsby, C. A., Seltzer, G. O., Fritz, S. C., Lowenstein, T. K., Bacher, N. P., and Veliz, C.: Tropical climate changes at millennial and orbital timescales on the Bolivian Altiplano, Nature, 409, 698–701, 2001. a
Barry, R. G. and Chorley, R. J.: Atmosphere, weather and climate, Routledge, https://doi.org/10.4324/9780203871027, 2009. a
Battisti, D., Ding, Q., and Roe, G.: Coherent pan-Asian climatic and isotopic response to orbital forcing of tropical insolation, J. Geophys. Res.-Atmos., 119, 11–997, 2014. a, b, c, d
Beaufort, L. and Sarr, A.-C.: Eccentricity forcing on tropical ocean seasonality, Clim. Past, 20, 1283–1301, https://doi.org/10.5194/cp-20-1283-2024, 2024. a, b
Beaufort, L., van der Kaars, S., Bassinot, F. C., and Moron, V.: Past dynamics of the Australian monsoon: precession, phase and links to the global monsoon concept, Clim. Past, 6, 695–706, https://doi.org/10.5194/cp-6-695-2010, 2010. a
Berger, A.: Long-term variations of daily insolation and Quaternary climatic changes, J. Atmos. Sci., 35, 2362–2367, 1978. a, b, c, d, e
Berger, A.: Milankovitch theory and climate, Revi. Geophys., 26, 624–657, 1988. a, b
Bischoff, T., Schneider, T., and Meckler, A. N.: A conceptual model for the response of tropical rainfall to orbital variations, J. Climate, 30, 8375–8391, 2017. a, b, c
Bosmans, J., Erb, M., Dolan, A., Drijfhout, S., Tuenter, E., Hilgen, F., Edge, D., Pope, J. O., and Lourens, L.: Response of the Asian summer monsoons to idealized precession and obliquity forcing in a set of GCMs, Quaternary Sci. Rev., 188, 121–135, 2018. a, b, c
Braconnot, P. and Marti, O.: Impact of precession on monsoon characteristics from coupled ocean atmosphere experiments: changes in Indian monsoon and Indian ocean climatology, Mar. Geol., 201, 23–34, 2003. a, b, c, d, e
Braconnot, P., Marzin, C., Grégoire, L., Mosquet, E., and Marti, O.: Monsoon response to changes in Earth's orbital parameters: comparisons between simulations of the Eemian and of the Holocene, Clim. Past, 4, 281–294, https://doi.org/10.5194/cp-4-281-2008, 2008. a, b, c
Breitenbach, S. F., Adkins, J. F., Meyer, H., Marwan, N., Kumar, K. K., and Haug, G. H.: Strong influence of water vapor source dynamics on stable isotopes in precipitation observed in Southern Meghalaya, NE India, Earth Planet. Sc. Lett., 292, 212–220, 2010. a
Cai, Y., Tan, L., Cheng, H., An, Z., Edwards, R. L., Kelly, M. J., Kong, X., and Wang, X.: The variation of summer monsoon precipitation in central China since the last deglaciation, Earth Planet. Sc. Lett., 291, 21–31, 2010. a, b
Carolin, S. A., Cobb, K. M., Adkins, J. F., Clark, B., Conroy, J. L., Lejau, S., Malang, J., and Tuen, A. A.: Varied response of western Pacific hydrology to climate forcings over the last glacial period, Science, 340, 1564–1566, 2013. a, b, c, d, e, f, g, h, i, j
Carolin, S. A., Cobb, K. M., Lynch-Stieglitz, J., Moerman, J. W., Partin, J. W., Lejau, S., Malang, J., Clark, B., Tuen, A. A., and Adkins, J. F.: Northern Borneo stalagmite records reveal West Pacific hydroclimate across MIS 5 and 6, Earth Planet. Sc. Lett., 439, 182–193, 2016. a, b, c, d, e, f, g
Chen, F., Xu, Q., Chen, J., Birks, H. J. B., Liu, J., Zhang, S., Jin, L., An, C., Telford, R. J., Cao, X., Wang, Z., Zhang, X., Selvaraj, K., Lu, H., Li, Y., Zheng, Z., Wang, H., Zhou, A., Dong, G., Zhang, J., Huang, X., Bloemendal, J., and Rao, Z.: East Asian summer monsoon precipitation variability since the last deglaciation, Sci. Rep., 5, 1–11, 2015. a, b, c, d, e, f
Cheng, H., Edwards, R. L., Broecker, W. S., Denton, G. H., Kong, X., Wang, Y., Zhang, R., and Wang, X.: Ice age terminations, Science, 326, 248–252, 2009. a
Cheng, H., Sinha, A., Wang, X., Cruz, F. W., and Edwards, R. L.: The Global Paleomonsoon as seen through speleothem records from Asia and the Americas, Clim. Dynam., 39, 1045–1062, 2012. a
Cheng, H., Sinha, A., Cruz, F. W., Wang, X., Edwards, R. L., d’Horta, F. M., Ribas, C. C., Vuille, M., Stott, L. D., and Auler, A. S.: Climate change patterns in Amazonia and biodiversity, Nat. Commun., 4, 1411, https://doi.org/10.1038/ncomms2415, 2013. a, b, c
Cheng, H., Edwards, R. L., Sinha, A., Spötl, C., Yi, L., Chen, S., Kelly, M., Kathayat, G., Wang, X., Li, X., Kong, X., Wang, Y., Ning, Y., and Zhang, H.: The Asian monsoon over the past 640,000 years and ice age terminations, Nature, 534, 640–646, 2016. a, b, c, d, e, f
Cheng, H., Li, H., Sha, L., Sinha, A., Shi, Z., Yin, Q., Lu, Z., Zhao, D., Cai, Y., Hu, Y., Hao, Q., Tian, J., Kathayat, G., Dong, X., Zhao, J., and Zhang, H.: Milankovitch theory and monsoon, Innovation, 3, 100338, https://doi.org/10.1016/j.xinn.2022.100338, 2022. a
Cheng, J., Wu, H., Liu, Z., Gu, P., Wang, J., Zhao, C., Li, Q., Chen, H., Lu, H., Hu, H., Gao, Y., Yu, M., and Song, Y.: Vegetation feedback causes delayed ecosystem response to East Asian Summer Monsoon Rainfall during the Holocene, Nat. Commun., 12, 1843, https://doi.org/10.1038/s41467-021-22087-2, 2021. a, b, c
Chiang, J. C. and Bitz, C. M.: Influence of high latitude ice cover on the marine Intertropical Convergence Zone, Clim. Dynam., 25, 477–496, 2005. a, b
Chiang, J. C. and Broccoli, A. J.: A role for orbital eccentricity in Earth’s seasonal climate, Geosci. Lett., 10, 58, https://doi.org/10.1186/s40562-023-00313-7, 2023. a, b
Chiang, J. C. and Friedman, A. R.: Extratropical cooling, interhemispheric thermal gradients, and tropical climate change, Annu. Rev. Earth Planet. Sci., 40, 383–412, 2012. a, b, c, d
Chiang, J. C., Atwood, A. R., Vimont, D. J., Nicknish, P. A., Roberts, W. H., Tabor, C. R., and Broccoli, A. J.: Two annual cycles of the Pacific cold tongue under orbital precession, Nature, 611, 295–300, 2022. a, b
Clemens, S. C. and Prell, W. L.: The timing of orbital-scale Indian monsoon changes, Quaternary Sci. Rev., 26, 275–278, 2007. a, b, c
Clemens, S. C., Yamamoto, M., Thirumalai, K., Giosan, L., Richey, J. N., Nilsson-Kerr, K., Rosenthal, Y., Anand, P., and McGrath, S. M.: Remote and local drivers of Pleistocene South Asian summer monsoon precipitation: A test for future predictions, Sci. Adv., 7, eabg3848, https://doi.org/10.1126/sciadv.abg3848, 2021. a, b
Clement, A. C., Hall, A., and Broccoli, A.: The importance of precessional signals in the tropical climate, Clim. Dynam., 22, 327–341, 2004. a
Cruz Jr., F. W., Burns, S. J., Karmann, I., Sharp, W. D., Vuille, M., Cardoso, A. O., Ferrari, J. A., Silva Dias, P. L., and Viana Jr., O.: Insolation-driven changes in atmospheric circulation over the past 116,000 years in subtropical Brazil, Nature, 434, 63–66, 2005. a, b, c, d, e, f, g, h
Danilov, S., Sidorenko, D., Wang, Q., and Jung, T.: The Finite-volumE Sea ice–Ocean Model (FESOM2), Geosci. Model Dev., 10, 765–789, https://doi.org/10.5194/gmd-10-765-2017, 2017. a
DeMenocal, P. B. and Tierney, J. E.: Green Sahara: African humid periods paced by Earth's orbital changes, Nature Education Knowledge, 3, 12, 2012. a
Donohoe, A., Dawson, E., McMurdie, L., Battisti, D. S., and Rhines, A.: Seasonal asymmetries in the lag between insolation and surface temperature, J. Climate, 33, 3921–3945, 2020. a
Dykoski, C. A., Edwards, R. L., Cheng, H., Yuan, D., Cai, Y., Zhang, M., Lin, Y., Qing, J., An, Z., and Revenaugh, J.: A high-resolution, absolute-dated Holocene and deglacial Asian monsoon record from Dongge Cave, China, Earth Planet. Sc. Lett., 233, 71–86, 2005. a, b, c
El-Shenawy, M. I., Kim, S.-T., Schwarcz, H. P., Asmerom, Y., and Polyak, V. J.: Speleothem evidence for the greening of the Sahara and its implications for the early human dispersal out of sub-Saharan Africa, Quaternary Sci. Rev., 188, 67–76, 2018. a
Erb, M. P., Jackson, C. S., and Broccoli, A. J.: Using single-forcing GCM simulations to reconstruct and interpret quaternary climate change, J. Climate, 28, 9746–9767, 2015. a, b, c, d
Fairchild, I. J. and Baker, A.: Speleothem science: from process to past environments, John Wiley & Sons, https://doi.org/10.1002/9781444361094, 2012. a, b
Gadgil, S.: The monsoon system: Land–sea breeze or the ITCZ?, J. Earth Syst. Sci., 127, 1–29, 2018. a
Geen, R., Bordoni, S., Battisti, D. S., and Hui, K.: Monsoons, ITCZs, and the concept of the global monsoon, Rev. Geophys., 58, e2020RG000700, https://doi.org/10.1029/2020RG000700, 2020. a, b
Giorgetta, M. A., Roeckner, E., Mauritsen, T., Bader, J., Crueger, T., Esch, M., Rast, S., Kornblueh, L., Schmidt, H., Kinne, S., Hohenegger, C., Möbis, B., Krismer, T., Wieners, K., and Bjorn, S.: The atmospheric general circulation model ECHAM6-model description, https://doi.org/10.17617/2.1810480, 2013. a
Griffiths, M. L., Drysdale, R. N., Gagan, M., Zhao, J.-x., Ayliffe, L., Hellstrom, J. C., Hantoro, W., Frisia, S., Feng, Y.-x., Cartwright, I., Pierre, E. S., Fischer, M. J., and Suwargadi, B. W.: Increasing Australian–Indonesian monsoon rainfall linked to early Holocene sea-level rise, Nat. Geosci., 2, 636–639, 2009. a, b, c, d, e
Hannachi, A., Jolliffe, I. T., and Stephenson, D. B.: Empirical orthogonal functions and related techniques in atmospheric science: A review, Int. J. Climatol., 27, 1119–1152, 2007. a
He, F.: Simulating transient climate evolution of the last deglaciation with CCSM 3, vol. 72, University of Wisconsin–Madison, 2011. a
Hély, C., Lézine, A.-M., and contributors, A.: Holocene changes in African vegetation: tradeoff between climate and water availability, Clim. Past, 10, 681–686, https://doi.org/10.5194/cp-10-681-2014, 2014. a, b
Huang, E., Wang, P., Wang, Y., Yan, M., Tian, J., Li, S., and Ma, W.: Dole effect as a measurement of the low-latitude hydrological cycle over the past 800 ka, Sci. Adv., 6, eaba4823, https://doi.org/10.1126/sciadv.aba4823, 2020. a, b
Hunt, J., Lister, K., Nascimento, A., and Vasconcelos de Freitas, M.: The Ideal Climate Latitude: Orbit and Axial Precession Influence in Ancient Migration, Archaeology & Anthropology: Open Access, 4, 671–678, 2023. a
Jalihal, C., Bosmans, J. H. C., Srinivasan, J., and Chakraborty, A.: The response of tropical precipitation to Earth's precession: the role of energy fluxes and vertical stability, Clim. Past, 15, 449–462, https://doi.org/10.5194/cp-15-449-2019, 2019. a
Jian, Z., Wang, Y., Dang, H., Lea, D. W., Liu, Z., Jin, H., and Yin, Y.: Half-precessional cycle of thermocline temperature in the western equatorial Pacific and its bihemispheric dynamics, P. Natl. Acad. Sci. USA, 117, 7044–7051, 2020. a
Jian, Z., Wang, Y., Dang, H., Mohtadi, M., Rosenthal, Y., Lea, D. W., Liu, Z., Jin, H., Ye, L., Kuhnt, W., and Wang, X.: Warm pool ocean heat content regulates ocean–continent moisture transport, Nature, 612, 92–99, 2022. a
Joussaume, S. and Braconnot, P.: Sensitivity of paleoclimate simulation results to season definitions, J. Geophys. Res.-Atmos., 102, 1943–1956, 1997. a, b
Kageyama, M., Braconnot, P., Harrison, S. P., Haywood, A. M., Jungclaus, J. H., Otto-Bliesner, B. L., Peterschmitt, J.-Y., Abe-Ouchi, A., Albani, S., Bartlein, P. J., Brierley, C., Crucifix, M., Dolan, A., Fernandez-Donado, L., Fischer, H., Hopcroft, P. O., Ivanovic, R. F., Lambert, F., Lunt, D. J., Mahowald, N. M., Peltier, W. R., Phipps, S. J., Roche, D. M., Schmidt, G. A., Tarasov, L., Valdes, P. J., Zhang, Q., and Zhou, T.: The PMIP4 contribution to CMIP6 – Part 1: Overview and over-arching analysis plan, Geosci. Model Dev., 11, 1033–1057, https://doi.org/10.5194/gmd-11-1033-2018, 2018. a
Kaushal, N., Lechleitner, F. A., Wilhelm, M., Azennoud, K., Bühler, J. C., Braun, K., Ait Brahim, Y., Baker, A., Burstyn, Y., Comas-Bru, L., Fohlmeister, J., Goldsmith, Y., Harrison, S. P., Hatvani, I. G., Rehfeld, K., Ritzau, M., Skiba, V., Stoll, H. M., Szűcs, J. G., Tanos, P., Treble, P. C., Azevedo, V., Baker, J. L., Borsato, A., Chawchai, S., Columbu, A., Endres, L., Hu, J., Kern, Z., Kimbrough, A., Koç, K., Markowska, M., Martrat, B., Masood Ahmad, S., Nehme, C., Novello, V. F., Pérez-Mejías, C., Ruan, J., Sekhon, N., Sinha, N., Tadros, C. V., Tiger, B. H., Warken, S., Wolf, A., Zhang, H., and SISAL Working Group members: SISALv3: a global speleothem stable isotope and trace element database, Earth Syst. Sci. Data, 16, 1933–1963, https://doi.org/10.5194/essd-16-1933-2024, 2024. a
Kelly, M. J., Edwards, R. L., Cheng, H., Yuan, D., Cai, Y., Zhang, M., Lin, Y., and An, Z.: High resolution characterization of the Asian Monsoon between 146,000 and 99,000 years BP from Dongge Cave, China and global correlation of events surrounding Termination II, Palaeogeogr. Palaeocl., 236, 20–38, 2006. a
Kostadinov, T. S. and Gilb, R.: Earth Orbit v2.1: a 3-D visualization and analysis model of Earth's orbit, Milankovitch cycles and insolation, Geosci. Model Dev., 7, 1051–1068, https://doi.org/10.5194/gmd-7-1051-2014, 2014. a
Kuper, R. and Kropelin, S.: Climate-controlled Holocene occupation in the Sahara: motor of Africa's evolution, Science, 313, 803–807, 2006. a, b, c, d
Kutzbach, J. and Gallimore, R.: Sensitivity of a coupled atmosphere/mixed layer ocean model to changes in orbital forcing at 9000 years BP, J. Geophys. Res.-Atmos., 93, 803–821, 1988. a
Kutzbach, J., Liu, X., Liu, Z., and Chen, G.: Simulation of the evolutionary response of global summer monsoons to orbital forcing over the past 280,000 years, Clim. Dynam., 30, 567–579, 2008. a, b, c
Kutzbach, J. E.: Monsoon climate of the early Holocene: climate experiment with the earth's orbital parameters for 9000 years ago, Science, 214, 59–61, 1981. a, b, c
Kwiecien, O., Braun, T., Brunello, C. F., Faulkner, P., Hausmann, N., Helle, G., Hoggarth, J. A., Ionita, M., Jazwa, C. S., Kelmelis, S., Marwan, N., Nava-Fernandez, C., Nehme, C., Opel, T., Oster, J. L., Perşoiu, A., Petrie, C., Prufer, K., Saarni, S. M., Wolf, A., and Breitenbach, S. F.: What we talk about when we talk about seasonality–A transdisciplinary review, Earth-Sci. Rev., 225, 103843, https://doi.org/10.1016/j.earscirev.2021.103843, 2022. a, b
Lachniet, M. S.: Climatic and environmental controls on speleothem oxygen-isotope values, Quaternary Sc. Rev., 28, 412–432, 2009. a, b
Laskar, J.: The chaotic motion of the solar system: A numerical estimate of the size of the chaotic zones, Icarus, 88, 266–291, 1990. a
Laskar, J., Joutel, F., and Boudin, F.: Orbital, precessional, and insolation quantities for the Earth from-20 Myr to+ 10 Myr, Astron. Astrophys., 270, 522–533, 1993. a
Li, X., Zhou, Y., Han, Z., Yuan, X., Yi, S., Zeng, Y., Qin, L., Lu, M., and Lu, H.: Loess deposits in the low latitudes of East Asia reveal the 20-kyr precipitation cycle, Nat. Commun., 15, 1023, https://doi.org/10.1038/s41467-024-45379-9, 2024. a
Lisiecki, L. E. and Raymo, M. E.: A Pliocene-Pleistocene stack of 57 globally distributed benthic δ18O records, Paleoceanography, 20, PA1003, https://doi.org/10.1029/2004PA001071, 2005. a
Liu, J., Chen, J., Zhang, X., Li, Y., Rao, Z., and Chen, F.: Holocene East Asian summer monsoon records in northern China and their inconsistency with Chinese stalagmite δ18O records, Earth-Sci. Rev., 148, 194–208, 2015. a, b
Liu, X., Xie, X., Guo, Z., Yin, Z.-Y., and Chen, G.: Model-based orbital-scale precipitation δ18O variations and distinct mechanisms in Asian monsoon and arid regions, Nat. Sci. Rev., 9, nwac182, https://doi.org/10.1093/nsr/nwac182, 2022. a, b, c, d, e
Liu, Z., Otto-Bliesner, B., He, F., Brady, E., Tomas, R., Clark, P., Carlson, A., Lynch-Stieglitz, J., Curry, W., Brook, E., Erickson, D., Jacob, R., Kutzbach, J., and Cheng, J.: Transient simulation of last deglaciation with a new mechanism for Bølling-Allerød warming, Science, 325, 310–314, 2009. a
Lougheed, B. C.: Orbital, the Box-An interactive educational tool for in-depth understanding of astronomical climate forcing, https://doi.org/10.5334/oq.100, 2021. a
Lu, H., Yi, S., Liu, Z., Mason, J. A., Jiang, D., Cheng, J., Stevens, T., Xu, Z., Zhang, E., Jin, L., Zhang, Z., Guo, Z., Wang, Y., and Otto-Bliesner, B.: Variation of East Asian monsoon precipitation during the past 21 ky and potential CO2 forcing, Geology, 41, 1023–1026, 2013. a
Lyu, A., Yin, Q., Crucifix, M., and Sun, Y.: Diverse regional sensitivity of summer precipitation in East Asia to ice volume, CO2 and astronomical forcing, Geophys. Res. Lett., 48, e2020GL092005, https://doi.org/10.1029/2020GL092005, 2021. a
Maher, B. A. and Thompson, R.: Oxygen isotopes from Chinese caves: records not of monsoon rainfall but of circulation regime, J. Quaternary Sci., 27, 615–624, 2012. a
McGrath, S. M., Clemens, S. C., Huang, Y., and Yamamoto, M.: Greenhouse gas and ice volume drive Pleistocene Indian summer monsoon precipitation isotope variability, Geophys. Res. Lett., 48, e2020GL092249, https://doi.org/10.1029/2020GL092249, 2021. a
Milankovitch, M.: Canon of Insolation and the Ice Age Problem, Königlich Serbische Akademie, 1941 (in German). a, b
Neelin, J. D. and Held, I. M.: Modeling tropical convergence based on the moist static energy budget, Mon. Weather Rev., 115, 3–12, 1987. a, b
Parker, S. E., Harrison, S. P., Comas-Bru, L., Kaushal, N., LeGrande, A. N., and Werner, M.: A data–model approach to interpreting speleothem oxygen isotope records from monsoon regions, Clim. Past, 17, 1119–1138, https://doi.org/10.5194/cp-17-1119-2021, 2021. a, b
Patterson, E., Skiba, V., Wolf, A., Griffiths, M., McGee, D., Bui, T., Tran, M., Dinh, T., Do Trong, Q., Goldsmith, G. R., Ersek, V., and Johnson, K. R.: Local hydroclimate alters interpretation of speleothem δ18O records, Nat. Commun., 15, 9064, https://doi.org/10.1038/s41467-024-53422-y, 2024. a
Pollard, D. and Reusch, D. B.: A calendar conversion method for monthly mean paleoclimate model output with orbital forcing, J. Geophys. Res.-Atmos., 107, ACL–3, https://doi.org/10.1029/2002JD002126, 2002. a
Ran, M. and Feng, Z.: Holocene moisture variations across China and driving mechanisms: A synthesis of climatic records, Quatern. Int., 313, 179–193, 2013. a, b, c, d
Schneider, T., Bischoff, T., and Haug, G. H.: Migrations and dynamics of the intertropical convergence zone, Nature, 513, 45–53, 2014. a, b, c
Sekhon, N., Novello, V. F., Cruz, F. W., Wortham, B. E., Ribeiro, T. G., and Breecker, D. O.: Diurnal to seasonal ventilation in Brazilian caves, Global Planet. Change, 197, 103378, https://doi.org/10.1016/j.gloplacha.2020.103378, 2021. a
Shanahan, T. M., McKay, N. P., Hughen, K. A., Overpeck, J. T., Otto-Bliesner, B., Heil, C. W., King, J., Scholz, C. A., and Peck, J.: The time-transgressive termination of the African Humid Period, Na. Geosci., 8, 140–144, 2015. a, b, c
Shi, X. and Lohmann, G.: Simulated response of the mid-Holocene Atlantic meridional overturning circulation in ECHAM6-FESOM/MPIOM, J. Geophys. Res.-Oceans, 121, 6444–6469, 2016. a
Shi, X., Werner, M., Krug, C., Brierley, C. M., Zhao, A., Igbinosa, E., Braconnot, P., Brady, E., Cao, J., D'Agostino, R., Jungclaus, J., Liu, X., Otto-Bliesner, B., Sidorenko, D., Tomas, R., Volodin, E. M., Yang, H., Zhang, Q., Zheng, W., and Lohmann, G.: Calendar effects on surface air temperature and precipitation based on model-ensemble equilibrium and transient simulations from PMIP4 and PACMEDY, Clim. Past, 18, 1047–1070, https://doi.org/10.5194/cp-18-1047-2022, 2022. a
Shi, X., Werner, M., Yang, H., Gao, Q., Liu, J., and Lohmann, G.: Precession controls on climate and water isotope signals in Northern Africa, Paleoceanogr. Paleocl., 40, e2024PA004999, https://doi.org/10.1029/2024PA004999, 2025. a
Short, D. A. and Mengel, J. G.: Tropical climatic phase lags and Earth's precession cycle, Nature, 323, 48–50, 1986. a
Sidorenko, D., Rackow, T., Jung, T., Semmler, T., Barbi, D., Danilov, S., Dethloff, K., Dorn, W., Fieg, K., Gößling, H. F., Handorf, D., Harig, S., Hiller, W., Juricke, S., Losch, M., Schröter, J., Sein, D. V., and Wang, Q.: Towards multi-resolution global climate modeling with ECHAM6–FESOM. Part I: model formulation and mean climate, Clim. Dynam., 44, 757–780, 2015. a
Sidorenko, D., Goessling, H., Koldunov, N., Scholz, P., Danilov, S., Barbi, D., Cabos, W., Gurses, O., Harig, S., Hinrichs, C., Juricke, S., Lohmann, G., Losch, M., Mu, L., Rackow, T., Rakowsky, N., Sein, D., Semmler, T., Shi, X., Stepanek, C., Streffing, J., Wang, Q., Wekerle, C., Yang, H., and Jung, T.: Evaluation of FESOM2. 0 coupled to ECHAM6. 3: preindustrial and HighResMIP simulations, J. Adv. Model. Earth Sy., 11, 3794–3815, 2019. a
Singarayer, J. S., Valdes, P. J., and Roberts, W. H.: Ocean dominated expansion and contraction of the late Quaternary tropical rainbelt, Sci. Rep., 7, 9382, https://doi.org/10.1038/s41598-017-09816-8, 2017. a, b
Sinha, A., Kathayat, G., Cheng, H., Breitenbach, S. F., Berkelhammer, M., Mudelsee, M., Biswas, J., and Edwards, R.: Trends and oscillations in the Indian summer monsoon rainfall over the last two millennia, Nat. Commun., 6, 6309, https://doi.org/10.1038/ncomms7309, 2015. a
Skonieczny, C., McGee, D., Winckler, G., Bory, A., Bradtmiller, L., Kinsley, C. W., Polissar, P., De Pol-Holz, R., Rossignol, L., and Malaizé, B.: Monsoon-driven Saharan dust variability over the past 240,000 years, Sci. Adv., 5, eaav1887, https://doi.org/10.1126/sciadv.aav1887, 2019. a
Sun, Y., Chen, J., Clemens, S. C., Liu, Q., Ji, J., and Tada, R.: East Asian monsoon variability over the last seven glacial cycles recorded by a loess sequence from the northwestern Chinese Loess Plateau, Geochem. Geophy. Geosy., 7, Q12Q02, https://doi.org/10.1029/2006GC001287, 2006. a
Thamban, M., Kawahata, H., and Rao, V. P.: Indian summer monsoon variability during the Holocene as recorded in sediments of the Arabian Sea: timing and implications, J. Oceanogr., 63, 1009–1020, 2007. a
Trauth, M. and Strecker, M.: Late Pleistocene lake-level fluctuations in the Naivasha Basin, Kenya, in: Limnology, Climatology and Paleoclimatology of the East African Lakes, Routledge, 549–557, https://doi.org/10.1201/9780203748978-31, 1996. a
Trauth, M. H., Deino, A. L., Bergner, A. G., and Strecker, M. R.: East African climate change and orbital forcing during the last 175 kyr BP, Earth Planet. Sc. Lett., 206, 297–313, 2003. a
Treble, P. C., Baker, A., Abram, N. J., Hellstrom, J. C., Crawford, J., Gagan, M. K., Borsato, A., Griffiths, A. D., Bajo, P., Markowska, M., Priestley, S. C., Hankin, S., and Paterson, D.: Ubiquitous karst hydrological control on speleothem oxygen isotope variability in a global study, Commun. Earth Environ., 3, 29, https://doi.org/10.1038/s43247-022-00347-3, 2022. a
Verschuren, D., Sinninghe Damsté, J. S., Moernaut, J., Kristen, I., Blaauw, M., Fagot, M., and Haug, G. H.: Half-precessional dynamics of monsoon rainfall near the East African Equator, Nature, 462, 637–641, 2009. a
Vieten, R., Winter, A., Warken, S. F., Schroeder-Ritzrau, A., Miller, T. E., and Scholz, D.: Seasonal temperature variations controlling cave ventilation processes in Cueva Larga, Puerto Rico, Int. J. Speleol., 45, 7, https://doi.org/10.5038/1827-806X.45.3.1983, 2016. a
Wallace, J. M. and Hobbs, P. V.: Atmospheric science: an introductory survey, vol. 92, Elsevier, https://doi.org/10.1016/C2009-0-00034-8, 2006. a
Wang, B. and Ding, Q.: Global monsoon: Dominant mode of annual variation in the tropics, Dynam. Atmos. Oceans, 44, 165–183, 2008. a
Wang, P. X., Wang, B., Cheng, H., Fasullo, J., Guo, Z. T., Kiefer, T., and Liu, Z. Y.: The global monsoon across timescales: coherent variability of regional monsoons, Clim. Past, 10, 2007–2052, https://doi.org/10.5194/cp-10-2007-2014, 2014a. a, b, c, d, e, f
Wang, P. X., Wang, B., Cheng, H., Fasullo, J., Guo, Z., Kiefer, T., and Liu, Z.: The global monsoon across time scales: Mechanisms and outstanding issues, Earth-Sci. Rev., 174, 84–121, 2017. a, b
Wang, Q., Danilov, S., Sidorenko, D., Timmermann, R., Wekerle, C., Wang, X., Jung, T., and Schröter, J.: The Finite Element Sea Ice-Ocean Model (FESOM) v.1.4: formulation of an ocean general circulation model, Geosci. Model Dev., 7, 663–693, https://doi.org/10.5194/gmd-7-663-2014, 2014b. a
Wang, X., Auler, A. S., Edwards, R. L., Cheng, H., Cristalli, P. S., Smart, P. L., Richards, D. A., and Shen, C.-C.: Wet periods in northeastern Brazil over the past 210 kyr linked to distant climate anomalies, Nature, 432, 740–743, 2004. a, b, c, d, e
Wang, X., Auler, A. S., Edwards, R. L., Cheng, H., Ito, E., and Solheid, M.: Interhemispheric anti-phasing of rainfall during the last glacial period, Quaternary Sci. Rev., 25, 3391–3403, 2006. a
Wang, X., Auler, A. S., Edwards, R., Cheng, H., Ito, E., Wang, Y., Kong, X., and Solheid, M.: Millennial-scale precipitation changes in southern Brazil over the past 90,000 years, Geophys. Res. Lett., 34, L23701, https://doi.org/10.1029/2007GL031149, 2007. a
Wang, Y., Cheng, H., Edwards, R. L., Kong, X., Shao, X., Chen, S., Wu, J., Jiang, X., Wang, X., and An, Z.: Millennial-and orbital-scale changes in the East Asian monsoon over the past 224,000 years, Nature, 451, 1090–1093, 2008. a, b, c, d, e
Wang, Y.-J., Cheng, H., Edwards, R. L., An, Z., Wu, J., Shen, C.-C., and Dorale, J. A.: A high-resolution absolute-dated late Pleistocene monsoon record from Hulu Cave, China, Science, 294, 2345–2348, 2001. a
Weber, S. and Tuenter, E.: The impact of varying ice sheets and greenhouse gases on the intensity and timing of boreal summer monsoons, Quaternary Sci. Rev., 30, 469–479, 2011. a, b
Wen, Q., Liu, Z., Liu, J., Clemens, S., Jing, Z., Wang, Y., Lv, G., Yan, M., Ning, L., Yuan, L., and Gao, Y.: Contrasting responses of Indian summer monsoon rainfall and Arabian Sea upwelling to orbital forcing, Commun. Earth Environ., 5, 409, https://doi.org/10.1038/s43247-024-01572-8, 2024. a
Windler, G., Tierney, J. E., and Anchukaitis, K. J.: Glacial-interglacial shifts dominate tropical indo-Pacific hydroclimate during the late Pleistocene, Geophys. Res. Lett., 48, e2021GL093339, https://doi.org/10.1029/2021GL093339, 2021. a
Wu, C.-H., Lee, S.-Y., Chiang, J. C., and Tsai, P.-C.: Role of precession on the transition seasons of the Asian monsoon, npj Climate and Atmospheric Science, 6, 95, https://doi.org/10.1038/s41612-023-00426-y, 2023a. a, b, c
Wu, Y., Warken, S., Frank, N., Mielke, A., Chen, C.-J., Li, J.-Y., and Li, T.-Y.: Northern Hemisphere summer insolation and ice volume driven variations in hydrological environment in southwest China, Geophys. Res. Lett., 50, e2023GL105664, https://doi.org/10.1029/2023GL105664, 2023b. a, b
Wurtzel, J. B., Abram, N. J., Lewis, S. C., Bajo, P., Hellstrom, J. C., Troitzsch, U., and Heslop, D.: Tropical Indo-Pacific hydroclimate response to North Atlantic forcing during the last deglaciation as recorded by a speleothem from Sumatra, Indonesia, Earth Planet. Sc. Lett., 492, 264–278, 2018. a
Yang, H.: Supporting Video for Manuscript, Zenodo [video], https://doi.org/10.5281/zenodo.11395459, 2024a. a
Yang, H.: AWI-ESM precessional cycle simulation, Zenodo [data set], https://doi.org/10.5281/zenodo.13681177, 2024b. a
Yuan, S., Chiang, H.-W., Liu, G., Bijaksana, S., He, S., Jiang, X., Imran, A. M., Wicaksono, S. A., and Wang, X.: The strength, position, and width changes of the intertropical convergence zone since the Last Glacial Maximum, P. Natl. Acad. Sci. USA, 120, e2217064120, https://doi.org/10.1073/pnas.2217064120, 2023. a
Zhao, Y., Braconnot, P., Marti, O., Harrison, S., Hewitt, C., Kitoh, A., Liu, Z., Mikolajewicz, U., Otto-Bliesner, B., and Weber, S.: A multi-model analysis of the role of the ocean on the African and Indian monsoon during the mid-Holocene, Clim. Dynam., 25, 777–800, 2005. a
Zheng, Z., Chen, C., Huang, K., Zhang, X., Kershaw, P., Cheng, J., Li, J., Yue, Y., Wan, Q., Zhang, Y., Tang, Y., Wang, M., Xiao, X., and Cheddadi, R.: Holocene warming and evergreen/deciduous forest replacement across eastern China, Quaternary Sci. Rev., 307, 108057, https://doi.org/10.1016/j.quascirev.2023.108057, 2023. a
Zhou, X., Zhan, T., Tu, L., Smol, J. P., Jiang, S., Liu, X., Xu, C., and Guo, Z.: Monthly insolation linked to the time-transgressive nature of the Holocene East Asian monsoon precipitation maximum, Geology, 50, 331–335, 2022. a, b, c, d, e
- Abstract
- Introduction
- Methodology
- Precession shifts the season and latitude of perihelion
- Perihelion promotes tropical convective precipitation over land
- Seasonal terrestrial precipitation peaks whenever and wherever perihelion occurs
- Evidence from geologic records
- Discussion and conclusions
- Data availability
- Author contributions
- Competing interests
- Disclaimer
- Acknowledgements
- Financial support
- Review statement
- References
- Supplement
For 1 century, the hemispheric summer insolation is proposed as a key pacemaker of astronomical climate change. However, an increasing number of geologic records reveal that the low-latitude hydrological cycle shows asynchronous precessional evolutions that are very often out of phase with the summer insolation. Here, we propose that the astronomically driven low-latitude hydrological cycle is not paced by summer insolation but by shifting perihelion.
For 1 century, the hemispheric summer insolation is proposed as a key pacemaker of astronomical...
- Abstract
- Introduction
- Methodology
- Precession shifts the season and latitude of perihelion
- Perihelion promotes tropical convective precipitation over land
- Seasonal terrestrial precipitation peaks whenever and wherever perihelion occurs
- Evidence from geologic records
- Discussion and conclusions
- Data availability
- Author contributions
- Competing interests
- Disclaimer
- Acknowledgements
- Financial support
- Review statement
- References
- Supplement