the Creative Commons Attribution 4.0 License.
the Creative Commons Attribution 4.0 License.
Diagnosing the controls on desert dust emissions through the Phanerozoic
Yixuan Xie
Daniel J. Lunt
Paul J. Valdes
Desert dust is a key component of the climate system, as it influences Earth's radiative balance and biogeochemical cycles. It is also influenced by multiple aspects of the climate system, such as surface winds, vegetation cover, and surface moisture. As such, geological records of dust deposition or dust sources are important palaeoclimate indicators; for example, dust records can be used to decipher aridity changes over time. However, there are no comprehensive records of global dust variations on tectonic timescales (tens of millions of years). Furthermore, although some modelling studies have focused on particular time periods of Earth's history, there has also been very little modelling work on these long timescales. In this study, we establish for the first time a continuous model-derived time series of global dust emissions over the whole Phanerozoic (the last 540 million years). We develop and tune a new offline dust emission model, DUSTY1.0, driven by the climate model HadCM3L. Our results quantitatively reveal substantial fluctuations in dust emissions over the Phanerozoic, with high emissions in the late Permian to Early Jurassic (× 4 pre-industrial levels) and low emissions in the Devonian–Carboniferous (× 0.1 pre-industrial levels). We diagnose the relative contributions from the various factors driving dust emissions and identify that the non-vegetated area plays a dominant role in dust emissions. The mechanisms of palaeohydrological variations, specifically the variations in low-precipitation-induced aridity, which primarily control the non-vegetated area, are then diagnosed. Our results show that palaeogeography is the ultimate dominating forcing, with dust emission variations explained by indices reflecting the land-to-sea distance of tropical and subtropical latitudes, whereas CO2 plays a marginal role. We evaluate our simulations by comparing them with sediment records and find reasonable agreement. This study contributes a quantified and continuous dust emission reconstruction and an understanding of the mechanisms driving palaeohydroclimate and dust changes over Earth's Phanerozoic history.
- Article
(12465 KB) - Full-text XML
- BibTeX
- EndNote
Dust plays a pivotal role in the Earth system. Dust affects the climate system in various ways. Dust modulates the Earth's radiation budget directly by scattering, absorbing, and re-emitting radiation but also indirectly regulates the Earth's radiation balance by stimulating cloud and precipitation formation processes (e.g. Schepanski, 2018). In addition, the deposition of dust onto the Earth's surface provides nutrients such as nitrogen, sulfur, iron, and phosphorus, which affect the corresponding ecosystems and, ultimately, the global carbon cycle (Mahowald et al., 2017). For example, dust is the dominant external source of iron to the ocean, and the supply of iron is a limiting factor on marine life in large parts of the ocean and therefore influences the ability of the ocean to regulate atmospheric CO2 (Jickells et al., 2005).
On the other hand, the climate system regulates dust processes in various ways. Rainfall, evapotranspiration, vegetation, and the associated vegetation cover have an effect on sediment availability (Marx et al., 2018). Soil moisture, sediment particle characteristics, snow cover, and surface wind jointly control the dust entrainment (Kok et al., 2012). In addition, shifts in wind regimes, such as the position of synoptic-scale circulation systems, and changes in clouds and precipitation in smaller-scale zones influence the transportation and deposition of dust (Marx et al., 2018).
The estimated global annual dust emission flux is about 2000 Mt, originating from the world's major deserts located in Africa, China and Mongolia, Australia, central and southwestern Asia, and the United States (Shao, 2001). The majority of the contemporary dust source regions are located in subtropical regions, which are associated with the position of the Hadley circulation. Less rainfall is produced in extratropical latitudes by the Hadley cell descending branch than by its tropical ascending branch as a result of the meridional heat and energy transportation (Diaz and Bradley, 2004; Nguyen et al., 2013), hence leading to the broadly distributed subtropical aridity. In addition, the contribution of dust emissions from high-latitude paraglacial dust source regions is well constrained, accounting for about 5 % of the overall dust budget (Bullard et al., 2016).
Because arid areas are in general associated with relatively high dust emissions, geological records of changes in dust emissions in Earth's past serve as a reliable archive for environmental and climate variations in aridity. In addition, past climates provide a natural laboratory for modelling studies which aim to explore controls on dust emissions.
Existing records of past dust emission/deposition show high variability through time. Reconstructions are most abundant in the Quaternary (the last 2.6 million years), and many of them indicate substantial glacial–interglacial variability: the Earth becomes dustier during glacial periods than interglacial periods (e.g. Lamy et al., 2014; Fitzsimmons et al., 2013; and records compiled in Muhs, 2013, and Kohfeld and Harrison, 2001). Studies have indicated that the more substantial glacial dust deposits could be attributed to increased wind intensities, a less vigorous hydrological cycle, decreased soil moisture, decreased vegetation cover, and exposed continental shelves (Winckler et al., 2008; Muhs, 2013), all of which are ultimately caused by variations in the Earth's orbital parameters. Some studies highlight the importance of glaciogenic dust as a significant sediment source due to glacial grinding (e.g. Mahowald et al., 2006; Sugden et al., 2009), which contributes to the formation of widespread loess deposits in the Quaternary (Li et al., 2020).
Similar orbital-driven dust (or aridity) records are also identified much further back in time, such as during the Late Cretaceous (Niedermeyer et al., 2010; Vallé et al., 2017; Zhang et al., 2019) and the late Paleozoic (Soreghan et al., 2008). Moreover, the variability in dust (or aridity) on timescales older than the Quaternary is explained as responses to regional or global cooling (DeCelles et al., 2007; Bosboom et al., 2014; Licht et al., 2016; Zhang et al., 2016), atmospheric CO2 concentration variations (Wang et al., 2023), tectonic movements (Rea et al., 1998; Licht et al., 2016; Farnsworth et al., 2019; Zhu et al., 2020; Anderson et al., 2020; Yang et al., 2021; Lin et al., 2024), the absence of land vegetation (Liu et al., 2020), and intensified glaciation (McGlannan et al., 2022; Gabbott et al., 2010). However, these existing records and modelling studies have a relatively small scope, either spatially (only for a specific region), temporally (only for a specific time period or a couple of time slices), or both, and there is also a lack of geological records of global dust variations through time. As such, our knowledge of the dust (or aridity) distributions and variations and of the underlying driving forces in the Earth's deep time still remains insufficiently understood.
The aim of this study is therefore to investigate the following: (1) how do the global dust emissions change through the Phanerozoic, and (2) what are the causes and mechanisms of these changes? In order to do this, we develop a new offline dust emission model, DUSTY1.0, which is then driven by the output from a set of 109 general circulation model (GCM) simulations covering the whole Phanerozoic (last 540 million years).
The DUSTY1.0 model and the underlying GCM and GCM simulations are described in Sect. 2. The DUSTY1.0 model is tuned to improve its simulations of the modern, described in Sect. 3. The palaeo-dust emission simulations covering the whole Phanerozoic are then carried out with the tuned DUSTY1.0 model. Results are shown in Sect. 4, plus analyses of the contributing factors and the driving force of the Phanerozoic dust emission variations. The credibility of our simulated dust emissions is evaluated with a comparison to geological records, with discussions of the implications and limitations of this study in Sect. 5.
The following section describes the dust emission model “DUSTY1.0” developed for this study, the GCM that is used to drive the DUSTY1.0 model, and the simulations that have been carried out with the GCM.
2.1 The dust emission model “DUSTY1.0”
The DUSTY1.0 model developed for this study is an offline model. It is designed to be driven by dust-relevant meteorological variables at a relatively high temporal frequency (for our study, every 1 h), either the output from a GCM or observations, in order to calculate dust emissions for a particular climate scenario. Applying an offline dust model can make the dust simulation more efficient than using a coupled dust scheme within a GCM, allowing multiple sensitivity studies to be carried out without having to run the GCM multiple times. Also, for this study, due to the fact that we are simulating multiple time periods, we focus only on dust emissions rather than transport and deposition, in order to save computational cost. The dust emission model is designed to match the same spatial and temporal resolution of its driving input.
The following dust-relevant fields are used to drive the DUSTY1.0 model: the land–sea distribution (l; equal to 0 or 1), the bare soil fraction of the land surface (b; varying from 0 to 1, non-vegetated area hereafter), the soil moisture (m; units (kg m−2)), the snow cover (s; units (kg m−2)), and the near-surface (10 m height) wind velocity (u and v; zonal and meridional respectively, both units (m s−1)). The spatial resolution of the dust model for this study is 96×73 grid points, which is 3.75°×2.5° in longitude and latitude respectively, corresponding to the driving climate model (see Sect. 2.2).
The choice of the variables mentioned above is similar to other dust models. Vegetation and snow cover are commonly considered to inhibit dust emission from land surfaces and are generally represented in dust models with empirical globally uniform threshold values or as a linear function with no threshold (Ginoux et al., 2001; Miller et al., 2006; Kok et al., 2014). The formulation in our dust emission model assigns a linear function and a threshold for both (bt and st respectively), where the value is defined by further tuning process (Eqs. 3 and 5 below). Soil moisture is widely considered to suppress dust entrainment. Here we represent this with a simplified threshold-based (mt) linear formulation (Eq. 4 below), instead of considering it as a factor of threshold friction velocity of soil particles as in previous dust schemes (Pérez et al., 2011; Ginoux et al., 2001). As shown by many studies (e.g. Bagnold, 1941; Gillette and Stockton, 1989; Shao et al., 1993), dust emissions can be expressed in terms of surface wind speed above a threshold (Ut1), and the dust emission flux is approximately proportional to the third power of the wind speed. Our dust emission model adapts the formulation developed by Gillette and Passi (1988), which is also widely used in dust models such as Tegen and Fung (1994), Ginoux et al. (2001), Kerkweg et al. (2006), Miller et al. (2006), and Chen et al. (2017). We also add a maximum threshold (Ut2) for dust emissions to avoid spuriously large emissions when the surface wind speed is extremely strong (Eq. 6). There are some factors omitted in this dust emission model compared to some existing dust schemes: the effect of particle size, their soil characteristics, and mineralogical features that are believed to be factors for friction velocity of dust entrainment are not included in our dust emission model due to the absence of information on these aspects on the timescales we are addressing here. In addition, “preferential source areas” (Zender et al., 2003; Cakmur et al., 2006), which are constrained by the surface topography as “hydrological basins”, and the sediment availability related to the glacial grinding process (Prospero et al., 2002; Mahowald et al., 2006), are not considered in this dust emission model for the same reasons. As such, our model is only supposed to be able to test the hypothesis of dust emissions related to hydroclimate processes rather than the sediment supply hypothesis.
The total dust emission index, d (no units) of each grid box, is the product of each individually ascribed emission index (Eq. 1). are corresponding emission indices associated solely with the land–sea distribution, the non-vegetated area, the soil moisture, the snow, and the near-surface wind, as calculated in Eqs. (2) to (6) respectively.
Specifically, the land–sea distribution gives the basis for subsequent calculations, as all the dust emissions are only considered over land areas. The calculation of consequent dust emissions related to bare soil, soil moisture, and snow cover are all threshold-based linear relational expressions. The corresponding index for dust emissions induced by surface winds is calculated as a cubic relationship with two thresholds.
A coefficient C2 is used here to calibrate the total dust emission for the specific grid box, D (Eq. 7), and to convert to units of kg m2 s−1. A globally averaged emission rate of is used (see details in Sect. 3.1) to derive the coefficient C2. This coefficient and the following coefficients introduced in the next paragraph are all calculated at a global mean level.
In addition, the dust emission model also produces dust emissions with various combinations of those dust-relevant fields, either included or not included. Using the same naming convention as in Eq. (7), the emissions calculated are Dl, Dlb, Dlbm, Dlbms, DlbU, DlbmU, and DlbsU, as given in Eq. (8). Similarly to C2, different coefficients (C1, C3, C4, C5) are used in order to scale the emissions with various process combinations. C1 is chosen such that the global dust emissions in Dlbms are equal to DlbmsU, and C3, C4, and C5 are chosen such that the global dust emissions in DlbU, DlbmU, and DlbsU are equal to Dlbms.
2.2 The GCM
For this study, the DUSTY1.0 model is driven by simulations carried out with a general circulation model (GCM), HadCM3BL-MOSES2.1a-TRIFFID (HadCM3BL-M2.1aD in the naming convention of Valdes et al. (2017), henceforth HadCM3L). This is a coupled atmosphere–ocean–vegetation model. The atmospheric component of HadCM3L solves the primitive equation set of White and Bromley (1995) through the Arakawa staggered B-grid scheme from Arakawa and Lamb (1977). Parameterisations include the convection scheme of Gregory et al. (1997), the large-scale precipitation scheme of Wilson (1998), the radiation scheme of Edwards and Slingo (1996), and the cloud scheme of Bushell (1998). The ocean component is based on the model of Cox (1984), which is a three-dimensional ocean model. Parameterisations include the ocean mixed layer schemes of Turner and Kraus (1967). Modifications to the ocean vertical diffusion and isopycnal diffusion due to the model's lower resolution are described in detail in Valdes et al. (2017). There are also modifications in the bathymetry of the North Atlantic, which improves the reality of heat transports in the coupled system and alleviates the need for flux correction and makes the model more appropriate for palaeo-simulations.
The land surface scheme MOSES2.1 calculates the energy and moisture between the land surface and the atmosphere and updates the relevant surface and subsurface variables (Cox et al., 1999). It is coupled with an interactive vegetation model, TRIFFID, via nine land cover types: broadleaf trees, needleleaf trees, shrubs, C3 grasses, C4 grasses, urban, inland water, bare soil, and land ice. TRIFFID takes the averaged flux of carbon from MOSES2.1, calculates the growth and expansion of five defined plant functional types, and updates the vegetation fractions and parameters through competitive, hierarchical formulation. We do not change this representation of vegetation, even though grasses did not become dominant until after the end of the Cretaceous and C4 vegetation did not become dominant until much later. Our assumption is that other forms of ground cover vegetation were present in these older time periods and impacted climate in similar ways.
HadCM3L has a horizontal resolution of 96×73 grid points in both the atmosphere and the ocean, which is 3.75°×2.5° in longitude and latitude, and 19 hybrid vertical levels in the atmosphere and 20 vertical levels in the ocean with finer definition closer to the surface. It is of relatively lower resolution compared to recent state-of-the-art CMIP6 models; therefore, it is particularly computationally efficient and applicable for multi-million-year-scale simulations. The model has been used widely in pre-Quaternary climate modelling studies (e.g. Marzocchi et al., 2015; Wade et al., 2019; Jones et al., 2022).
Since Valdes et al. (2017), the model has undergone several improvements, the most significant of these being a tuning process designed in particular to improve the deep-time climate simulations. The changes made follow those described in Sagoo et al. (2013) and Kiehl and Shields (2013), primarily targeting parameters associated with clouds; this results in a flatter meridional temperature gradient in warm climates, which is in better agreement with palaeoclimate proxies. In addition, we have added a new representation of soil albedo. In the original model configuration, soil was specified as a medium loam everywhere. We have now added a soil carbon dependence. Medium loam soils (soil carbon >15 kg m−2) maintain a constant albedo of 0.122. If the soil carbon content drops below 15 kg m−2, the albedo increases to a maximum of 0.355 following a quadratic relationship, while low-carbon soils (soil carbon <1.1 kg m−2) have a constant albedo of 0.355.
2.3 The GCM simulations
This study uses three series of 109 experiments each, S1, S1noCO2, and S2, all carried out with HadCM3L, corresponding to roughly 109 geological stages covering the whole Phanerozoic (the last 541 million years). Similar simulations are described in Valdes et al. (2021). However, the Valdes et al. (2021) simulations do not include the tuning processes described in Sect. 2.2. Series S2 does include those tuning processes but is otherwise identical to series S1. The boundary conditions to drive the S1 and S2 simulations include (1) solar constant following Gough (1981), (2) atmospheric CO2 concentrations following Foster et al. (2017), and (3) palaeogeography (the configuration and height/depth of the continents and oceans) following Scotese and Wright (2018). The boundary conditions used to drive S1noCO2 are identical to those described above in terms of solar constants and palaeogeography but with a fixed atmospheric CO2 concentration at pre-industrial levels (276.01 ppm). These simulations have been run for an additional 3000 years beyond those described in Valdes et al. (2021). To conduct this dust study, each of the 109 experiments is also run for an additional 30 years with the dust-relevant variables () output at an hourly resolution.
The “0 Ma simulation” (the latest of the 109 simulations, corresponding to the pre-industrial configuration) is designed to be consistent with the rest of the palaeo-simulations in terms of most of the boundary conditions, for example, having homogeneous soil properties. As such, it is not the most accurate possible simulation of the pre-industrial climate. In order to tune the dust model with the pre-industrial scenario, we therefore also carry out another “standard pre-industrial simulation” with HadCM3L, which has more realistic pre-industrial boundary conditions. The main differences between them are as follows: (1) the vegetation in the standard pre-industrial simulation is from observations, whereas the vegetation in the 0 Ma simulation is calculated by the coupled vegetation scheme; (2) the topography of the standard pre-industrial simulation is from observation, whereas the topography of the 0 Ma simulation is from the Scotese (2016) reconstructions; and (3) the surface variables, primarily soil properties, are globally homogeneous in the 0 Ma simulation but are spatially varied based on observations in the standard pre-industrial simulation.
Given that there are uncertainties in the “correct” values of the thresholds bt, mt, st, Ut1, and Ut2 and the coefficients C1, C2, etc., it is necessary to design a tuning process to identify the values that give the most realistic results for D. The assumption is that the tuning is carried out for the pre-industrial simulation, and the same tuned variables are assumed to be appropriate for all the palaeo-simulations.
3.1 Methods of tuning
In order to calibrate the dust model, a target needs to be selected as a benchmark. Theoretically, the target that the model is tuned to should be based on observations. In practice, the parameters commonly provided by modern dust observations are dust optical depth or aerosol optical depth (e.g. Gkikas et al., 2021), which are properties primarily influenced by the suspended dust particles in the atmosphere, whereas our dust model only predicts the surface emissions. Therefore, we use simulated modern dust emissions from other (more complex) coupled climate–dust models as the tuning target. Here we use the multi-model mean of 15 CMIP6 AMIP models (hereafter 15_MMM; Fig. 1a), which is the dust emission over the period 2005–2014. In the absence of dust emissions from observations, this is justified partly by the complexity and resolution of CMIP6 models being higher than HadCM3L, which are therefore expected to predict more accurate dust emissions than the dust model in this study, and partly because the mean of several models in general has a lower bias than the output of a single model and therefore represents a valid tuning target. The dust particle size range varies among the 15 models, with the smallest size bin with a diameter of 0.064–0.2 μ (HadGEM3-GC31-LL) and the largest with a diameter of 20–63 μ (HadGEM3-GC31-LL and UKESM1-0-LL) (Zhao et al., 2022). This also limits the range of particle sizes that DUSTY1.0 can effectively cover. The global average dust emission rate given by the 15_MMM is , which is used to calculate the C2 in Eq. (7) in each tuning experiment, so that the standard pre-industrial dust simulation has an identical global mean dust emission rate as the target. Every global mean value is calculated over all the grid boxes rather than over all the land grids to avoid confusion arising from variations in the total land area over time.

Figure 1The pre-industrial dust emission fields for (a) 15_MMM, averaged from the 15 CMIP6 AMIP models and used in this study as the tuning target, and (b) the pre-industrial configuration, simulated from the tuned DUSTY1.0 model (plot from model version one; see details about model versions in Sect. 3.2 and Table 1). Both values on the top right are the global mean dust emission rates.
In addition to scaling the global average dust emission rate to the target, the main aim of the model tuning process is to find the optimum choices of the threshold values of the dust model that give the best fit to the spatial pattern of the target. When evaluating the model, it is necessary to use a cost function to quantitatively measure the difference between the simulations and the target. The metric chosen here is the arcsine Mielke score (AMS; Watterson et al., 2014). For a modelled dust field D and an observed dust field T, the AMS is defined as
where mse is the mean squared error between T and D, VD and VT are the spatial variances of D and T respectively, and GD and GT are the spatial means of D and T respectively. The AMS has a maximum possible value of 1000, where the modelled result is identical to the target.
To perform the tuning, a Latin hypercube sampling (LHS; Mckay et al., 1979) method is used. LHS is a stratified random procedure which provides an efficient way of sampling variables. In this study, the number of samples, which is also the number of tested model versions, is 200. This decision is a trade-off between having as many samples as possible and the cost of computing time. The five-dimensional parameter space, where the 200 samples are taken from, is constrained by the range of bt, mt, st, Ut1, and Ut2. We take a two-step approach here. Firstly, the initial range for each threshold is derived from the variable's distribution in the standard pre-industrial GCM simulation or based on previous studies. Specifically, the bare soil values of the preindustrial simulations vary from 0 to 1, so the initial test range is set to be the [0.0–1.0]. The soil moisture at the southern edge of the Sahara area, where modern dust emissions are relatively low, is around 20.0 to 24.0 (kg m−2), so the initial test range is set at a slightly wider range of 18 to 28 (kg m−2). For snow cover, Lunt and Valdes (2002) apply a snow cover threshold in their dust model of 20.0 kg m−2; as such, the initial test range of 15.0 to 25.0 (kg m−2) is chosen to encompass that value. The global minimum wind speed is around 0.8 m s−1, and the maximum wind speed over land does not exceed 6.0 m s−1; as such, a reasonable initial test range is set as 0.8 to 4.0 (m s−1) for Ut1 and 4.0 to 6.0 (m s−1) for Ut2. Secondly, starting from the initial test ranges described above, further adjusting (expanding, shrinking, or shifting) to the test range has been carried out in an iterative process, with the aim of identifying appropriate ranges for the 200 sampled experiments. The final ranges applied are 0.2 to 0.34 for bare soil, 16.0 to 30.0 (kg m−2) for soil moisture, 14.0 to 50.0 (kg m−2) for snow cover, 0.2 to 2.0 (m s−1) for Ut1, and 2.0 to 5.5 (m s−1) for Ut2, as shown in Fig. 2.
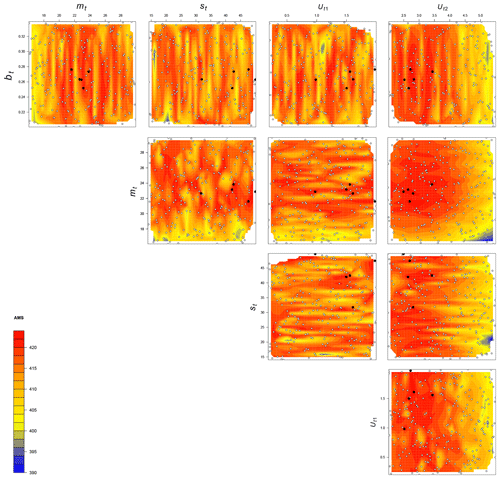
Figure 2The performance of 200 dust emission model versions with different thresholds, measured by their AMS, compared to the tuning target. The ranges for each threshold shown in this figure are all final ranges, Each panel has 200 dots representing all the samples taken within the corresponding ranges, where the five solid dots are the top-ranked ones.
3.2 Tuning results
The results of the tuning exercise are shown in Fig. 2. As a post hoc justification of the parameter ranges identified in Sect. 3.1, the results of the tuning show that the relatively high AMS values (i.e. the best-fitting parameters) are not situated close to the edges of the ranges.
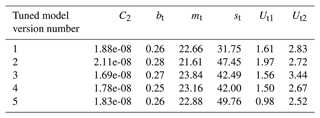
We select the dust emission model versions with the top five AMS results from the tuning exercise (as shown in black dots in Fig. 2). The corresponding thresholds and coefficients are listed in Table 1. The tuned standard pre-industrial dust emission simulation (simulated from tuned parameter set version 1; all maps shown hereafter are results from model version 1 as a representative) is shown in Fig. 1b. The tuned simulation generally captures the spatial pattern of global dust emission regions as defined by the 15_MMM, with northern Africa and central Australia predominating, followed by central Eurasia and minor regions in South Africa. There are also many discrepancies that exist between the tuned simulation and the target; for example, the high-emission hot spots in the eastern Sahara and central Eurasia (Fig. 1a) are not found in the stunned simulation (Fig. 1b), while the tuned simulation gives higher emissions in the broad Australia desert area. This discrepancy is largely due to the absence of detailed morphology and particle size representation in our models. These factors are crucial for capturing small-scale areas with frequent dust activation. Because we force the DUSTY1.0 model to match the global mean emission rate of the target, the average emission in each sub-area is enhanced in the absence of hot spots, which leads to overestimation in regions like Australia and the western Sahara.
This section presents the palaeo-application of the dust model, including the simulated dust emissions over the Phanerozoic (Sect. 4.1), analysis of the contributions from the factors (Sect. 4.2), and the evolution of aridity in response to palaeogeography (Sect. 4.3).
4.1 Dust emissions over the Phanerozoic
The five tuned versions of the dust emission model in Sect. 3.2 are applied to all 109 simulations from series S2 (see details in Sect. 2.3) through the Phanerozoic (since 540 Ma). Here we show the simulated global averaged dust emission rate time series in Fig. 3 and the simulated dust emission fields for five example time slices (0, 196, 252, 370, and 530 Ma) in Fig. 4 (the dust emission field for all 109 experiments can be found in the Appendix in Figs. A2–A5). Most notably, the dust emissions are significantly high during the period over the late Permian to the Early Jurassic (263 to 191 Ma), where there are two peaks, one covering the Permian–Triassic transition (252 Ma) at the emission rate of and the other spanning the Middle Triassic to the Early Jurassic (196 Ma) at the emission rate of . The emission rates for both peaks are more than 4 times the pre-industrial level ( ). The dust provenance areas for both peaks are concentrated in the central supercontinent, covering the mid-latitudes, the subtropics, and the tropics, as illustrated in Fig. 4b and c. The global dust emission rate reaches its lowest in the Devonian–Carboniferous transition (366 Ma) at the level of , which is almost 10 times less than the pre-industrial level. Dust provenance areas are scattered throughout the mid-latitudes in both hemispheres (Fig. 4d) at that time. In the early Cambrian (541 to 535 Ma), the oldest simulation we carry out, dust emission rates ( ) are close to the pre-industrial level, and the dust source regions are centred in the mid-latitudes of both hemispheres (Fig. 4e). Evaluations of the simulated dust emission in comparison to geological records will be discussed in Sect. 5.1. Similarly to the discrepancy mentioned in Sect. 3.2, our palaeo-simulations may not be able to represent high-emission hot spots and, alternatively, may overestimate emission rates in desert areas that are broadly distributed but have low emission rates. Further uncertainties arising from the GCM simulating vegetation in the absence of land plants during the early Paleozoic will be discussed in Sect. 5.2.
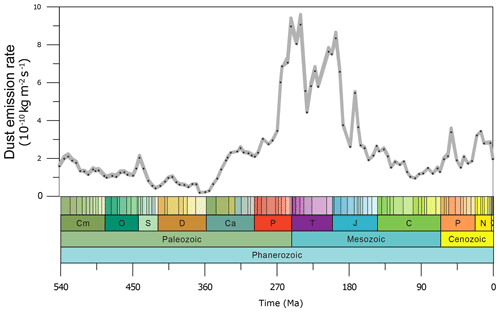
Figure 3Time series of the simulated global average dust emission rate over the Phanerozoic. The grey shading (not a curve) in the figure is a stack of the results from those five top-ranked model versions, and the dots on it represent the results of model version one to hint at the time intervals between simulations of different time slices.
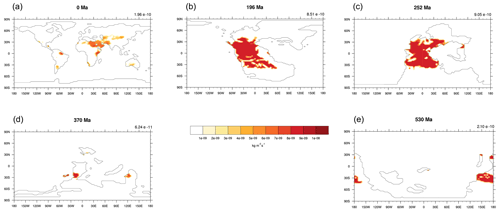
Figure 4A few examples of the simulated dust emissions. The examples are for (a) the present day (0 Ma), (b) the Early Jurassic (196 Ma), (c) the Early Triassic (252 Ma), (d) the Late Devonian (370 Ma), and (e) the early Cambrian (530 Ma). Values on the top right of each panel are the corresponding global mean dust emission rate. All units are .
4.2 Contributing factors to the dust emissions
The simulated dust emissions described in Sect. 4.1 show substantial fluctuations over the Phanerozoic. In order to understand the causes of the fluctuations, we use a factorisation approach to analyse and quantify the relative importance of each variable (the land–sea distribution l, the non-vegetated area b, the soil moisture m, the snow cover s, and the near-surface wind U, all introduced in Sect. 2.1) that is used to drive the dust emission model.
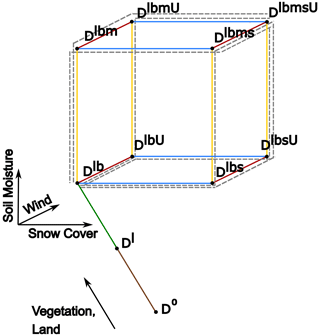
The factorisation is carried out in a two-step approach, where the analysis of l and b is performed as a linear factorisation, whereas the analysis of m, s, and U is performed based on the “linear sum” factorisation method according to Lunt et al. (2021), which is suitable for diagnosing a multi-variate system. We understand the whole system from a starting point in which there are no dust emissions anywhere on the globe, D0. We then add the factors l and b sequentially, to produce Dl and Dlb respectively (the linear factorisation). We then carry out an unordered addition of the three remaining factors, m, s, and U, producing Dlbm, Dlbs, DlbU, Dlbms, DlbmU, DlbsU, and DlbmsU (see Sect. 2.1 for the naming convention). Details of the factorisation are described in the Appendix, with the factorisation concept illustrated in Fig. A1. The contributions of each factor are quantified for the land–sea distribution, vegetation, soil moisture, snow cover, and wind as ΔDl for the land–sea distribution, ΔDb, ΔDm, ΔDs, and ΔDU respectively.
The factorisation is applied to all the time slices to quantify the contribution of each factor and how this varies over time, as illustrated in Fig. 5. The contribution from the land–sea distribution factor (ΔDl=Dl, brown line in Fig. 5a) results in dust emissions of about 3.5 kg m−2 over the early Phanerozoic, increasing to a maximum around 250 Ma and then decreasing to about 90 Ma before increasing slightly to the modern. What follows is the contribution from the non-vegetated area factor (ΔDb), which reduces the dust emissions remarkably over time. As expected, the non-vegetated area and land–sea distributions are very important, and the joint contribution from both l and b (ΔDlb) gives a more concrete reflection of this. It shows that they are 3 times the all-forcing dust emissions (DlbmsU). The addition of both m and s reduces the dust emission. The contribution from m (ΔDm) is approximately double the all-forcing dust emissions, whereas the contribution from s (ΔDs) is only 1 % of the all-forcing dust emissions. The addition of U alters dust emissions the most positively over time but also has adverse effects for a few time periods in the mid-Permian, Early Cretaceous, and late Paleogene. It contributes an average of 44 % of the all-forcing dust emissions before the Carboniferous and 27 % of the all-forcing dust emissions during the late Permian to the Early Jurassic.
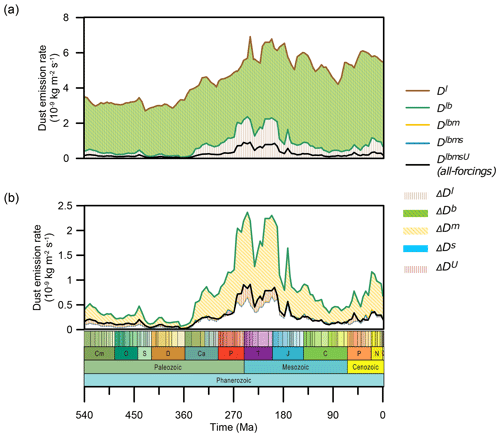
Figure 5The decomposed contribution of individual factors to the total dust emissions over the Phanerozoic. (a) Results for l and b. (b) Results for m, s, and U. Note that the ranges of y axes differ between panels (a) and (b). All curves refer to the joint dust emissions derived from the corresponding superscript variables, and the shadings refer to the dust emissions contributed from each specific superscript variable. (e.g. Dlb refers to the simulated dust emissions when only variables l and b are included in the DUSTY1.0 model, and ΔDm refers to the quantified contribution of dust emissions from the sole variable m).
The analysis above quantifies the magnitude of each factor to the total global dust emissions for each time slice individually. A complementary approach is to quantify the impact of each factor on the temporal variability in emissions throughout time, i.e. the extent to which the shape of the emission time series improves towards the all-forcing emission time series as the result of the inclusion of a specific variable. In order to evaluate this, for each combination of factors, we calculate the correlation coefficient of the resulting emission time series with the all-forcing emission time series. We then derive the contribution from the difference in these correlation coefficients, The greatest contribution to the temporal variability in emissions is made by l (66.53 %), followed by b (31.86 %), U (1.22 %), m (0.34 %), and finally s (0.05 %).
4.3 The palaeogeographical control on the desert area
As shown in Sect. 4.2, the combined land and non-vegetated area factors (Dlb) dominate the dust emission variations on geological timescales. Given that the non-vegetated area changes implicitly also include the land area changes (i.e. Db=Dlb), here we focus on the mechanisms for the changes in non-vegetated areas.
We measure the extent of aridity with an aridity index (AI) that is threshold-based and inversely proportional to the amount of precipitation:
where tarid is set as 0.8 mm d−1. This threshold is selected because sediments such as evaporite and weathered sandstone, which are indicators of arid environments, are formed under a limit of approximately 0.8 mm d−1 (Cecil, 2003; Warren, 2010; Price et al., 1995).
The non-vegetated fraction in the simulations is very closely controlled by the precipitation rate. In particular, the area of precipitation that is less than 0.8 mm d−1 (represented by the aridity index) shows a very strong positive linear relationship with the non-vegetated area (Fig. 6a and b; correlation coefficient = 0.98), and, as we have shown above, the non-vegetated fraction controls the total dust emissions. In addition to the global means, the zonal mean distribution of continental precipitation varies over time (Fig. 7c), as does the zonal mean aridity index (Fig. 7d). The aridity index shows a very similar pattern to the dust emissions (Fig. 7e). As such, the continental distribution, combined with the zonal mean precipitation (Fig. 7a and b), is sufficient to closely approximate the dust emissions (Fig. 7e).
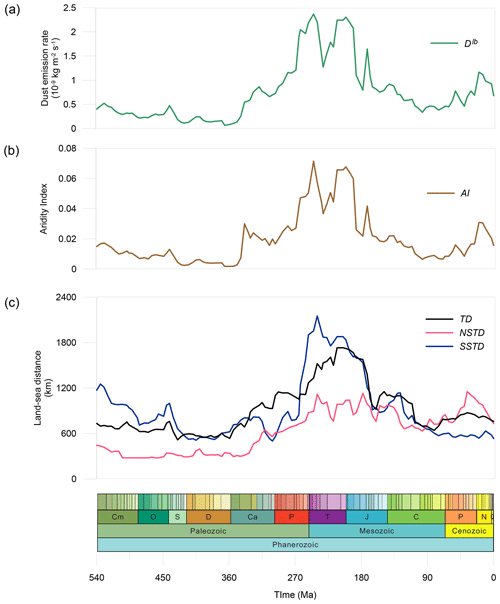
Figure 6Time series of (a) Dlb, which is the simulated global average dust emissions jointly contributed from l and b; (b) the AI (aridity index), which reflects the lowness of precipitation; and (c) the land–sea distance indices, in which TD refers to the tropics and NSTD and SSTD corresponds to the subtropics of the Northern and Southern hemispheres respectively.
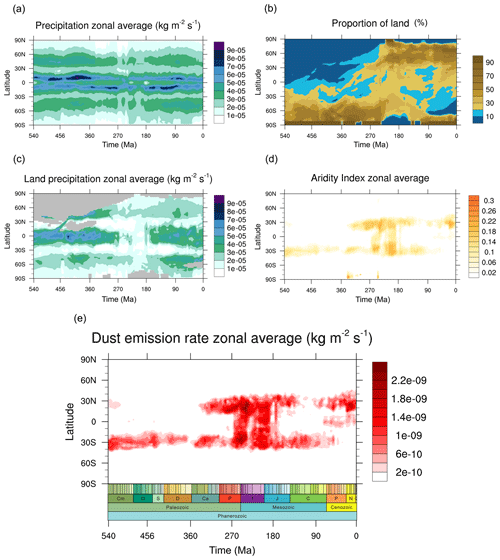
Figure 7The zonal means of (a) the simulated precipitation, (b) the proportion of land, (c) the simulated precipitation over land, (d) the aridity index, and (e) the simulated dust emissions over the Phanerozoic.
The challenge then becomes to understand the controls on zonal mean precipitation (Fig. 7a). There are three boundary conditions that are changing over time which must ultimately control the precipitation changes, namely CO2, solar constant, and palaeogeography. Firstly, in order to explore the impact of CO2 change, here we take the results from an additional series of GCM simulations as a sensitivity test. A comparison of results from the S1 and S1noCO2 simulations (described in Sect. 2.3) reveals the negligible effect of CO2 concentration on the low-precipitation-area variation over time (Fig. 8b) and therefore on aridity (Fig. 8a). Hence, we conclude that, on these timescales, CO2 is not a strong control of the aridity. Furthermore, the change in solar constant through the Phanerozoic is linear, whereas the change in dust emissions is highly non-linear. As such, we can attribute the mechanism of changes in precipitation, aridity, and ultimately dust emissions to the only remaining boundary condition change, namely palaeogeography.
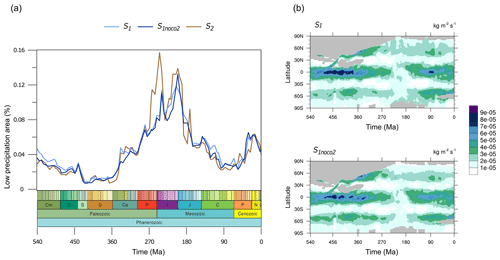
Figure 8(a) Comparison of the low-precipitation-area fraction time series from three different experimental series: S1, S1noco2, and S2. A daily mean precipitation of less than 0.8 mm is considered low precipitation. (b) Comparison of zonal mean land precipitation over the Phanerozoic between experimental series S1 and S1noco2.
In general, it may be expected that regions in the continental interiors are more arid due to being remote to oceanic moisture sources. Here we develop indices measuring the distance of the shortest pathway from land to ocean. The distance indices are calculated in the tropical zone (23.5° N to 23.5° S; TD), the subtropical zones are calculated in the Northern Hemisphere (35 to 23.5° N; NSTD), and the subtropical zones are calculated in the Southern Hemisphere (23.5 to 35° S; SSTD), as shown in Fig. 6c. During the period prior to the Carboniferous, the global aridity (Fig. 6b) shows a remarkably similar temporal evolution to the TD and SSTD, which drop remarkably in the Silurian and Devonian. Since the Carboniferous, more continents shift to the tropics and the Northern Hemisphere, and the overall growth of global aridity is therefore driven by the combined effect of the TD and NSTD until the late Permian (excepting a short drop-down at the late Carboniferous when the SSTD exerts a control). The extreme aridity from the late Permian to the Late Triassic is controlled by all three land–sea distance indices, which is due to the fact that the supercontinent covers almost all latitudes during the corresponding times. The extreme aridity can be divided into two peaks during this period. The first aridity extreme at the Permian–Triassic boundary is mainly driven by the SSTD, and the second aridity extreme at the Late Triassic is mainly driven by the TD, while the NSTD contributes equally to both. The land–sea distance indices have decreased in all three latitude zones since the Early Jurassic due to continuous continent convergence, resulting in overall humidification until the Cretaceous–Paleocene boundary, where the decrease in the SSTD plays a relatively significant role. It is important to note that there are other factors contributing to this widespread aridity, which corresponds to the collapse of the tropical land humid zones as shown in Fig. 7c. With the latest improvement in vegetation albedo parameterisation in the GCM (see description in Sect. 2.2), the low vegetation coverage will trigger a positive feedback loop where higher surface albedo leads to lower net solar radiation and an increase in radiative cooling. This then suppresses convection and leads to the amplification and potential expansion of the dry conditions (Charney et al., 1977). From the Cenozoic onward, the continents have shifted further northward, resulting in the NSTD being the dominant control of the expanding aridity.
Overall, as the fundamental driving factor, palaeogeography controls the geological timescale aridity and thus the desert area variations over the Phanerozoic. The desert dust is consistently found in subtropical land areas of either hemisphere over time and also in the tropical during supercontinent times. These can mainly be explained by variations in the land-to-sea distance. To some extent, the higher albedo over sparsely vegetated areas further amplifies the spreading of aridity into the tropics during supercontinent times.
5.1 Credibility of the simulated Phanerozoic dust
We herein compare evidence from both sediments and modelling to evaluate the simulated Phanerozoic dust emissions.
The evaporite sediment indicator compilation from Boucot et al. (2013) is used here to assess our simulation. This model–data comparison approach is indirect because evaporite is not a proxy for dust emission; however, it is chosen due to the absence of an appropriate proxy for dust emission, especially in deep-time palaeo-contexts. As a compromise, we compare the evaporite sediment records to the HadCM3L-simulated evaporite, effectively evaluating the performance of the GCM in simulating the palaeohydrological cycles. The GCM predicts evaporation using the following criteria: mean annual precipitation less than 1400 mm, no more than 3 months with precipitation greater than 40 mm, and 6 months or more with mean temperature exceeding 20 °C (Craggs et al., 2012, scheme A). Similar evaporite prediction schemes are also used in Price et al. (1995) and Bao et al. (2023), although they use different criteria. This model–data comparison also serves as a side evaluation of the DUSTY1.0 model because the results from this study indicate that the dust emission is primarily dominated by the aridity (i.e. hydrological cycles) over the Phanerozoic (Sect. 4.3).
How well the model matches with data is evaluated by how well the evaporite data in the compilation agree with estimates of potential evaporite distribution derived from the HadCM3L simulations. Evaporite data points from Boucot et al. (2013) are rotated back to their palaeo-coordinates. We do not include data points that are outside the land mask in our palaeogeography configuration because the formation mechanism of those evaporites found on the coastline and continental shelf is mainly related to the marine incursion and thus does not represent an arid palaeoenvironment.
The performance of the model, indicated by the overlay ratio of evaporite data points on the model-predicted evaporite areas, varies over time. On average, 35.3 % of the evaporite data points are correctly predicted by the HadCM3L model over the Phanerozoic. To put this agreement in content, we also derive a “zero-skill model”, in which the fixed evaporite simulations for 0 Ma are applied for all palaeo-time slices, constraining the lowest performance limit from a random model prediction. The zero-skill model achieves an average agreement of 4.6 %, significantly lower than the HadCM3L model's performance, indicating the adequate accuracy of the model used in this study (Fig. 9e). Notably, the simulated widespread tropical drought during the late Permian to Early Jurassic, which leads to widely distributed potential evaporites, corresponds fairly well with the geological sedimentary evidence (Fig. 9a and b), with an averaged overlay ratio of 67.7 %.
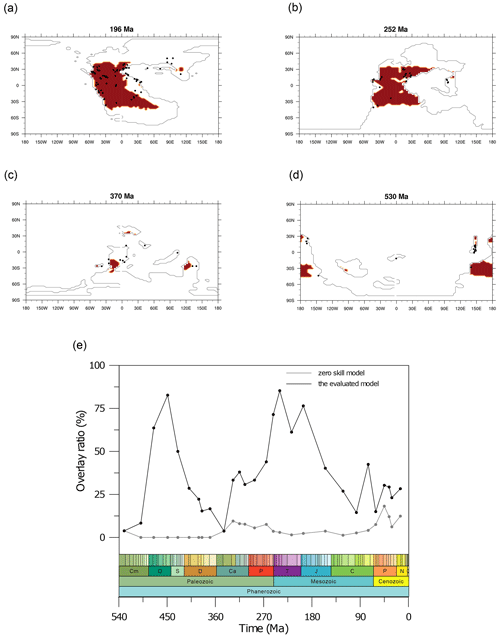
Figure 9Comparisons of evaporite sedimentary records (dark dots; data from Boucot et al., 2013) to the simulated evaporite (area in red) of a few example time slices: (a) the Early Jurassic (196 Ma), (b) the Early Triassic (252 Ma), (c) the Late Devonian (370 Ma), (d) the early Cambrian (530 Ma), and (e) a time series representing the performance of the model derived by assessing the overlap between the model and data over time.
Here, we further focus on the Mesozoic to Cenozoic Asian desert dust and the Mesozoic Pangaean desert dust to evaluate the accuracy of our simulations.
Our results show that the Asian desert dust generated since the middle Jurassic (168 Ma) reached a maximum at the Late Jurassic–Early Cretaceous (145 Ma). During the Early Cretaceous (131–97 Ma), the Asian continent passed through a period without obvious desert dust. The dust provenance then became very broad in subtropical Asia from the late Eocene (36 Ma) to the present. As documented in previous studies, the extreme Asian aridity evidenced from formations in the Junggar Basin of the Late Jurassic–Early Cretaceous (Jolivet et al., 2017) is well simulated from our results. Results from previous modelling studies show that central and western Asia was generally dry at the end of the Late Cretaceous but was not identified as unvegetated dust provenance (Zhang et al., 2019). Our results constrain the arid dust emission region to the central and western subtropical belt, which is also accordant to the proxy evidence of aeolian dunes recorded in the earlier Late Cretaceous (Farnsworth et al., 2019; Hasegawa et al., 2012). The permanent aridification recorded in the present-day Xining Basin originated from the late Eocene to Oligocene (40 Ma) (Licht et al., 2016; Bosboom et al., 2014), our simulations show the dust provenance appears since 36 Ma, which is in good agreement.
The dust emissions during the late Permian to the Early Jurassic, as identified in this study, are remarkably high over the whole Phanerozoic. Our results suggest that the extensive dust emissions across the tropical and subtropical supercontinent specifically occurred from 265 to 190 Ma. Flora biome evidence and a general lack of plant fossil record (Nowak et al., 2020) support the massive desert environment which was distributed almost identically to our simulated dust provenance during the late Permian (256 Ma). Sediment records (Boucot et al., 2013) indicate similar massive aridity patterns to our simulations – the sediments reflecting wet and semi-arid environments in the central tropical land were not documented, while the sediments reflecting arid environments were abundantly found along the edges of tropical and subtropical land since the middle–late Permian (265 Ma) to the Middle Triassic (240 Ma) (Fig. 9), suggesting a massive extreme arid extension from subtropical to tropical during the corresponding times.
5.2 Implications and limitations
For the first time, our study presents the dust emission variations over the past 540 million years with the dust emission fields for each of the 109 corresponding time slices, which can serve as an archive in the fields of both dust simulations and palaeoclimate. Similar simulations focusing on deep-time dust variations have been performed by Lin et al. (2024) with a different GCM and vegetation scheme. Our results in general support their conclusion that subtropical land is the major controlling factor in the dust variations since the late Permian and extend this mechanism to the whole Phanerozoic using experiments with a higher temporal resolution. Further model–data comparison and model–model comparison can be carried out on this basis in the future to improve the understanding of deep-time dust variations and their mechanisms.
Some of the bias from our results may arise from details about the dust emission process that have to be omitted in this study. As mentioned in Sect. 2.1, the particle size and topography parameters are significant to the physical dust emission process but are not included here due to a lack of information.
Uncertainties in our simulated results could have been caused by the vegetation simulations in different ways. In this study, we assumed that plant functional types are consistent and the same as the modern over the whole Phanerozoic, so we applied the TRIFFID interactive vegetation model to all palaeo-time slices. This will theoretically result in inappropriate vegetation outputs, especially in the results from older periods. To constrain the uncertainty during the time before land plant colonisation, we carry out sensitive tests by running the DUSTY1.0 model with the assumption that all land areas are non-vegetated areas, except for those prescribed as ice sheets, prior to the end of Devonian (360 Ma) (Fig. 10). Sensitivity tests reveal that results shown in Sect. 4.1 underestimate the dust emissions over the early Paleozoic, with a factor of double underestimation at the Ordovician–Silurian transition emission peak and an underestimation of about 2 times at the Early Devonian emission peak, whereas, for most of the other early Paleozoic times, the level of underestimation is mostly within the range of 5 % to 30 %. The degree of underestimation is not as significant as the decomposed contributions from the non-vegetated area b derived in Sect. 4.2. This is because of the coupled variations between vegetation and soil moisture. Even with the assumption of no land vegetation, the simulated areas of desert dust are similarly constrained by the soil moisture. However, there is a bias in these estimations of uncertainty because the dynamic interactions between vegetation and climate are neglected, which possibly explains the discrepancy compared to the underestimation up to 4-fold in the Precambrian (Liu et al., 2020). A more accurate evaluation of underestimation could be done by running the GCM simulations without the TRIFFID scheme. Due to the matter of computational cost, this is not performed within this study. Moreover, the lack of vegetation would likely also result in a very different land surface during these times, which may also have a big impact on emission properties. Our simulations after the Devonian (360 Ma) are more robust than those prior to it, when terrestrial flora was more similar to today. While this constant vegetation scheme is the common approach of most current palaeoclimate modelling studies, the new trait-based whole-plant functional-strategy approach (Matthaeus et al., 2023) shows potential to be an alternative solution. The scope of this study has focused only on looking at the non-vegetated area rather than at a specific vegetation type, despite the unavoidable uncertainties coming with the vegetation scheme. We argue that the modelled dust and aridity are relatively robust, as any vegetation may have flourished where there was precipitation.
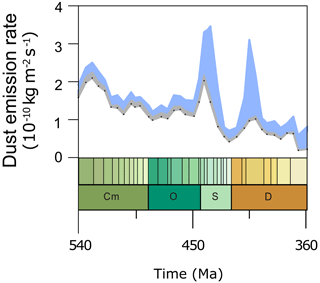
Figure 10The uncertainty of dust emission rates tested by assuming there is no land plant prior to the end of Devonian, as shown in blue shading. The grey shading is the simulated dust emissions identical to those illustrated in Fig. 3.
Another aspect of uncertainty caused by the vegetation scheme is related to the atmospheric CO2. The vegetation model TRIFFID predicts plant functional types by taking atmospheric CO2 in addition to temperature and precipitation from the GCM, and a higher CO2 will fertilise the vegetation. As such, we emphasise the uncertainties of our simulated dust emissions, presumably underestimations, for the periods before 420 Ma, when the CO2 forcings are derived from an “extension” of the Foster et al. (2017) data and appear very high (Valdes et al., 2020). The explicit effects of CO2 on vegetation could be explored by running the vegetation model offline with consistent temperature and precipitation but different CO2, which could be tested in future research.
In this study, the dust emission model does not give a complete dust cycle, nor is it fully coupled to the GCM, so the dust feedback is not represented in the simulations. The effect of dust on the corresponding palaeoclimate could have been significant, especially for periods with enormous emissions. For the time periods where our results show high dust emissions, the radiation effect of dust may be very different from the pre-industrial time or the Last Glacial Maximum. The latter two are relatively well constrained, whereas the effects in high-emission deeper times require further diagnosis. There are many models which include a dust scheme, e.g. the CMIP6 models evaluated in Zhao et al. (2022), but they would take huge computational resources to run simulations of similar temporal resolution due to their complexity, while offline dust models are more suitable for carrying out multi-scale simulations with the defect of losing dynamic feedback between the dust cycle and the climate system. In addition, these models often require a much greater level of detail for dust input parameters, which is unattainable for the deep past.
Another aspect of limitation is that the model designed for this study is not supposed to test the hypothesis related to the sediment supply process, e.g. the hydrological basins and glaciogenic dust source, as described in Sect. 2.1. These explorations could be pursued in future research with higher computational resources, using more complex models including those parameterisations.
In this study, we simulate dust emissions over the Phanerozoic with an offline dust emission model, DUSTY1.0, and the general circulation model HadCM3L. The dust emission model is first tuned to the modern and then applied to the palaeo-configurations. For the first time, our study yields a time series of global dust emission rates of the whole Phanerozoic, along with corresponding dust emission fields at the stage-level resolution. The early Paleozoic may have underestimated simulated dust emissions before land plant colonisation. Model–data comparisons reveal that our simulations are reasonable in accordance with geological records.
The driving forces of dust emissions over time are analysed at different levels of mechanisms. From the perspective of dust-emission-related surface processes, our results suggest the non-vegetated area is the predominant contributing factor to dust emission variations on a multi-million-year scale, both in magnitude and in patterns of changes versus time. From the perspective of the geological timescale, our results suggest that palaeogeography dominates the variations in continent aridity and therefore dust emissions, while the effect from CO2 is negligible.
Here we provide the detailed methods of factorisation used in Sect. 4.2.
For the linear factorisation on l and b, the dust emissions contributed by l (ΔDl) are calculated as follows:
representing the dust emission difference between the configuration in which there is no dust emission over the whole globe and the configuration in which all the land area produces dust. The corresponding states of other variables in the configuration in which all land is vegetation-free are b=1, which means all the land surface is covered by 100 % bare soil; m=0, which means the surface soil is at its driest over all land; s=0, which means there is no snow cover anywhere; and U=1.91 (in the choice of tuned parameter set version 1), indicating the surface wind speed that blows up the dust. Similarly, the dust emissions contributed by b (ΔDb) are calculated as follows:
which represents the difference in dust emission rate between the configuration in which all land is vegetation-free and the configuration in which dust sources are restricted to non-vegetated land areas. The corresponding states of other variables in this configuration are identical to those in the configuration in which all land is vegetation-free, except that b is assigned specific values.
For the non-linear factorisation on dm, ds, and dU, the algorithm is as follows, according to Lunt et al. (2021), to calculate the difference between D and ΔDlb.
The resulting equations for the factorisations are
where ΔDm, ΔDs, and ΔDU represent the difference in dust emission caused by m, s, and U from the “all-bare-land-desert” configuration respectively.
The total dust emission rate is hence isolated as
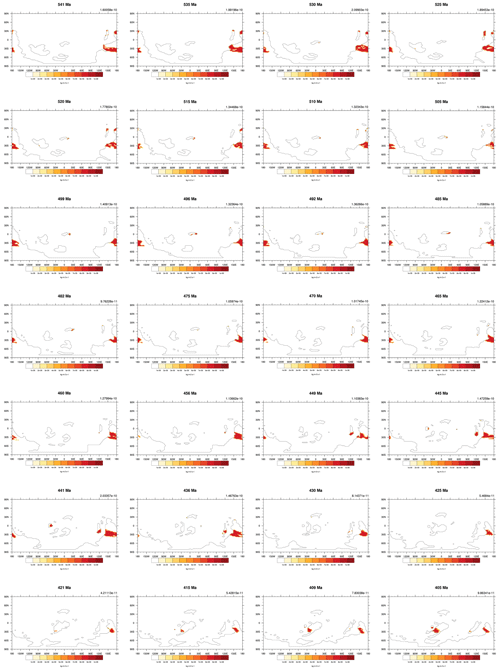
Figure A2The simulated dust emissions of all 109 time slices over the Phanerozoic (part 1). Values on the top right are the global mean dust emission rates. Units are .
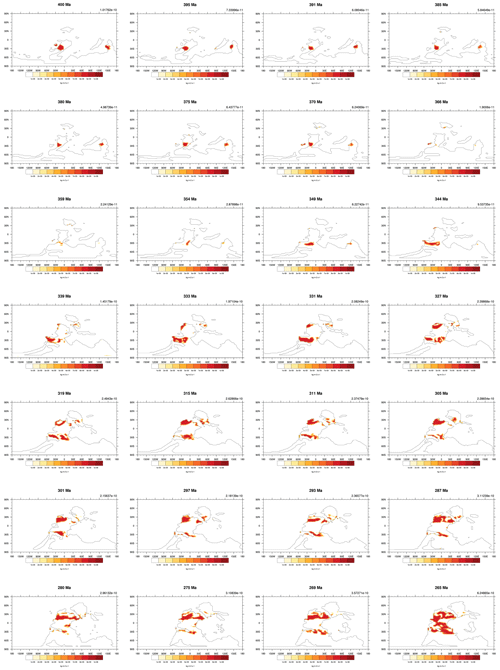
Figure A3The simulated dust emissions of all 109 time slices over the Phanerozoic (part 2). Values on the top right are the global mean dust emission rates. Units are .
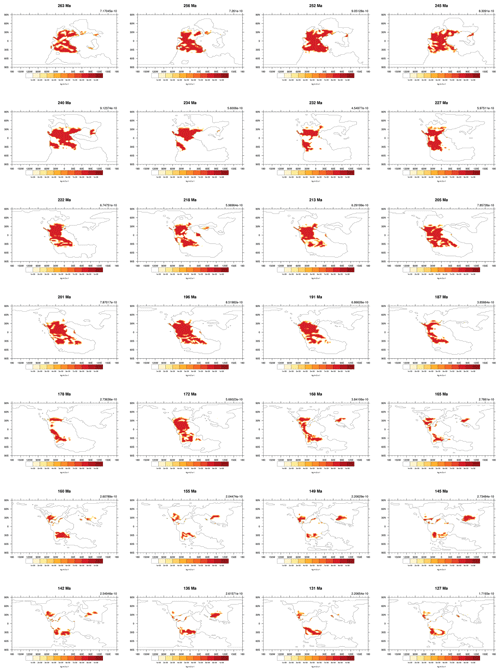
Figure A4The simulated dust emissions of all 109 time slices over the Phanerozoic (part 3). Values on the top right are the global mean dust emission rates. Units are .
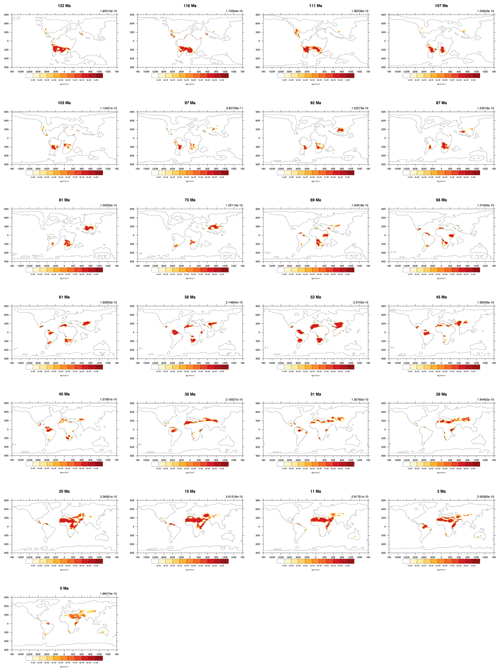
Figure A5The simulated dust emissions of all 109 time slices over the Phanerozoic (part 4). Values on the top right are the global mean dust emission rates. Units are .
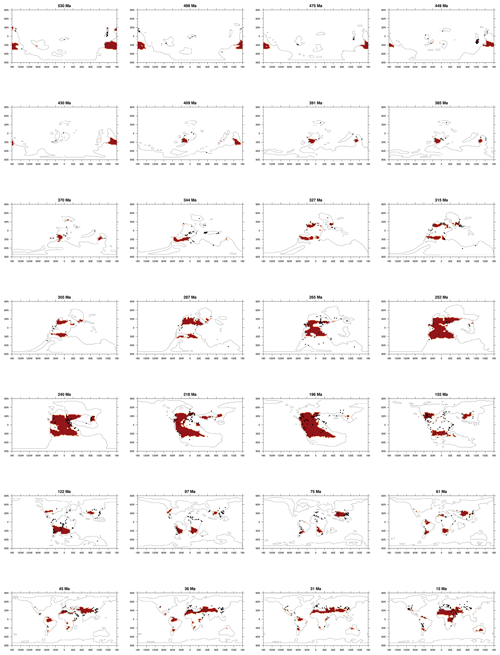
Figure A6Comparisons of evaporite sedimentary records (dark dots; data from Boucot et al., 2013) to the simulated evaporite (area in red) of multiple time slices.
The DUSTY1.0 model code and the simulated dust emission fields are available at https://doi.org/10.5281/zenodo.14031529 (Xie, 2024).
The study was developed by all authors. PJV and DJL performed the original HadCM3L model simulations. DJL and YX designed the study, developed the DUSTY1.0 model, and carried out the analysis. YX wrote the original article, and DJL and PJV provided edits.
The contact author has declared that none of the authors has any competing interests.
Publisher's note: Copernicus Publications remains neutral with regard to jurisdictional claims made in the text, published maps, institutional affiliations, or any other geographical representation in this paper. While Copernicus Publications makes every effort to include appropriate place names, the final responsibility lies with the authors.
This work used the computational facilities of the Advanced Computing Research Centre, University of Bristol – http://www.bristol.ac.uk/acrc/ (last access: 3 November 2024).
This research has been supported by the Natural Environment Research Council (PaleoGradPhan: Paleoclimate meridional and zonal Gradients in the Phanerozoic (grant no. NE/X000222/1)) and the China Scholarship Council (grant no. 202006380069).
This paper was edited by Yannick Donnadieu and reviewed by Yonggang Liu and one anonymous referee.
Anderson, C. H., Murray, R. W., Dunlea, A. G., Giosan, L., Kinsley, C. W., McGee, D., and Tada, R.: Aeolian delivery to Ulleung Basin, Korea (Japan Sea), during development of the East Asian Monsoon through the last 12 Ma, Geol. Mag., 157, 806–817, https://doi.org/10.1017/S001675681900013X, 2020. a
Arakawa, A. and Lamb, V. R.: Computational Design of the Basic Dynamical Processes of the UCLA General Circulation Model, in: General Circulation Models of the Atmosphere, edited by: Chang, J., Methods in Computational Physics: Advances in Research and Applications, vol. 17, Elsevier, 173–265, https://doi.org/10.1016/B978-0-12-460817-7.50009-4, 1977. a
Bao, X., Hu, Y., Scotese, C. R., Li, X., Guo, J., Lan, J., Lin, Q., Yuan, S., Wei, M., Li, Z., Man, K., Yin, Z., Han, J., Zhang, J., Wei, Q., Liu, Y., Yang, J., and Nie, J.: Quantifying climate conditions for the formation of coals and evaporites, Natl. Sci. Rev., 10, nwad051, https://doi.org/10.1093/nsr/nwad051, 2023. a
Bosboom, R. E., Abels, H. A., Hoorn, C., van den Berg, B. C., Guo, Z. J., and Dupont-Nivet, G.: Aridification in continental Asia after the Middle Eocene Climatic Optimum (MECO), Earth Planet. Sc. Lett., 389, 34–42, https://doi.org/10.1016/j.epsl.2013.12.014, 2014. a, b
Boucot, A. J., Xu, C., Scotese, C. R., and Morley, R. J.: Phanerozoic Paleoclimate: An Atlas of Lithologic Indicators of Climate, SEPM Concepts in Sedimentology and Paleontology, 11, SEPM (Society for Sedimentary Geology) Tulsa, OK, https://pubs.geoscienceworld.org/books/book/1966/ (last access: 29 October 2024), 2013. a, b, c, d, e
Bullard, J. E., Baddock, M., Bradwell, T., Crusius, J., Darlington, E., Gaiero, D., Gassó, S., Gisladottir, G., Hodgkins, R., McCulloch, R., McKenna-Neuman, C., Mockford, T., Stewart, H., and Thorsteinsson, T.: High-latitude dust in the Earth system, Rev. Geophys., 54, 447–485, https://doi.org/10.1002/2016RG000518, 2016. a
Bushell, A.: Unified Model User Guide, Chap. Clouds, p. 27, in: Matthews, https://ukscience.org/_Media/UM_User_Guide.pdf (last access: 29 October 2024), 1998. a
Cakmur, R. V., Miller, R. L., Perlwitz, J., Geogdzhayev, I. V., Ginoux, P., Koch, D., Kohfeld, K. E., Tegen, I., and Zender, C. S.: Constraining the magnitude of the global dust cycle by minimizing the difference between a model and observations, J. Geophys. Res.-Atmos., 111, 1–24, https://doi.org/10.1029/2005JD005791, 2006. a
Cecil, C. B.: The Concept of Autocyclic and Allocyclic Controls on Sedimentation and Stratigraphy, Emphasizing the Climatic Variable, Climate Controls on Stratigraphy, 77, 13–20, https://doi.org/10.2110/pec.03.77.0013, 2003. a
Charney, J., Quirk, W. J., Chow, S. H., and Kornfield, J.: Comparative Study of the Effects of Albedo Change on Drought in Semi-Arid Regions, J. Atmos. Sci., 34, 1366–1385, https://doi.org/10.1175/1520-0469(1977)034<1366:ACSOTE>2.0.CO;2, 1977. a
Chen, S., Huang, J., Qian, Y., Zhao, C., Kang, L., Yang, B., Wang, Y., Liu, Y., Yuan, T., Wang, T., Ma, X., and Zhang, G.: An overview of mineral dust modeling over East Asia, J. Meteorol. Res.-PRC, 31, 633–653, https://doi.org/10.1007/s13351-017-6142-2, 2017. a
Cox, D. M.: A primitive equation, 3-dimensional model of the ocean, GFDL Ocean Group Technical Report No. 1, Geophysical Fluid Dynamics Laboratory, P.O. Box 308, Princeton, New Jersey, 08542, https://www.gfdl.noaa.gov/bibliography/related_files/Cox_1984_GFDL_Tech_Report_1.pdf (last access: 8 November 2024), 1984. a
Cox, P., Betts, R., Bunton, C., Essery, R., Rowntree, P., and Smith, J.: The impact of new land surface physics on the GCM simulation of climate and climate sensitivity, Clim. Dynam., 15, 183–203, https://doi.org/10.1007/s003820050276, 1999. a
Craggs, H. J., Valdes, P. J., and Widdowson, M.: Climate model predictions for the latest Cretaceous: An evaluation using climatically sensitive sediments as proxy indicators, Palaeogeogr. Palaeocl., 315–316, 12–23, https://doi.org/10.1016/j.palaeo.2011.11.004, 2012. a
DeCelles, P. G., Kapp, P., Ding, L., and Gehrels, G. E.: Late Cretaceous to middle Tertiary basin evolution in the central Tibetan Plateau: Changing environments in response to tectonic partitioning, aridification, and regional elevation gain, GSA Bulletin, 119, 654–680, https://doi.org/10.1130/B26074.1, 2007. a
Diaz, H. F. and Bradley, R. S.: The Hadley Circulation: Present, Past, and Future, Springer Netherlands, Dordrecht, 1–5, https://doi.org/10.1007/978-1-4020-2944-8_1, 2004. a
Edwards, J. M. and Slingo, A.: Studies with a flexible new radiation code. I: Choosing a configuration for a large-scale model, Q. J. Roy. Meteor. Soc., 122, 689–719, https://doi.org/10.1002/qj.49712253107, 1996. a
Farnsworth, A., Lunt, D. J., Robinson, S. A., Valdes, P. J., Roberts, W. H., Clift, P. D., Markwick, P., Su, T., Wrobel, N., Bragg, F., Kelland, S. J., and Pancost, R. D.: Past East Asian monsoon evolution controlled by paleogeography, not CO2, Tech. Rep. 10, https://doi.org/10.1126/sciadv.aax1697, 2019. a, b
Fitzsimmons, K. E., Cohen, T. J., Hesse, P. P., Jansen, J., Nanson, G. C., May, J. H., Barrows, T. T., Haberlah, D., Hilgers, A., Kelly, T., Larsen, J., Lomax, J., and Treble, P.: Late Quaternary palaeoenvironmental change in the Australian drylands, Quaternary Sci. Rev., 74, 78–96, https://doi.org/10.1016/J.QUASCIREV.2012.09.007, 2013. a
Foster, G. L., Royer, D. L., and Lunt, D. J.: Future climate forcing potentially without precedent in the last 420 million years, Nat. Commun., 8, 1–8, https://doi.org/10.1038/ncomms14845, 2017. a, b
Gabbott, S. E., Zalasiewicz, J., Aldridge, R. J., and Theron, J. N.: Eolian input into the Late Ordovician postglacial Soom Shale, South Africa, Geology, 38, 1103–1106, https://doi.org/10.1130/G31426.1, 2010. a
Gillette, D. A. and Passi, R.: Modeling dust emission caused by wind erosion, J. Geophys. Res., 93, 14233–14242, https://doi.org/10.1029/jd093id11p14233, 1988. a
Ginoux, P., Chin, M., Tegen, I., Goddard, T., and In, G.: Sources and distributions of dust aerosols simulated with the GOCART model, J. Geophys. Res., 106, 20255–20273, 2001. a, b, c
Gkikas, A., Proestakis, E., Amiridis, V., Kazadzis, S., Di Tomaso, E., Tsekeri, A., Marinou, E., Hatzianastassiou, N., and Pérez García-Pando, C.: ModIs Dust AeroSol (MIDAS): a global fine-resolution dust optical depth data set, Atmos. Meas. Tech., 14, 309–334, https://doi.org/10.5194/amt-14-309-2021, 2021. a
Gough, D. O.: Solar interior structure and luminosity variations, Sol. Phys., 74, 21–34, https://doi.org/10.1007/BF00151270, 1981. a
Gregory, D., Kershaw, R., and Inness, P. M.: Parametrization of momentum transport by convection. II: Tests in single-column and general circulation models, Q. J. Roy. Meteor. Soc., 123, 1153–1183, https://doi.org/10.1002/qj.49712354103, 1997. a
Hasegawa, H., Tada, R., Jiang, X., Suganuma, Y., Imsamut, S., Charusiri, P., Ichinnorov, N., and Khand, Y.: Drastic shrinking of the Hadley circulation during the mid-Cretaceous Supergreenhouse, Clim. Past, 8, 1323–1337, https://doi.org/10.5194/cp-8-1323-2012, 2012. a
Jickells, T. D., An, Z. S., Andersen, K. K., Baker, A. R., Bergametti, C., Brooks, N., Cao, J. J., Boyd, P. W., Duce, R. A., Hunter, K. A., Kawahata, H., Kubilay, N., LaRoche, J., Liss, P. S., Mahowald, N., Prospero, J. M., Ridgwell, A. J., Tegen, I., and Torres, R.: Global iron connections between desert dust, ocean biogeochemistry, and climate, Tech. Rep. 5718, https://doi.org/10.1126/science.1105959, 2005. a
Jolivet, M., Bourquin, S., Heilbronn, G., Robin, C., Barrier, L., Dabard, M. P., Jia, Y., De Pelsmaeker, E., and Fu, B.: The Upper Jurassic-Lower Cretaceous alluvial-fan deposits of the Kalaza Formation (Central Asia): Tectonic pulse or increased aridity?, Geol. Soc. Spec. Publ., 427, 491–521, https://doi.org/10.1144/SP427.6, 2017. a
Jones, L. A., Mannion, P. D., Farnsworth, A., Bragg, F., and Lunt, D. J.: Climatic and tectonic drivers shaped the tropical distribution of coral reefs, Nat. Commun., 13, 1–10, https://doi.org/10.1038/s41467-022-30793-8, 2022. a
Kerkweg, A., Sander, R., Tost, H., and Jöckel, P.: Technical note: Implementation of prescribed (OFFLEM), calculated (ONLEM), and pseudo-emissions (TNUDGE) of chemical species in the Modular Earth Submodel System (MESSy), Atmos. Chem. Phys., 6, 3603–3609, https://doi.org/10.5194/acp-6-3603-2006, 2006. a
Kiehl, J. T. and Shields, C. A.: Sensitivity of the palaeocene-eocene thermal maximum climate to cloud properties, Philos. T. Roy. Soc. A, 371, 106901, https://doi.org/10.1098/rsta.2013.0093, 2013. a
Kohfeld, K. E. and Harrison, S. P.: DIRTMAP: The geological record of dust, Earth-Sci. Rev., 54, 81–114, https://doi.org/10.1016/S0012-8252(01)00042-3, 2001. a
Kok, J. F., Parteli, E. J., Michaels, T. I., and Karam, D. B.: The physics of wind-blown sand and dust, Reports on Progress in Physics, 75, 106901, https://doi.org/10.1088/0034-4885/75/10/106901, 2012 a
Kok, J. F., Mahowald, N. M., Fratini, G., Gillies, J. A., Ishizuka, M., Leys, J. F., Mikami, M., Park, M.-S., Park, S.-U., Van Pelt, R. S., and Zobeck, T. M.: An improved dust emission model – Part 1: Model description and comparison against measurements, Atmos. Chem. Phys., 14, 13023–13041, https://doi.org/10.5194/acp-14-13023-2014, 2014. a
Lamy, F., Gersonde, R., Winckler, G., Esper, O., Jaeschke, A., Kuhn, G., Ullermann, J., Martínez-Garcia, A., Lambert, F., and Kilian, R.: Increased dust deposition in the Pacific Southern Ocean during glacial periods, Science, 343, 403–407, 2014. a
Li, Y., Shi, W., Aydin, A., Beroya-Eitner, M. A., and Gao, G.: Loess genesis and worldwide distribution, Earth-Sci. Rev., 201, 102947, https://doi.org/10.1016/j.earscirev.2019.102947, 2020. a
Licht, A., Dupont-Nivet, G., Pullen, A., Kapp, P., Abels, H. A., Lai, Z., Guo, Z., Abell, J., and Giesler, D.: Resilience of the Asian atmospheric circulation shown by Paleogene dust provenance, Nat. Commun., 7, 12390, https://doi.org/10.1038/ncomms12390, 2016. a, b, c
Lin, Q., Liu, Y., Guo, J., Li, X., Lan, J., Zuo, H., Zhang, M., Zhang, J., Zhao, Z., Yuan, S., Bao, X., and Hu, Y.: Simulated dust activity in typical time periods of the past 250 million years, Fundamental Research, in press, https://doi.org/10.1016/j.fmre.2024.02.004, 2024. a, b
Liu, P., Liu, Y., Peng, Y., Lamarque, J. F., Wang, M., and Hu, Y.: Large influence of dust on the Precambrian climate, Nat. Commun., 11, 1–8, https://doi.org/10.1038/s41467-020-18258-2, 2020. a, b
Lunt, D. J. and Valdes, P. J.: The modern dust cycle: Comparison of model results with observations and study of sensitivities, J. Geophys. Res.-Atmos., 107, 1–1, https://doi.org/10.1029/2002JD002316, 2002. a
Lunt, D. J., Chandan, D., Haywood, A. M., Lunt, G. M., Rougier, J. C., Salzmann, U., Schmidt, G. A., and Valdes, P. J.: Multi-variate factorisation of numerical simulations, Geosci. Model Dev., 14, 4307–4317, https://doi.org/10.5194/gmd-14-4307-2021, 2021. a, b
Mahowald, N. M., Muhs, D. R., Levis, S., Rasch, P. J., Yoshioka, M., Zender, C. S., and Luo, C.: Change in atmospheric mineral aerosols in response to climate: Last glacial period, preindustrial, modern, and doubled carbon dioxide climates, J. Geophys. Res.-Atmos., 111, D10202, https://doi.org/10.1029/2005JD006653, 2006. a, b
Mahowald, N. M., Scanza, R., Brahney, J., Goodale, C. L., Hess, P. G., Moore, J. K., and Neff, J.: Aerosol Deposition Impacts on Land and Ocean Carbon Cycles, Current Climate Change Reports, 3, 16–31, https://doi.org/10.1007/s40641-017-0056-z, 2017. a
Marx, S. K., Kamber, B. S., McGowan, H. A., Petherick, L. M., McTainsh, G. H., Stromsoe, N., Hooper, J. N., and May, J. H.: Palaeo-dust records: A window to understanding past environments, Global Planet. Change, 165, 13–43, https://doi.org/10.1016/j.gloplacha.2018.03.001, 2018. a, b
Marzocchi, A., Lunt, D. J., Flecker, R., Bradshaw, C. D., Farnsworth, A., and Hilgen, F. J.: Orbital control on late Miocene climate and the North African monsoon: insight from an ensemble of sub-precessional simulations, Clim. Past, 11, 1271–1295, https://doi.org/10.5194/cp-11-1271-2015, 2015. a
Matthaeus, W. J., Macarewich, S. I., Richey, J., Montañez, I. P., Mcelwain, J. C., White, J. D., Wilson, J. P., and Poulsen, C. J.: A Systems Approach to Understanding How Plants Transformed Earth's Environment in Deep Time, Annu. Rev. Earth Pl. Sc., 51, 551–580, https://doi.org/10.1146/annurev-earth-080222-082017, 2023. a
McGlannan, A. J., Bonar, A., Pfeifer, L., Steinig, S., Valdes, P., Adams, S., Duarte, D., Milad, B., Cullen, A., and Soreghan, G. S.: An eolian dust origin for clastic fines of Devono-Mississippian mudrocks of the greater North American midcontinent, J. Sediment. Res., 92, 1186–1206, https://doi.org/10.2110/jsr.2022.013, 2022. a
Mckay, M., Beckman, R., and Conover, W.: A Comparison of Three Methods for Selecting Vales of Input Variables in the Analysis of Output From a Computer Code, Technometrics, 21, 239–245, https://doi.org/10.1080/00401706.1979.10489755, 1979. a
Miller, R. L., Cakmur, R. V., Perlwitz, J., Geogdzhayev, I. V., Ginoux, P., Koch, D., Kohfeld, K. E., Prigent, C., Ruedy, R., Schmidt, G. A., and Tegen, I.: Mineral dust aerosols in the NASA Goddard Institute for Space Sciences ModelE atmospheric general circulation model, J. Geophys. Res.-Atmos., 111, 1–19, https://doi.org/10.1029/2005JD005796, 2006. a, b
Mills, B. J. W., Krause, A. J., Scotese, C. R., Hill, D. J., Shields, G. A., and Lenton, T. M.: Modelling the long-term carbon cycle, atmospheric CO2, and Earth surface temperature from late Neoproterozoic to present day, Gondwana Res., 67, 172–186, https://doi.org/10.1016/j.gr.2018.12.001, 2019.
Muhs, D. R.: The geologic records of dust in the quaternary, Aeolian Res., 9, 3–48, https://doi.org/10.1016/j.aeolia.2012.08.001, 2013. a, b
Nguyen, H., Evans, A., Lucas, C., Smith, I., and Timbal, B.: The Hadley Circulation in Reanalyses: Climatology, Variability, and Change, J. Climate, 26, 3357–3376, https://doi.org/10.1175/JCLI-D-12-00224.1, 2013. a
Niedermeyer, E. M., Schefuß, E., Sessions, A. L., Mulitza, S., Mollenhauer, G., Schulz, M., and Wefer, G.: Orbital- and millennial-scale changes in the hydrologic cycle and vegetation in the western African Sahel: insights from individual plant wax δD and δ13C, Quaternary Sci. Rev., 29, 2996–3005, https://doi.org/10.1016/J.QUASCIREV.2010.06.039, 2010. a
Nowak, H., Vérard, C., and Kustatscher, E.: Palaeophytogeographical Patterns Across the Permian–Triassic Boundary, Front. Earth Sci., 8, 1–16, https://doi.org/10.3389/feart.2020.613350, 2020. a
Pérez, C., Haustein, K., Janjic, Z., Jorba, O., Huneeus, N., Baldasano, J. M., Black, T., Basart, S., Nickovic, S., Miller, R. L., Perlwitz, J. P., Schulz, M., and Thomson, M.: Atmospheric dust modeling from meso to global scales with the online NMMB/BSC-Dust model – Part 1: Model description, annual simulations and evaluation, Atmos. Chem. Phys., 11, 13001–13027, https://doi.org/10.5194/acp-11-13001-2011, 2011. a
Price, G. D., Sellwood, B. W., and Valdes, P. J.: Sedimentological evaluation of general circulation model simulations for the “greenhouse” Earth: Cretaceous and Jurassic case studies, Sediment. Geol., 100, 159–180, https://doi.org/10.1016/0037-0738(95)00106-9, 1995. a, b
Prospero, J. M., Ginoux, P., Torres, O., Nicholson, S. E., and Gill, T. E.: Environmental Characterization of Global Sources of Atmospheric Soil Dust Identified with the Nimbus 7 Total Ozone Mapping Spectrometer (TOMS) Absorbing Aerosol Product, Rev. Geophys., 40, 2–31, https://doi.org/10.1029/2000RG000095, 2002. a
Rea, D. K., Snoeckx, I., and Joseph, L. H.: Late Cenozoic Eolian deposition in the North Pacific: Asian drying, Tibetan uplift, and cooling of the northern hemisphere, Paleoceanography, 13, 215–224, https://doi.org/10.1029/98PA00123, 1998. a
Royer, D. L., Berner, R. A., Montanez, I. P., Tabor, N. J., and Beerling, D. J.: CO2 as a primary driver of Phanerozoic climate, GSA Today, 14, 4–10, https://doi.org/10.1130/1052-5173(2004)014<4:CAAPDO>2.0.CO;2, 2004.
Sagoo, N., Valdes, P., Flecker, R., and Gregoire, L. J.: The early eocene equable climate problem: Can perturbations of climate model parameters identify possible solutions?, Philos. T. Roy. Soc. A, 371, 20130123, https://doi.org/10.1098/rsta.2013.0123, 2013. a
Schepanski, K.: Transport of mineral dust and its impact on climate, Geosciences, 8, 151, https://doi.org/10.3390/geosciences8050151, 2018. a
Scotese, C.: Paleomap Paleoatlas for Gplates and the Paleodataplotter Program, https://doi.org/10.1130/abs/2016nc-275387, 2016 a
Scotese, C. R. and Wright, N. M.: PALEOMAP Paleodigital Elevation Models (PaleoDEMS) for the Phanerozoic by Christopher R. Scotese and Nicky Wright Research School of Earth Sciences, Australian National University, 1–26, https://www.earthbyte.org/paleodem-resource-scotese-and-wright-2018/ (last access: 3 November 2024), 2018. a
Shao, Y.: A model for mineral dust emission, J. Geophys. Res.-Atmos., 106, 20239–20254, https://doi.org/10.1029/2001JD900171, 2001. a
Soreghan, G. S., Soreghan, M. J., and Hamilton, M. A.: Origin and significance of loess in late Paleozoic western Pangaea: A record of tropical cold?, Palaeogeogr. Palaeocl., 268, 234–259, https://doi.org/10.1016/j.palaeo.2008.03.050, 2008. a
Sugden, D. E., McCulloch, R. D., Bory, A. J., and Hein, A. S.: Influence of Patagonian glaciers on Antarctic dust deposition during the last glacial period, Nat. Geosci., 2, 281–285, https://doi.org/10.1038/ngeo474, 2009. a
Tegen, I. and Fung, I.: Modeling of mineral dust in the atmosphere: Sources, transport, and optical thickness, J. Geophys. Res.-Atmos., 99, 22897–22914, https://doi.org/10.1029/94JD01928, 1994. a
Turner, J. S. and Kraus, E. B.: A one-dimensional model of the seasonal thermocline I. A laboratory experiment and its interpretation, Tellus, 19, 88–97, https://doi.org/10.3402/tellusa.v19i1.9752, 1967. a
Valdes, P. J., Armstrong, E., Badger, M. P. S., Bradshaw, C. D., Bragg, F., Crucifix, M., Davies-Barnard, T., Day, J. J., Farnsworth, A., Gordon, C., Hopcroft, P. O., Kennedy, A. T., Lord, N. S., Lunt, D. J., Marzocchi, A., Parry, L. M., Pope, V., Roberts, W. H. G., Stone, E. J., Tourte, G. J. L., and Williams, J. H. T.: The BRIDGE HadCM3 family of climate models: HadCM3@Bristol v1.0, Geosci. Model Dev., 10, 3715–3743, https://doi.org/10.5194/gmd-10-3715-2017, 2017. a, b, c
Valdes, P. J., Scotese, C. R., and Lunt, D. J.: Deep ocean temperatures through time, Clim. Past, 17, 1483–1506, https://doi.org/10.5194/cp-17-1483-2021, 2021. a, b, c
Vallé, F., Westerhold, T., and Dupont, L. M.: Orbital-driven environmental changes recorded at ODP Site 959 (eastern equatorial Atlantic) from the Late Miocene to the Early Pleistocene, Int. J. Earth Sci., 106, 1161–1174, https://doi.org/10.1007/s00531-016-1350-z, 2017. a
Wade, D. C., Abraham, N. L., Farnsworth, A., Valdes, P. J., Bragg, F., and Archibald, A. T.: Simulating the climate response to atmospheric oxygen variability in the Phanerozoic: a focus on the Holocene, Cretaceous and Permian, Clim. Past, 15, 1463–1483, https://doi.org/10.5194/cp-15-1463-2019, 2019. a
Wang, F., Li, Z., Sun, X., Zhao, J., Fan, Y., Xia, D., Ayyamperumal, R., and Li, B.: Early Cretaceous (late Barremian–Early Albian) expanding aeolian activity in East Asia: Evidence from the stratigraphic evolution of aeolian deposition in the Baiyin-Jingyuan Basin, northern China, Bull. Geol. Soc. Am., 136, 487–512, https://doi.org/10.1130/B36747.1, 2024. a
Warren, J. K.: Evaporites through time: Tectonic, climatic and eustatic controls in marine and nonmarine deposits, Earth-Sci. Rev., 98, 217–268, https://doi.org/10.1016/j.earscirev.2009.11.004, 2010. a
Watterson, I. G., Bathols, J., and Heady, C.: What Influences the Skill of Climate Models over the Continents?, B. Am. Meteorol. Soc., 95, 689–700, https://doi.org/10.1175/BAMS-D-12-00136.1, 2014. a
White, A. A. and Bromley, R. A.: Dynamically consistent, quasi-hydrostatic equations for global models with a complete representation of the Coriolis force, Q. J. Roy. Meteor. Soc., 121, 399–418, https://doi.org/10.1002/qj.49712152208, 1995. a
Wilson, D.: Unified Model User Guide, chap 2.1.5 precipitation, https://ukscience.org/_Media/UM_User_Guide.pdf (last access: 3 November 2024), 1998. a
Winckler, G., Anderson, R. F., Fleisher, M. Q., McGee, D., and Mahowald, N.: Covariant glacial-interglacial dust fluxes in the equatorial Pacific and Antarctica, Science, 320, 93–96, https://doi.org/10.1126/science.1150595, 2008. a
Xie, Y.: yixuan-coding/DUSTY1.0: DUSTY1.0 model code and simulated Phanerozoic dust emission fields, Zenodo [code and data set], https://doi.org/10.5281/zenodo.14031529, 2024.
Yang, Y., Galy, A., Fang, X., Yang, R., Zhang, W., Song, B., Liu, Y., Han, W., Zhang, W., and Yang, S.: Neodymium isotopic constraints on Cenozoic Asian dust provenance changes linked to the exhumation history of the northern Tibetan Plateau and the Central Asian Orogenic Belt, Geochim. Cosmochim. Ac., 296, 38–55, https://doi.org/10.1016/j.gca.2020.12.026, 2021. a
Zender, C. S., Newman, D., and Torres, O.: Spatial heterogeneity in aeolian erodibility: Uniform, topographic, geomorphic, and hydrologic hypotheses, J. Geophys. Res.-Atmos., 108, 4543, https://doi.org/10.1029/2002jd003039, 2003. a
Zhang, J., Liu, Y., Fang, X., Wang, C., and Yang, Y.: Large dry-humid fluctuations in Asia during the Late Cretaceous due to orbital forcing: A modeling study, Palaeogeogr. Palaeocl., 533, 109230, https://doi.org/10.1016/j.palaeo.2019.06.003, 2019. a, b
Zhang, W., Chen, J., Ji, J., and Li, G.: Evolving flux of Asian dust in the North Pacific Ocean since the late Oligocene, Aeolian Res., 23, 11–20, https://doi.org/10.1016/j.aeolia.2016.09.004, 2016. a
Zhao, A., Ryder, C. L., and Wilcox, L. J.: How well do the CMIP6 models simulate dust aerosols?, Atmos. Chem. Phys., 22, 2095–2119, https://doi.org/10.5194/acp-22-2095-2022, 2022. a, b
Zhu, Z., Kuang, H., Liu, Y., Benton, M. J., Newell, A. J., Xu, H., An, W., Ji, S., Xu, S., Peng, N., and Zhai, Q.: Intensifying aeolian activity following the end-Permian mass extinction: Evidence from the Late Permian–Early Triassic terrestrial sedimentary record of the Ordos Basin, North China, Sedimentology, 67, 2691–2720, https://doi.org/10.1111/sed.12716, 2020. a


