the Creative Commons Attribution 4.0 License.
the Creative Commons Attribution 4.0 License.
Antarctic climate response in Last Interglacial simulations using the Community Earth System Model (CESM2)
William H. Lipscomb
Bette L. Otto-Bliesner
Esther C. Brady
Robert A. Tomas
Nathan M. Urban
Ian Miller
Harriet Morgan
Eric J. Steig
We examine results from two transient modeling experiments that simulate the Last Interglacial period (LIG) using the state-of-the-art Community Earth System Model (CESM2), with a focus on climate and ocean changes relevant to the possible collapse of the Antarctic ice sheet. The experiments simulate the early millennia of the LIG warm period using orbital forcing, greenhouse gas concentrations, and vegetation appropriate for 127 ka. In the first case (127ka), no other changes are made; in the second case (127kaFW), we include a 0.2 Sv freshwater forcing in the North Atlantic. Both are compared with a pre-industrial control simulation (piControl). In the 127ka simulation, the global average temperature is only marginally warmer (0.004 °C) than in the piControl. When freshwater forcing is added (127kaFW), there is surface cooling in the Northern Hemisphere (NH) and warming in the Southern Hemisphere (SH), consistent with the bipolar seesaw effect. Near the Antarctic ice sheet, the 127ka simulation generates notable ocean warming (up to 0.4 °C) at depths below 200 m compared to the piControl. In contrast, the addition of freshwater in the North Atlantic in the 127kaFW run results in a multi-century subsurface ocean cooling that rebounds slowly over multiple millennia near the Antarctic ice sheet. These results have implications for the thermal forcing (and thereby mass balance) of the Antarctic ice sheet. We explore the physical processes that lead to this result and discuss implications for climate forcing of Antarctic ice sheet mass loss during the LIG.
- Article
(11444 KB) - Full-text XML
- BibTeX
- EndNote
The Last Interglacial (LIG; 129 to 116 kyr ago, ka) was characterized by warmer global temperatures and higher sea level compared to the pre-industrial (PI) climate, primarily because of orbitally induced solar insolation anomalies. Reconstructions of the LIG from climate proxy data indicate global mean temperatures about 0.5–1.5 °C greater than PI (Dutton et al., 2015; Kaspar et al., 2005; Otto-Bliesner et al., 2013; Fischer et al., 2018; Arias et al., 2021). Temperature anomalies were greatest near the poles, with Antarctic ice cores indicating annual air temperatures warmer by more than 2 °C, peaking early during the LIG at 129–128 ka (Masson-Delmotte et al., 2011), and Greenland ice cores suggesting warming of more than 4 °C (Dahl-Jensen et al., 2013; Landais et al., 2016; Masson-Delmotte et al., 2015). Sea level records from the LIG indicate that global mean sea level was 4–9 m higher than present, peaking sometime after ∼125 ka (Dutton et al., 2015). Geologic records indicate a smaller but intact Greenland ice sheet (Colville et al., 2011; de Vernal and Hillaire-Marcel, 2008). While some studies suggest that Greenland may have contributed as much as 5 m (e.g., Yau et al., 2016), most recent studies have indicated that less than 2 m is more probable, requiring large contributions from the Antarctic ice sheet (AIS), even for low-end estimates of global sea level rise (Dutton et al., 2015). The West Antarctic Ice Sheet (WAIS), which is grounded below sea level, is the most likely source of such contributions, and various lines of evidence suggest at least partial collapse of the WAIS occurring during the LIG (Scherer et al., 1998; Steig et al., 2004; Lau et al., 2023)
The prevailing explanation for a large AIS contribution to sea level during the LIG is that a reduction in the Atlantic Meridional Overturning Circulation (AMOC) played a critical role in driving ice loss from the AIS and possibly a collapse of the WAIS (Goelzer et al., 2016; Turney et al., 2020; Clark et al., 2020). As large Northern Hemisphere (NH) ice sheets melted at the beginning of the LIG, large amounts of freshwater entered the North Atlantic, suppressing deep-water formation and leading to a reduction of the AMOC (Böhm et al., 2015), allowing heat to accumulate in the Southern Ocean (i.e., the bipolar seesaw pattern; Stocker and Johnsen, 2003; Marino et al., 2015). Warmer Southern Ocean temperatures, in turn, would have enhanced the melting of the Antarctic ice sheet margin. A large freshwater discharge, associated with the Heinrich 11 (H11) event, is known to have occurred a few thousand years prior to the LIG (Böhm et al., 2015), likely between 135 and 130 ka (Clark et al., 2020), consistent with this idea. However, both the magnitude and duration of the freshwater discharge, as well as the consequent changes in the Southern Ocean, are uncertain. It is thus an open question whether the H11 event was a necessary condition for AIS mass loss during the LIG. An alternative hypothesis is that warming in the Southern Ocean, owing simply to the insolation anomalies during the LIG, may have been sufficient to cause substantial WAIS collapse. This question has relevance to the future of the WAIS over the next few centuries. Even though a freshwater discharge event comparable to that of H11 is highly unlikely to occur in the present-day climate, AMOC collapse has been predicted this century due to North Atlantic warming and freshening (Ditlevsen and Ditlevsen, 2023), and far-field impacts may be similar irrespective of the trigger (Brown and Galbraith, 2016).
The most important unknown for the AIS during the LIG – and any period when the WAIS may have collapsed – is the ocean thermal forcing (TF), the difference between the in situ water temperature and the in situ melting point of ice. Some ice sheet modeling studies suggest that a relatively high TF threshold must be reached before WAIS collapse is likely. For example, Sutter et al. (2016) found that ocean warming of at least 2–3 °C compared to PI was a prerequisite for collapse, while DeConto and Pollard (2016) found that, even with the inclusion of sensitive ice-calving physics and atmospheric feedbacks, the WAIS does not collapse under simulated LIG conditions without ocean warming of 3 °C. However, other studies suggest that widespread WAIS mass loss could be triggered even with smaller TF (1–2 °C) given the right ice sheet conditions and enough time (Berdahl et al., 2023; Lipscomb et al., 2021; Garbe et al., 2020).
The purpose of this study is to better understand the ocean and atmospheric conditions manifested near the AIS with and without a freshwater forcing event under LIG orbital conditions. Specifically, we evaluate the degree of ocean warming that may have occurred near Antarctica, with and without Northern Hemisphere freshwater forcing. To do this, we examine two global climate model simulations run with the Community Earth System Model version 2 (CESM2). The first is a simulation of the LIG, where the primary forcing difference from the PI is the orbital configuration. This leads to a large positive NH solar summer insolation anomaly. The second simulation is the same as the LIG run, except for the addition of a large 0.2 Sv (sea level rise ∼17 mm yr−1) continuous freshwater forcing in the North Atlantic. Previous work evaluating the large-scale features of similar CESM LIG runs (e.g., Otto-Bliesner et al., 2020, 2021) showed that the large positive NH solar insolation anomaly results in summer warming over the NH continents and reduced Arctic summer minimum sea ice. Capron et al. (2017) evaluated the high-latitude surface climate during the 127ka in global models compared to proxy data. Here, we assess the state of the CESM2 pre-industrial and Last Interglacial climate with and without freshwater forcing. Our analyses focus largely on the Southern Ocean and Antarctic regions.
All simulations were run with the Community Earth System Model version 2 – Finite Volume 2 (CESM2-FV2x1), with approximately 2° resolution in the atmosphere and land models. Here we briefly summarize the components used in the CESM2 simulations; further details can be found in Danabasoglu et al. (2020). We use the relatively low resolution of FV2 in anticipation of running coupled experiments with a dynamic Antarctic ice sheet in future work to save computational expense. Otto-Bliesner et al. (2020) analyzed the 127ka CESM2-FV1 (with approximately 1° resolution in atmosphere and ocean) simulation, which produces a global response similar to our FV2x1 simulation and complements this work.
CESM2 is a coupled Earth system model consisting of components for the ocean, atmosphere, sea ice, land, and land ice. Our simulations use the Community Atmosphere Model (CAM6) with 2.5° longitude by 1.8° latitude horizontal resolution. There are 32 levels, with the top level at 2.25 mb. The Community Land Model (CLM5) is on the same grid as CAM6. The ocean model is the Parallel Ocean Program version 2 (POP2). This is the same ocean model as was in the Community Climate System Model version 4 (CCSM4), except with some improvements in physical parameterizations. The POP2 resolution is a nominal 1° with uniform resolution of 1.125° in the zonal direction. The North Pole of the grid is displaced into Greenland, and there are 60 vertical levels with a maximum depth of 5500 m. The upper 16 levels have a uniform thickness of 10 m, while below ∼160 m, the level thicknesses increase monotonically to ∼3500 m depth. The deepest 2000 m has a nearly uniform thickness of ∼250 m extending to the ocean floor. The sea ice model (CICE5) uses the same grid as the ocean model. CESM2's land ice component, the Community Ice Sheet Model (CISM2.1, Lipscomb et al., 2019), typically runs on a regular 4 km mesh and is available in a coupled framework with CESM2 for the Greenland ice sheet (GrIS). Coupling to Antarctica is still in the testing phase. In the simulations presented here, the GrIS is not evolving and its geometry remains fixed. However, both surface temperature and surface mass balance (SMB) are computed in CLM5 and downscaled to the finer CISM grid. Similarly, the AIS is not evolving; the SMB is computed in CLM5 but not downscaled to a finer CISM grid.
2.1 Experimental design and methods
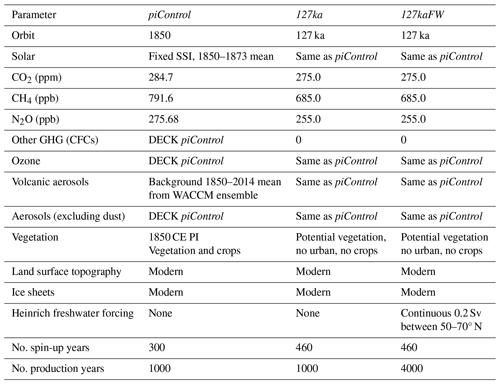
We compare two simulations using CESM2 under different 127 ka scenarios. The first is a 1000-year control simulation at 127 ka. This simulation, herein referred to as 127ka, used the CMIP6–PMIP4 Tier 1 protocol. The simulation assumes modern continental configuration and prescribes orbital parameters and greenhouse gases to LIG levels (Otto-Bliesner et al., 2017). Potential vegetation, which removes crops and urban areas and replaces it with suitable natural vegetation types, is used rather than the 1850 CE pre-industrial (PI) vegetation (Otto-Bliesner et al., 2020). The most notable change in forcing during 127ka compared to PI is orbital. The orbit at 127ka is characterized by larger eccentricity and tilt than PI, and perihelion occurs close to the boreal summer solstice compared to near the boreal winter solstice during the PI. This results in a large positive Northern Hemisphere (NH) solar insolation anomaly from April to September. Similarly, there are negative insolation anomalies in December–January–February (DJF). Full details on the 127ka orbital forcing can be found in Otto-Bliesner et al. (2020). Other forcings and boundary conditions such as the solar constant, ozone, volcanic aerosols, topography, and ice sheet configuration remain the same as in the PI.
The second run, 127kaFW, is a CMIP6-PMIP4 Tier 2 simulation that uses the same configuration and forcing as 127ka, except for a large meltwater flux (0.2 Sv) added at the surface of the North Atlantic from 50–70° N. This forcing is meant to simulate iceberg rafting from ∼135 to 130 ka as Northern Hemisphere ice sheets retreated at the end of the penultimate glaciation (Marino et al., 2015). Although this experiment was originally designed to simulate the H11 event (Otto-Bliesner et al., 2020), H11 actually began 3–8000 years before the LIG during the penultimate deglaciation, and the response to freshwater forcing in climate models is quite different in colder glacial versus warmer interglacial states (Bitz et al., 2007). We therefore use the nomenclature 127kaFW rather than 127-H11. This simulation was originally run for 1000 years under the PMIP4 protocol. We extend it with continuous freshwater forcing for another 3000 years, for a total of 4000 years. This multi-millennial simulation is designed to allow the ocean to adjust to the freshwater forcing. Although not fully realistic in terms of timing, this simulation provides a useful point of comparison with the 127ka run (without freshwater forcing), as well as with the results of earlier work in which freshwater forcing begins at 138 ka (e.g., Clark et al., 2020).
We also compare the two LIG simulations to a CMIP6 Diagnostic, Evaluation, and Characterization of Klima (DECK) pre-industrial (PI) control run, piControl. This is a 1000-year control simulation under pre-industrial climate forcings. Table 1 shows more details for all three simulations. All simulations are spun up before the millennial integrations take place, and spin-ups are not included in the analyses.
In Sect. 3.1 we analyze the mean climate of the piControl. We then compare the climate of the LIG (127ka) to the PI (piControl), primarily focusing on Antarctica and the Southern Ocean. All anomalies are computed as the difference between 127 ka and PI (difference = 127ka − piControl). Climatologies are computed using the final 50 years of the simulations. Section 3.2 examines the impact of the freshwater forcing on the climate response in the Southern Ocean and the implications for AIS mass loss. All anomalies in Sect. 3.2 are computed between the climatological 127ka mean and the evolving 127kaFW experiment (difference = 127kaFW − 127ka).
3.1 Evaluating the simulated PI and LIG climates (piControl and 127ka)
3.1.1 Global assessment
As in Otto-Bliesner et al. (2020), we find that global mean annual anomalies in surface air temperature in the 127ka simulation are slightly positive compared to the PI simulation. Global mean surface air temperature in CESM2 (127ka) is only 0.004 °C warmer than the PI (piControl) (Table 2). While global JJA temperatures are warmer in the LIG simulation by about 1 °C, global DJF temperatures are cooler by a similar magnitude. This is consistent with the timing of insolation anomalies in NH summer and winter (Otto-Bliesner et al., 2020). The greatest near-surface air temperature anomaly occurs in the NH during JJA, reaching nearly 2 °C. Proxy evidence suggests global temperatures were roughly 0.5–1 °C warmer during the LIG than PI (Arias et al., 2021; Dutton et al., 2015), indicating that the orbital-only simulation underestimates global average temperature anomalies. However, errors associated with the proxies themselves can often be as large as the proxy estimate of the differences between the LIG and PI (Fig. A1e). Otto-Bliesner et al. (2020) likewise note that CESM2-FV1 simulates the positive anomaly patterns in Greenland and Antarctica but underestimates the magnitude of the reconstructed anomalies. Otto-Bliesner et al. (2020) find that in their CESM2-FV1 simulation, global annual mean temperatures are actually cooler by 0.1 °C in 127ka compared to piControl. They find that while JJA near-surface temperatures are 1.09 °C warmer in the 127 ka compared to piControl, DJF temperatures are colder by nearly 1 °C.
Table 2Climatological 2 m air temperature (°C). Climatology is defined as the last 50 years of the run. All anomalies between 127ka and piControl are found to be statistically significant at a 5 % significance level using a standard two-tailed t test. The t test was computed over the full 1000 years to achieve better statistical characterization.

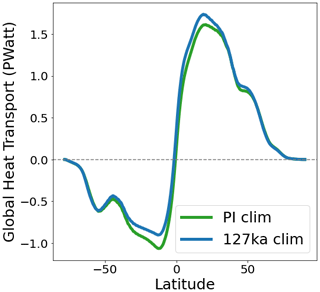
The global ocean heat content increases during the 127ka simulation. Sea surface temperatures show significant regional variability, with the strongest anomalies occurring in the North Atlantic (cooling) and the Southern Ocean (warming) (Fig. A2). Subsurface ocean temperatures in the Atlantic basin cool during the 127ka simulation, whereas most other basins warm, including the Pacific, Arctic, and Southern Ocean. This is consistent with analyses by Otto-Bliesner et al. (2020), which found that stronger westerlies over the North Atlantic increase the magnitude of the wind stress curl in the vicinity of the North Atlantic subpolar gyre and the western boundary of the subtropical gyre. Global and Atlantic northward heat transport is generally greater at all latitudes in the Northern Hemisphere in the 127ka simulation compared to the piControl (i.e., more vigorous transport) (Fig. A3). Southward heat transport in the Southern Hemisphere (SH) is weaker north of ∼55° S and slightly stronger south of ∼55° S in 127ka compared to piControl (Fig. A3). The North Atlantic annual upper cell (calculated as the maximum streamfunction found north of 28° N and below 500 m depth) strengthens in 127ka compared to piControl by about 2 Sv (not shown). This is consistent with cooler North Atlantic sea surface temperatures (Fig. A2), as deep-water formation increases and dense surface waters are cooled and brought to depth. Otto-Bliesner et al. (2020) provide more detail on the barotropic streamfunction and AMOC changes during 127ka.
Seasonal sea ice climatologies indicate that summer NH sea ice area is reduced by ∼5 million km2 during 127ka compared to the PI (Fig. A4). Arctic sea ice loss is widespread across the basin during 127ka as a result of increased NH summer insolation. Notably, the Arctic is almost ice-free in summers, with only some thin sea ice remaining in September in the central Arctic. For more analyses on global climate changes during 127ka (e.g., precipitation and monsoon patterns, El Niño–Southern Oscillation – ENSO, and AMOC), we refer the reader to the FV1 analyses by Otto-Bliesner et al. (2020).
3.1.2 Antarctic assessment
Many CMIP models suffer from a warm sea surface and deep-ocean bias in the Southern Ocean (Luo et al., 2023). CESM2 is one of these models with a global mean sea surface temperature (SST) warm bias (Danabasoglu et al., 2020). The PI Southern Ocean below ∼200 m depth is warmer than the World Ocean Atlas observations by 1–2 °C (not shown). Comparisons of ocean temperature and salinity depth profiles in the Amundsen Sea indicate that the model captures the salinity structure of the region fairly well, but with a warm bias of ∼1 °C below the thermocline (Fig. A5).
The general climate state of the piControl run, including air temperatures, ocean temperatures at the surface and subsurface, near-surface winds, wind stress curl, and minimum (February) sea ice extent, is shown in Fig. 1. Notably, the mean ocean temperature (MOT) of the full column in the SO is between 1–2 °C, while MOT in the 200–800 m range is warmer than this by about 0.5 °C. Mean westerly winds induce a negative wind stress curl in the SO south of 50° S. Minimum sea ice extent in piControl is about 3.03 million km2, comparable to the median observed extent (1981–2010) of 2.99 million km2 (NSIDC).
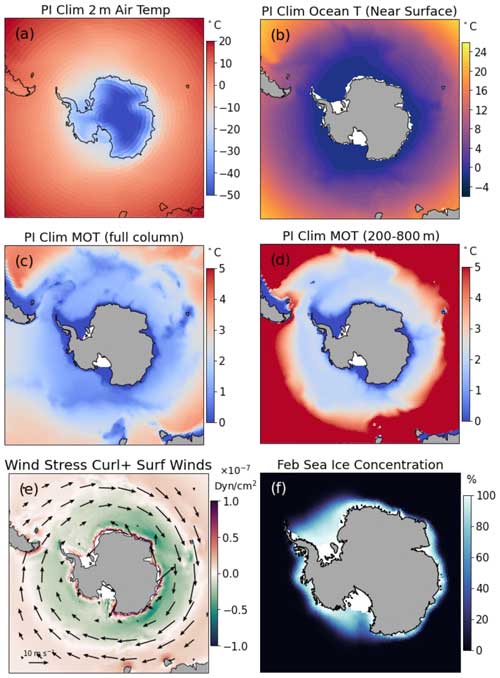
Figure 1Climatological piControl 2 m air temperature (a), near-surface ocean temperature (b), mean ocean temperature (MOT) for the full ocean column (c), MOT for the 200–800 m depth range only (d), surface winds and wind stress curl (e), and February (minimum) sea ice extent (f). Climatologies are computed over the last 50 years of the simulation.
Mean Antarctic near-surface air temperatures are shown in Table 2. Proxy reconstructions indicate that the Southern Ocean and Antarctic surface air temperatures at 127 ka were 1.8±0.8 and 2.2±1.8 °C warmer, respectively, than PI conditions (Capron et al., 2017). Our orbital-only 127ka simulation generates Antarctic annual surface air temperatures roughly 0.4 °C warmer than piControl (Fig. 2). In DJF (austral summer), simulated air temperatures over Antarctica are about 1.5 °C cooler in 127ka, while in JJA (austral winter), temperatures are 0.38 °C warmer (Table 2). The largest difference occurs in austral spring (September–November), when 127ka is about 2.7 °C warmer than piControl.
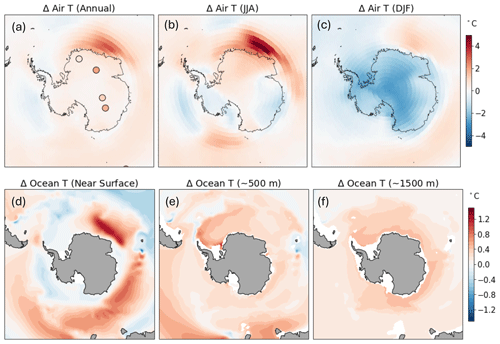
Figure 2(a–c) Climatological 127ka Antarctic 2 m air temperature anomaly (a) annually and for the (b) JJA and (c) DJF seasons. (d–f) Climatological 127ka ocean temperature anomaly for (d) near-surface, (e) ∼500 m, and (f) ∼1500 m ocean depths. Anomalies are with respect to piControl. Climatologies are computed over the last 50 years of each simulation. Proxy data indicating anomalies between 127 ka and PI are overlain where available in the region (data from Otto-Bliesner et al., 2020; Capron et al., 2017). The ice-core-based estimates of Antarctic surface temperature are scaled following the isotope temperature scaling in Kahle et al. (2021) and Buizert et al. (2021). Shaded anomalies are statistically significant at a 5 % significance level.
While in general temperatures over the Antarctic in our simulations are lower than the proxy data from Capron et al. (2017) suggest, we note that recent estimates of the sensitivity of water isotopes to temperature for East Antarctica suggest considerably smaller glacial–interglacial surface temperature changes in East Antarctica than previously thought (e.g., Kahle et al., 2021; Buizert et al., 2021). This same scaling, if applied to the LIG, also suggests much smaller warm anomalies than earlier work suggests. In particular, recent work suggests that the peak interglacial warmth at Dome Fuji, central East Antarctica, was only 2 °C warmer than present (Oyabu et al., 2023), as opposed to earlier estimates of 3.3 °C (Capron et al., 2017). Furthermore, that work suggests that the peak interglacial warmth occurred at about 129 ka, and warming at 127 ka was probably only about half as large, perhaps less than 1 °C. Given this emerging new work, Antarctic temperatures in our 127ka simulation may not be inconsistent with proxy data (Fig. 2a), though the are probably on the low end.
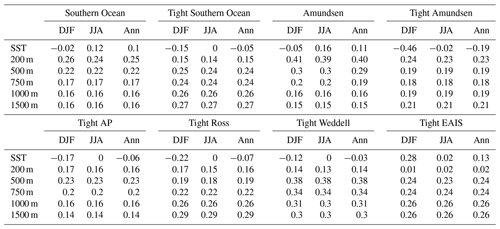
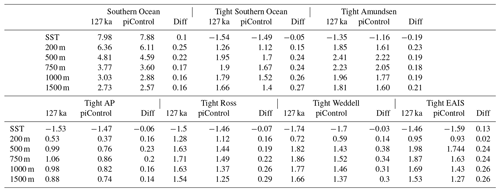
Southern Ocean SSTs are warmer on average in 127ka compared to piControl, with some regional cooling such as in the Weddell, Amundsen, and Ross seas (Fig. 2). Regional SST cooling (warming) coincides with sea ice concentration increases (decreases) (Fig. 4a). The subsurface Southern Ocean is generally warmer during 127ka, including all subset regions of the high-latitude Southern Ocean (ocean regions south of the pink band; Fig. 3). Table 3 breaks down the regional ocean response depth in the top 1500 m. In the Southern Ocean (ocean regions south of the black band in Fig. 3), ocean temperatures increase at all levels, with anomalies from PI ranging from 0.1 to 0.25° C in the upper 1500 m of the ocean. Closer to the continent in the tight Southern Ocean (TightSO, south of 65° S), subsurface temperature anomalies in the upper 1500 m range from 0.15 to 0.27° C compared to piControl. TightSO SST anomalies during 127ka are generally negative, apart from in the East Antarctic Ice Sheet (EAIS) region, though these changes are tied to changes in sea ice. The large warm air temperature patch (Fig. 2a and b) largely accounts for the positive SST anomaly in the EAIS sector (Fig. 2d). Temperature anomalies in the TightSO reach around 0.25 °C below 500 m. Notably, subsurface anomalies reach at least 0.23 °C in all TightSO sectors. The largest anomalies occur in the tight Weddell below 200 m, with anomalies reaching close to 0.4 °C.
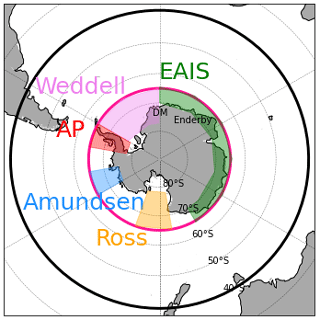
Figure 3Regions used in masking around Antarctica. When computing ocean variables in masked regions, masks only apply to available ocean grid cells. EAIS and AP are abbreviations for East Antarctic Ice Sheet and Antarctic Peninsula, respectively. DM indicates Dronning Maud Land, and Enderby refers to Enderby Land. Ocean regions south of the black band denote the Southern Ocean, and those south of the pink band (65° S) denote the tight Southern Ocean. This region is used, as it is south of the Antarctic Circumpolar Current, a barrier to meridional heat transport. Colored regions show sectors used in Table 3.
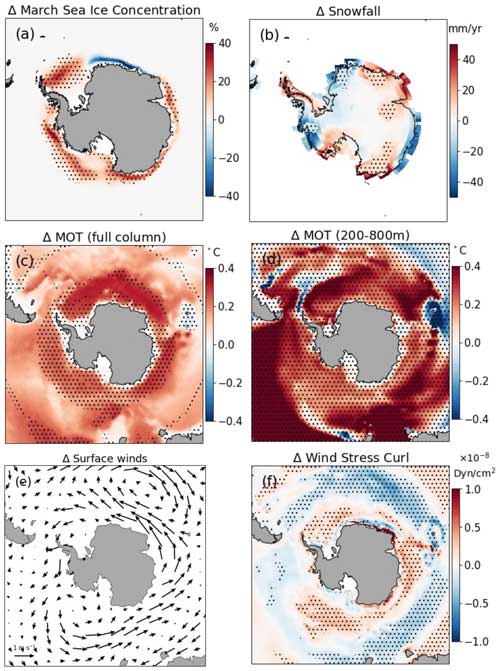
Figure 4Climate anomalies between 127ka and piControl. Climatological 127ka anomaly of minimum (March) sea ice concentration (a), snowfall rate (b), mean ocean temperature (MOT) for the full ocean column (c), MOT (200–800 m only) (d), surface winds (e), and wind stress curl (f). Anomalies are with respect to piControl. Hatching indicates significance at the 95 % confidence level.
Table 3Regional climatological ocean temperatures (°C). Columns denoting differences are defined as (127ka − piControl). Climatology is defined as the last 50 years of each run. Regions correspond to those shown in Fig. 3. Differences are significant to 95 % confidence.
Seasonality of Antarctic sea ice is generally reduced in 127ka. The 127ka run simulates a reduction in Antarctic maximum sea ice extent and a slight increase in minimum Antarctic ice area (Fig. A4). Annual mean Antarctic sea ice extent over the full 1000-year integration is reduced by about 0.4 million km2 in 127ka compared to piControl. Expansion of minimum Antarctic sea ice is evident around much of the continent, except for a reduction in extent in the EAIS near Dronning Maud Land (Fig. 4a). 127ka simulates slightly higher snowfall rates on average across the continent compared to the piControl (∼1.72 mm yr−1) (Fig. 4b). Regionally, climatological snowfall across the continent indicates a reduction of coastal snowfall in the Amundsen Sea, Dronning Maud Land, and Wilkes Land under LIG solar insolation compared to the PI. Meanwhile, the Antarctic Peninsula (AP), Enderby Land, and the Ross Sea and its neighboring regions have more snowfall. The interior of the ice sheet has a mixture of higher and lower snowfall during the LIG, but magnitudes are small, and generally differences in the interior are statistically insignificant.
As noted, the Southern Ocean generally warms as a result of the orbitally forced 127ka. MOT anomalies from the full ocean column show subsurface warming, with the largest temperature anomalies of about 0.4 °C in the Weddell Sea region (Fig. 4c). At depths near the average grounding lines of most Antarctic ice shelves (∼200–800 m) – depths that are most relevant to sub-shelf melt rates – MOT anomalies are even higher (Fig. 4d). This warming remains robust across seasonal means as well (Table A1).
In the Southern Ocean, Otto-Bliesner et al. (2020) showed that in the 127ka FV1 simulation the Antarctic Circumpolar Current (ACC) weakens during the LIG, consistent with a small shift equatorward of the southern westerlies in the Pacific sector. The greatest weakening of westerlies during the LIG is in the Atlantic–Indian Ocean sector (Fig. 4e). This region coincides with decreasing minimum sea ice extent and the greatest ocean warming both at the surface and throughout the ocean column, as seen in the MOT (Fig. 4c). The anomalies in wind stress curl around Antarctica (Fig. 4f) show lower-magnitude wind stress curl (less negative; see Fig. 1 for mean state reference) near the continent (red shades) during 127ka than in piControl. Areas of negative wind stress curl in the SH indicate that surface water is deflected northward and replaced by upwelled water from below (i.e., positive Ekman suction). In 127ka, close to the continent (the TightSO), curl anomalies are generally positive, indicating that Ekman suction is stronger in the PI than the LIG. In other words, there is less upwelling in the LIG than in PI. North of the TightSO boundary, the opposite is true. This mean annual pattern is dominated by DJF rather than JJA.
There are several interrelated mechanisms that lead to subsurface warming near the AIS during 127ka. Our simulation shows a reduction in the strength of the lower cell of the overturning circulation (see, e.g., Marshall and Speer, 2012) and decreased ventilation. The same response has also been shown recently by Yeung et al. (2024), who conducted a similar 127 ka experiment using a different model (the Australian Community Climate and Earth System Simulator; Ziehn et al., 2020) at similar resolution. Yeung et al. (2024) find both the same sign of wind changes (reduced large-scale westerlies) and reduction in deep convection as in our experiments, and they also note the possible role of changes in sea ice production (also consistent with our CESM2 results) contributing to increased stratification and subsurface warming. Yeung et al. (2024) find greater warming than in our experiments (as much as 0.7 °C in the Amundsen Sea), but following the same overall pattern. We note that although our findings and those of Yeung et al. (2024) are consistent with one another, the relationship between wind forcing and ocean response is resolution-dependent and future work with high-resolution models is likely to yield different results (Stewart and Thompson, 2012).
3.2 Model response to freshwater forcing
Next, we analyze the impact of the synthetic freshwater forcing in the North Atlantic. In the following analyses, all anomalies are calculated with respect to the 127ka run (i.e., 127kaFW − 127ka) unless indicated otherwise.
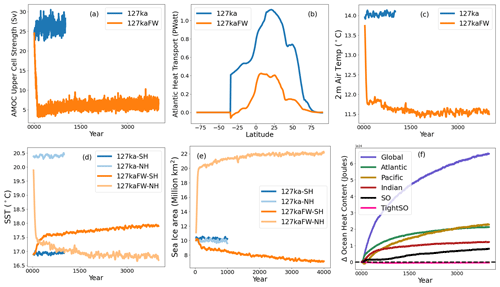
Figure 5Global response to 127kaFW forcing. (a) North Atlantic annual upper-cell strength (calculated as the maximum streamfunction found north of 28° N and below 500 m depth). (b) Atlantic northward heat transport. 127kaFW shows the average for the final 100 years of the simulation (years 3900–4000), though this pattern is representative of the full simulation after the initial shock. 127ka is the climatological mean (final 50 years of the simulation). (c) Global mean 2 m surface air temperatures as a 30-year rolling mean. (d) NH and SH SSTs for the 127kaFW and 127ka runs. Temperatures are computed as a 30-year rolling mean. (e) SH and NH sea ice area (million km2) for 127ka and 127kaFW as 30-year running means. (f) Change in ocean heat content during the 127kaFW simulation for the global ocean and specific basins. The dashed black line indicates zero change.
3.2.1 Global assessment
As expected, the addition of freshwater to the North Atlantic in 127kaFW causes the AMOC to quickly collapse and global temperatures to drop. The AMOC remains suppressed by ∼75 %–80 % compared to 127ka over the course of the experiment (∼4000 years) (Fig. 5a). The AMOC suppression is also seen as a reduction in northward heat transport in the Atlantic by ∼65 % (Fig. 5b). Global air temperatures decrease by more than 2 °C in the first few centuries, followed by slower global cooling for the following several millennia (Fig. 5c). The reduction in Atlantic northward heat transport induces the robust bipolar seesaw response (NH cooling and SH warming) in air temperatures (Fig. A1c) and sea surface temperatures (Fig. 5d). Sea surface temperatures in the SH warm by over half a degree on average during the first 500 years as a result of the freshwater forcing, after which warming continues but at a reduced rate. NH SSTs, by contrast, cool more than 2 °C in the first century. SSTs continue to cool at a slower rate after the initial shock. By the end of 4000 years, NH SSTs cool by over 3 °C compared to the 127ka simulation.
Arctic sea ice expands significantly as a result of the freshwater forcing, almost doubling from the initial ∼11 million to ∼22 million km2 by the end of the simulation (Fig. 5e). The majority of change (i.e., an increase in sea ice extent of ∼9 million km2) occurs within the first few centuries, followed by a slow and steady increase for the next 3500 years. The increase in extent during 127kaFW occurs in all months, rather than being dominated by a certain season (Fig. A4). Seasonal minimum Arctic sea ice extent during 127kaFW is comparable to the maximum seasonal extent in the 127ka run (∼15 million km2). Antarctic sea ice, on the other hand, diminishes quickly in the first several centuries of the freshwater experiment and thereafter continues to steadily decline, reaching ∼7 million km2 by the end of the simulation, a reduction of ∼30 % in area. The magnitude of Antarctic sea ice extent change is much smaller than that in the Arctic during 127kaFW. The 127kaFW simulation indicates reduction of Antarctic sea ice in all seasons compared to both 127ka and piControl.
In the freshwater experiment, the reduction of overturning in the Atlantic leads to heat accumulation in all of the main global ocean sectors (Atlantic, Pacific, Indian, Southern Ocean; Fig. 5f). However, close to the Antarctic continent in the TightSO (Fig. 3), there is a reduction in ocean heat content for the duration of the 127kaFW simulation (Figs. 6–8). We elaborate on the TightSO cooling in the next section.
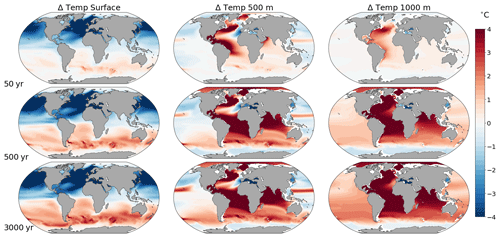
Figure 6Ocean temperature anomalies for 127kaFW relative to 127ka for three time slices (rows) and three depths (columns). Differences show the climatological difference between 127kaFW and 127ka, where climatology is computed as the final 50 years of each simulation. All shaded regions are significant with 95 % confidence.
The global SST spatial pattern resulting from the freshwater forcing is shown in Fig. 6. Northern Hemisphere SST cooling and Southern Hemisphere warming are robust responses to the addition of freshwater in the North Atlantic. North Atlantic deep-water formation is reduced due to modification of density-driven circulation in the North Atlantic. Subsurface waters, however, indicate a more complex response. The freshwater forcing causes notable ocean warming at 500 m (>4 °C), particularly in the Atlantic, Indian, and Arctic oceans. At this depth, cooling occurs in the North Pacific and equatorial Pacific, as well as the Southern Ocean near the Antarctic continent. At 1000 m depth, almost the entire global ocean warms in response to the freshwater forcing. The Southern Ocean, however, shows distinct cooling at depth for multiple centuries, reaching ∼0.25 °C, before starting a slow rebound for the remaining several millennia of the simulation. In the next section, we explore the mechanisms and implications of this reduction in ocean heat near the AIS.
3.2.2 Antarctic assessment
As noted earlier, global surface air temperatures fall significantly during 127kaFW compared to the 127ka run. Freshwater forcing causes global annual average temperatures to decrease by more than 2 °C, with DJF temperatures falling by ∼3 °C and JJA temperatures by ∼1.5 °C (Fig. A6). Over the Antarctic continent, however, surface air temperatures increase as a result of the freshwater forcing. There appear to be two timescales of air temperature response in the SH. In the initial rapid response, annual Antarctic air temperatures increase by ∼1 °C within the first several centuries. This is followed by a more moderate but steady increase in temperatures for the rest of the simulation, reaching about 2.5 °C warming after 4000 years (Fig. 7a). Antarctic summer (DJF) near-surface air temperatures increase by almost 2 °C and winter (JJA) temperatures by ∼3 °C (Fig. A6).
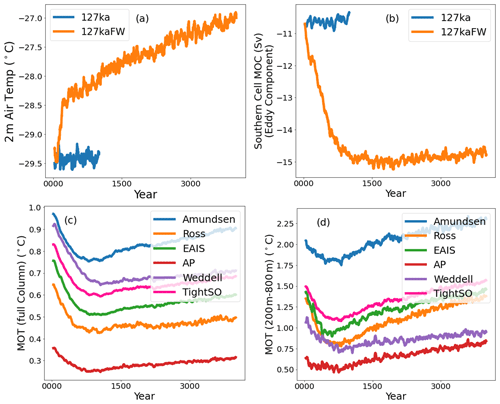
Figure 7Antarctic and Southern Ocean response to 127kaFW forcing. All curves show 30-year rolling means. (a) Near-surface air temperature over the Antarctic continent (land points). (b) Global meridional overturning circulation (MOC) lower-cell strength. Location extracted where minimum streamfunction is located, below 2 km depth and south of 33° S. Larger negative values indicate stronger circulation (negative indicates counterclockwise flow). (c) Mean ocean temperature (MOT) for the full ocean column in different sectors near the continent (sectors follow Fig. 3). (d) Same as (c) but for depths from 200–800 m.
Results in the previous section indicate that all ocean basins, including the Southern Ocean, accumulated heat in response to the idealized freshwater forcing in the model. However, closer to the AIS, in the TightSO, we found a ca. 500-year cooling. This has important implications for ocean thermal forcing on the ice sheet and therefore ice sheet melt rates and mass loss. Near the Antarctic continent (TightSO regions; Fig. 3), we find that the MOT of the full ocean column decreases by up to 0.25 °C over the first millennium (Fig. 7c). After this multi-century cooling, MOTs rebound slowly for the remainder of the simulation. Importantly, MOTs in the TightSO on average, as well as in some regional subsets of the TightSO, never rebound back to their initial values. Given that the AIS is most sensitive to thermal forcing near the grounding line of the ice shelves, we also compute the MOTs just for these depths (200–800 m) (Fig. 7d) and find similar results. On average in the TightSO, at depths most relevant to the ice sheet, temperatures cool by ∼0.2 °C within the first millennium (Fig. 7d). In certain sectors, MOTs cool even more (up to 0.25 °C in the EAIS and the Ross Sea) and again rebound slowly after the initial cooling. On average in the TightSO, as well as in the EAIS and Ross regions, it takes almost the full 4000 years to reach initial MOTs in this depth range. In the Amundsen and AP regions, MOTs rebound the most quickly after the initial cooling, exceeding their initial values after 1500 years. The Weddell sector never rebounds to its initial values before the end of the experiment. While this cooling response in the subsurface occurs in other freshwater forcing experiments (e.g., He et al., 2021; Pedro et al., 2018), it has not been considered or explored in the literature, nor has it been considered in the context of implications for AIS mass loss.
The spatial patterns of MOT further illustrate the timing of regional cooling and warming in response to the freshwater forcing (Fig. 8, top row). Within the first 500 years, MOT around the continent decreases with respect to the control case (127ka). Warm water propagates closer to the continent over the next few thousand years in a heterogeneous spatial pattern. The first region to encounter warm anomalies is the Amery Basin about 1000 years into the simulation. This is followed by warming along the peninsula after ∼2000 years, and then warming in the Amundsen and western Ross Sea after ∼3000 years. The cold anomaly persists to the end of the simulation in the Weddell Sea.
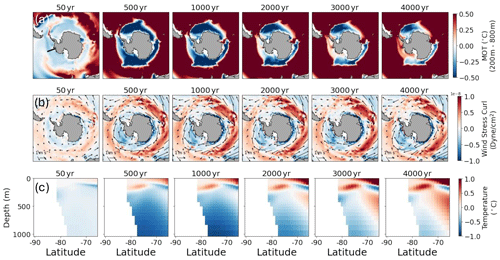
Figure 8Anomaly between 127kaFW and climatological 127ka near Antarctica. (a) Mean ocean temperature from 200–800 m depth. (b) Wind stress curl (shading) overlain with surface winds. (c) Ocean temperature with depth cross-section off the Amundsen coast. Cross-section transect location shown in panel (a). 50-year average snapshots are shown for years 50, 500, 1000, 2000, 3000, and 4000 of the freshwater simulation.
Other work has explored the thermal bipolar seesaw response to freshwater forcing (e.g., Guarino et al., 2023; Clark et al., 2020). Pedro et al. (2018) ran AMOC collapse experiments using CCSM3 (CESM's predecessor) to show that the heat reservoir during collapse events is actually north of the Atlantic Circumpolar Current (ACC) and not the oft-assumed Southern Ocean. They argue that eddy transport is necessary to move heat south across this dynamic barrier, which operates with a lag compared to the initial wind-driven response in ocean properties. To tease apart the mechanisms driving the initial subsurface cooling in the TightSO, as well as the subsequent rebound in subsurface ocean temperatures nearest the AIS, we examine the shift in winds and eddy transport across the ACC.
Generally, peak westerly winds are known to cause divergent surface flow that draws water up from below in a broad ring circling the continent (Morrison et al., 2015; Armour et al., 2016). This upwelling is well-captured in the 127ka climatology (Fig. A7). The sudden AMOC reduction and consequent changes in heat redistribution in 127kaFW cause changes in atmospheric circulation. Anomalous surface winds impart wind stress at the ocean surface, affecting ocean upwelling rates. The Southern Hemisphere westerlies strengthen and shift south by several degrees in the first few hundred years following freshwater forcing (not shown) and remain in their poleward-shifted position for the rest of the simulation (quivers in Fig. 8, second row). As the westerlies move southward, a band of negative wind stress curl anomalies encircles the continent (blue shades in Fig. 8, second row). This shift of westerlies ramps up over the first 500 years of the simulation and then remains fairly steady in magnitude and position thereafter (Fig. A7). In the Southern Hemisphere, negative wind stress curl anomalies enhance the upward vertical velocities in the subsurface ocean (Fig. A7). Furthermore, over the course of the first few hundred years of the 127kaFW simulation, the isopycnals shift deeper and steepen between 50 and 60° S (Fig. 10). As a result, colder temperatures are drawn upward along isopycnals from depth and brought toward the continent at the depth ranges most relevant to the ice sheet. Figure 10 shows an example cross-section at 30° E; the same picture applies to other locations and in the zonal mean.
In order to visualize the initial subsurface cooling in the Amundsen Sea, we extract a cross-section of the upper 1000 m of the water column (Fig. 8, bottom row). These cross-sections show that initially there is warming confined to the upper 150–200 m of the column, below which the ocean cools. Again, we see that maximum subsurface cooling in response to the freshwater forcing is reached within the first millennium. Further examination of the evolution of the ocean thermal structure during the initial 500 years of 127kaFW at a location off the shelf in the Amundsen Sea (110° W, 68.5° S) reveals warming above the thermocline and cooling below (Fig. 9a). Peak cold anomalies propagate upwards over time (black dots, panel b). The cooling trend peaks at around 1 km depth (Fig. 9c).
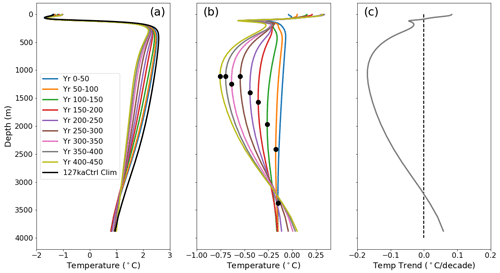
Figure 9Evolution of ocean thermal structure off the Amundsen Sea continental shelf (110° W, 68.5° S) in 127kaFW. Climatological temperature profile (black curve) for 127ka compared to 50-year means for the first 500 years (colors) (a). Panel (b) shows anomalies with respect to the 127ka control run. Black dots indicate the minimum temperature below the thermocline. Panel (c) shows the decadal temperature trend over the first 500 years. The dashed line indicates zero temperature trend.

Figure 10Temperature (colors) and isopycnal surfaces (white–gray–black contours) at the beginning of the run (mean of the first 50 years) and (a) several centuries into the run (300–350-year mean) (b), as well as the difference between the center and left panels (c). In the difference plot, solid lines show isopycnal surfaces at the start of the run, and dashed lines show the new position after ∼300 years of simulation time, with contour colors corresponding to the same isopycnal surface.
After the first millennium, warm Circumpolar Deep Water (CDW) moves toward the continent, reaching depths where ice shelf grounding lines are located (Fig. 8, top and bottom row). After about 3000 years, Amundsen Sea ocean temperatures near the AIS experience a net warming with respect to 127ka. Warming continues for the final 1000 years of the simulation.
Our simulations also suggest that the eddy component of the global MOC in the deep Southern Ocean intensifies quickly during the first millennium of the simulation and remains more vigorous (∼50 % increase) for the remainder of the simulation (Fig. 7b). In other words, the eddy-driven transport in the SO strengthens in the 127kaFW simulation. This mechanism, originally articulated in Pedro et al. (2018), is at least partly responsible for the longer-term warming trend that replaces the initial wind-driven cooling at depth near the AIS.
Peak warming during the LIG is believed to have occurred after the 4–5 kyr long Heinrich 11 event, though uncertainty remains in the length and timing of this event. Proxy data indicate global LIG warming of about 1 °C with respect to PI (Dutton et al., 2015) and about 1.6±0.9 °C at high latitudes relative to the present day (Turney et al., 2020; Capron et al., 2017; Hoffman et al., 2017). The CESM2-FV2 127ka run simulates global average air temperatures only marginally warmer (0.004 °C) than piControl (Fig. A1a). That climate models tend to estimate weaker LIG warming than proxies by about 1 °C is typical (Turney et al., 2020). Southern Ocean SSTs in CESM2 are warmer by about 0.1 °C, and over the Antarctic continent, annual near-surface air temperatures are warmer than PI by about 0.4 °C (Table 2).
With additional freshwater forcing in the North Atlantic in the 127kaFW simulation, a strong bipolar response is established within a few centuries and persists through the simulations. When compared to the available LIG proxy evidence (Fig. A1c), the model's bipolar seesaw air temperature response is exaggerated. This is particularly true in the NH, where modeled temperatures are colder than proxies by more than 5 °C (Fig. A1d). Similarly, three of the four ice core locations in the Southern Hemisphere are warmer in the model than the cores, while many Southern Ocean locations are warmer in the model than the proxy by more than 4 °C.
We note that while the 1° (CESM2-FV1) 127ka simulation produces a larger global temperature anomaly (0.11 °C) (Otto-Bliesner et al., 2020) than our 2° simulation (CESM2-FV2), our 2° run generates the same regional and seasonal patterns. Positive temperature anomalies are strongest in JJA over the Northern Hemisphere continents (upwards of 4 °C warmer than PI in large swaths of North America and Asia), while the strongest negative DJF anomalies occur over almost all large land features except Greenland. During 127ka, DJF global air temperatures are colder than PI by roughly 1 °C, and JJA temperatures are warmer by slightly more than 1 °C (Fig. A6). In DJF, the Arctic and parts of the Southern Ocean warm.
Changes in air temperature of even a few degrees are unlikely to significantly impact ice sheet mass balance, given the already cold continental climate. Instead, the ice–ocean interface of Antarctica was probably the primary driver of Antarctic mass loss in the past, as it is today (Noble et al., 2020).
Subsurface warming can reach up to 0.4 °C at some locations near the ice sheet in the 127ka simulation compared to piControl. This magnitude of change, though modest, could result in significant ice mass loss if persistent over long periods of time. In their ice sheet model experiments, for example, Turney et al. (2020) achieve WAIS collapse (4.5 m sea level equivalent mass loss) under only 1 °C ocean temperature forcing within 2 millennia. Berdahl et al. (2023) found that under ocean conditions comparable to today in the Amundsen sector, ice shelves lifted off key pinning points and unfettered retreat was initiated within 5 centuries. Given that today's Amundsen sector is likely warmer than PI by a few tenths of a degree, we argue that the modest CESM2 warming seen in the 127ka run provides a reasonable estimate of actual LIG warming. Future work might consider an analogous comparison between 127ka and a preceding period (rather than the pre-industrial) in order to further evaluate and understand orbitally driven subsurface warming.
Other recent work suggests that meltwater discharge from the AIS could amplify mass loss by stratifying the ocean column and trapping upwelling warm water beneath ice shelves, increasing the thermal forcing at the ice–ocean interface (Golledge et al., 2019). Studies using CESM (version 1) specifically test the impacts of AIS freshwater discharge by inputting freshwater at the ocean surface as icebergs (Pauling et al., 2017) or at the depth of the ice shelf fronts around the continent (Pauling et al., 2016). In both cases, the model generates subsurface warming near the AIS due to increased stratification of the water column and subsequent reduction of the sinking of cold continental shelf waters. We speculate that given the nonlinear response following loss of buttressing and the possibility of positive feedbacks due to local meltwater discharge, a small but persistent thermal forcing anomaly of ∼0.4 °C (as generated in the 127ka simulation) could cause significant mass loss over several millennia.
As noted, the PI mean state in CESM2 is known to be too warm in the subsurface Southern Ocean (Fig. A5). Also, the ocean model has a coarse 1° resolution and does not represent sub-shelf cavities. Therefore, plenty of uncertainty remains in whether the 127ka run simulates the correct magnitude of warming and whether it warms for the right reasons.
Instead of the freshwater forcing in 127kaFW amplifying Southern Ocean warming, we found that the 127kaFW simulation generates subsurface cooling in the high-latitude Southern Ocean near the AIS. This cooling is strongest in the first millennium, especially in high southern latitudes along the Antarctic coastline. Subsurface temperatures then rebound slowly, taking millennia to reach original values and in some cases not reaching original temperatures by the end of the 4000-year run. Subsurface ocean cooling at high southern latitudes in response to North Atlantic freshwater fluxes occurs in other model runs but has not been identified as a noteworthy dynamical response in previous work. However, it may be a robust feature of the system. For example, the CCSM4 iTrace (isotope-enabled) simulation (He et al., 2021) includes evolving freshwater fluxes in the North Atlantic that eventually spread to the Southern Ocean. This is meant to simulate the last deglaciation (Heinrich 1) from the Last Glacial Maximum (LGM; ∼20 ka) to the early Holocene (11 ka). We find that subsurface temperatures (upper 1000 m) in the TightSO cool slightly (∼0.1 °C) but persistently, lasting about a millennium, in response to the initial Atlantic freshwater fluxes in the simulation (Heinrich Stadial 1) (Fig. A8). This result is also seen in Zhu et al. (2022), who showed subsurface cooling (at 1 km depth) south of the ACC in response to the Heinrich 1 event (see their Fig. 5). In another PMIP4 Tier 1 lig127k-H11 simulation, which follows the same forcings prescribed in our experiments and in Otto-Bliesner et al. (2020), Guarino et al. (2023) observed cooling at a depth of 500 m in high southern latitudes following the freshwater forcing. They attributed these changes to increases in Antarctic sea ice area but acknowledged that the sea ice increase may be a result of the limited length of their simulations (250 years). In contrast, our freshwater experiment shows a decrease in Antarctic sea ice, resulting in about a ∼30 % loss, consistent with warming SSTs in the Southern Ocean. This reduction is consistent with the two-timescale sea ice response proposed by Ferreira et al. (2015) and with results from HadCM3 simulations of the Last Interglacial showing Antarctic sea ice reduction (Holloway et al., 2018). Sea ice proxy records for 128 ka show a significant reduction in winter sea ice extent (Holloway et al., 2017), consistent with both our 127ka and 127kaFW simulations.
The initial subsurface ocean cooling in our 127kaFW simulation is related to wind-driven changes in ocean circulation as a result of freshwater flux in the North Atlantic. As peak westerlies shift southward, isopycnals shift deeper and become steeper, drawing colder water from depth along isopycnals up to depths relevant to the ice sheet. This is followed by a slow rebound in subsurface temperatures as heat stored in the Southern Ocean north of the ACC is transported via eddies across this dynamic barrier. A comprehensive discussion of this mechanism of eddy propagation across the ACC can be found in Pedro et al. (2018).
Interestingly, simulations of future changes in the Southern Ocean show that increasing SH westerlies lead to subsurface cooling near the AIS, driven by similar mechanisms that we detail in our 127kaFW experiment. In an idealized wind-forcing experiment, Armour et al. (2016) use an ocean model (MITgcm) and find SST increases and subsurface cooling on the order of a few tenths of a degree in the Southern Ocean (their Fig. S12) in response to increased westerly winds. In an analysis of 19 climate models under a future warming scenario, Yin et al. (2011) show subsurface cooling in the high-latitude Southern Ocean. They attribute these changes to a southward shift of the westerlies, intensification of the ACC, Ekman-induced upwelling of cold deep waters, and blocked propagation of ocean warming signals.
What are the implications of this subsurface cooling in terms of WAIS collapse during the Last Interglacial? Based on our CESM2-FV2 simulations, the subsurface ocean conditions near the AIS are more favorable to melting at the ice–ocean interface in the 127ka simulation than in 127kaFW. While the actual freshwater forcing from Heinrich 11 was probably a significant driver of warming ocean temperatures in the real world (Clark et al., 2020), our study shows that, depending on timing and duration, freshwater forcing need not necessarily lead to greater thermal forcing of the ice sheet margin. Notably, although the global mean temperature response in this simulation is negligible, warming in the key Amundsen sector occurs at depths that are relevant to the ice sheet. This suggests that the possibility of WAIS collapse during the LIG, under conditions without freshwater forcing, should be further explored.
Finally, we emphasize that the connection between ice mass loss and ocean thermal forcing is complex. The factors that determine how heat is moved onto the continental shelf are not well observed and operate on many temporal and spatial scales (e.g., topography and slope of the continental shelf, eddy mixing, waves, presence and location of the Antarctic Slope Front, and proximity to CDW) (Noble et al., 2020). Recent studies of the Amundsen Sea (e.g., Naughten et al., 2021) and East Antarctica (e.g., Herraiz-Borreguero and Naveira Garabato, 2022), for example, use high-resolution models and observations to disentangle the complex relationship between wind forcing and subsurface warming. Once heat is on the continental shelf, it is a combination of processes that determines melt rates, including sub-shelf cavity circulation, bathymetry, tides (Jourdain et al., 2019), and millimeter-scale turbulence and convection at the ice–ocean boundary (Noble et al., 2020). Studies using high-resolution ocean modeling to capture sub-shelf circulation are emerging (e.g., Nakayama et al., 2018) and hold promise for developing a more comprehensive picture of the relationship between offshore ocean conditions and basal melt rates of the ice sheet.
This study analyzed two CESM2-FV2 paleoclimate simulations: one configured with Last Interglacial orbital and greenhouse forcing and another with additional freshwater forcing in the North Atlantic. We examined the global climate response with respect to the pre-industrial climate, with particular attention to climate conditions near the Antarctic ice sheet.
Despite the negligible change in global mean temperature during 127ka, ocean temperatures in 127ka increase by up to 0.4 °C compared to the pre-industrial at depths relevant to the margin of the Antarctic ice sheet. This increase in thermal forcing appears to be a robust Southern Ocean response to the insolation changes expected under LIG conditions. If applied to the grounding line at some key ice shelves for long enough, it may have melting potential. However, we cannot assume that 0.4 °C warming off the shelf translates to 0.4 °C sub-shelf warming. Rather, processes that transport warm water to the ice shelf are crucial to determining thermal forcing at the ice–ocean interface.
As expected, the addition of freshwater in 127kaFW causes AMOC collapse, reduction of northward Atlantic heat transport, and a resulting bipolar temperature response with a cooling NH and warming SH at the surface. Antarctic annual sea ice declines by about 1 million km2 within the first several centuries of the simulation, followed by a slower but steady decline throughout the rest of the simulation. Ocean heat content increases in all major ocean basins. However, in the high southern latitudes (TightSO), heat content decreases after the freshwater forcing begins. The atmospheric circulation shifts swiftly in response to the hosing and AMOC collapse. In the Southern Ocean, a poleward shift in peak westerlies remains shifted by several degrees latitude for the rest of the simulation. The surface wind anomalies lead to changes in wind stress curl and force changes in local ocean circulation. Negative wind stress curl anomalies near the AIS suggest deflection of surface waters to the left, allowing upwelling of colder subsurface water. The wind-driven subsurface cooling lasts for the first millennium of the simulation, after which temperatures rebound slowly but never recover to their original values in many locations around the AIS. The slow temperature rebound may be related to eddy propagation of heat across the ACC, supported by strengthening of the eddy component of the southern MOC cell.
There are implications for the thermal forcing (and thereby mass balance) of the AIS in this pair of simulations. Primarily, the orbital-only forced simulation generates more potential ocean thermal forcing at depths relevant to Antarctic ice sheet melt than the simulation that includes freshwater forcing. This was an unexpected result, but it appears to be a nonunique model response to freshwater forcing in the North Atlantic.
Based on these simulations, we suggest that the subsurface ocean response near the AIS in the 127ka run provides a more relevant analog to future climate than changes simulated by either the 127kaFW run or other simulations that include large freshwater fluxes in the North Atlantic. Future work includes forcing stand-alone ice sheet models with the thermal forcing anomalies from these simulations. This will allow a more complete assessment of the combined ocean–ice conditions of WAIS collapse. Another priority will be to work toward more realistic simulations of the Southern Ocean in future versions of CESM. Reducing the mean state biases in the PI simulations would reassure us that we are capturing the direction and magnitude of LIG anomalies. Finally, high-resolution ocean models are needed to link off-shelf warming to sub-shelf melting.
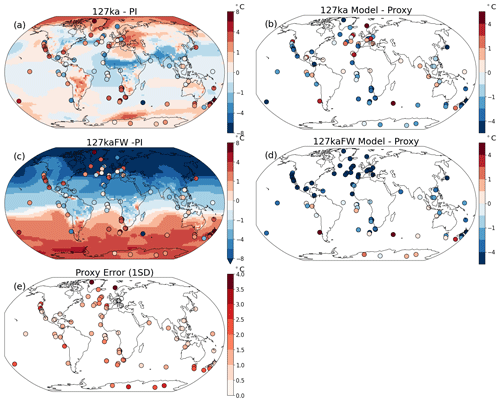
Figure A1Climatological 2 m air temperature anomaly with respect to piControl for 127ka (a) and 127kaFW (c). Climatologies are computed over the last 100 years of the simulations. Proxy data indicating anomalies between 127 ka and PI are overlain (data from Otto-Bliesner et al., 2020; Capron et al., 2017). The difference between the model climatology and proxy for 127ka (b) and for 127kaFW (d). Errors associated with proxies (1 SD – standard deviation) (e). Note that Antarctic proxies are scaled as in Fig. 2.

Figure A2127ka ocean temperature anomaly with respect to piControl for the ocean surface (a), 500 m depth (b), and 1500 m depth (c).
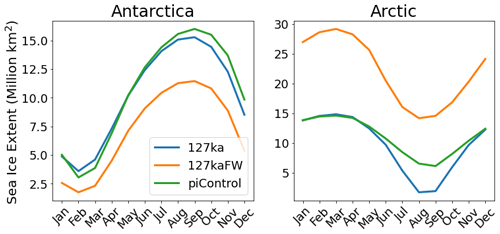
Figure A4Seasonal sea ice extent for the Antarctic and Arctic. Seasonal climatology for all three simulations is taken over the last 50 years of the simulation.
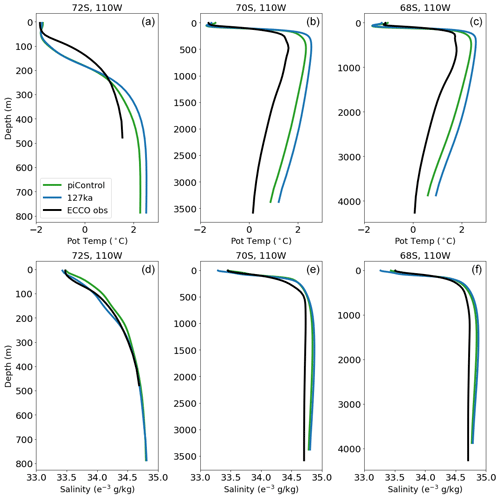
Figure A5Comparison of modeled (piControl and 127ka) and observed (Estimating the Circulation and Climate of the Ocean – ECCO) ocean temperature (a–c) and salinity (d–f) profiles at three locations off the Amundsen Sea coast. CESM2 has a (known) warm bias below the thermocline. Note: the y-axis range is different at each location (depending on whether it is on or off the continental shelf).
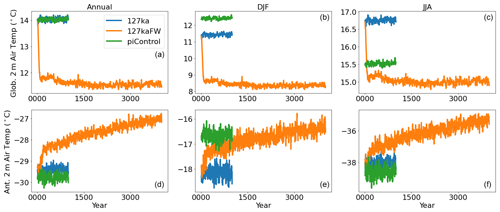
Figure A6Global (a–c) and Antarctic (d–f) 10-year running mean of annual (a, d), DJF (b, e), and JJA (c, f) 2 m air temperature. Colors indicate different simulations.
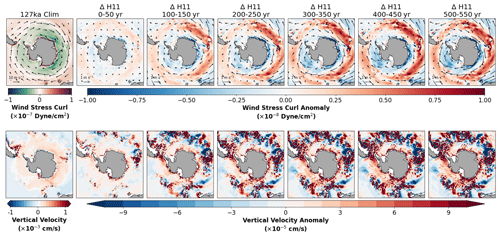
Figure A7Surface winds and wind stress curl (top row) as well as the vertical ocean velocity at 250 m depth (bottom row) over the first 500 years of the 127kaFW simulation. Left panels show 127ka climatology, while subsequent panels in each row indicate anomalies between 127kaFW and 127ka. 127kaFW snapshots are taken as 50-year means, as indicated in the top labels.
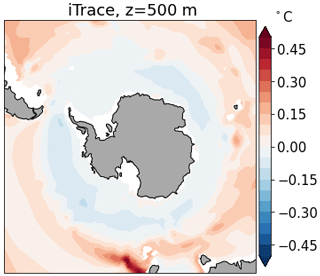
Figure A8iTrace ocean temperature anomaly at 500 m depth between the 50-year climatology at years 950–1000 and the 50-year climatology at the simulation start. This timeframe is chosen because it is the most analogous simulation period to our 127kaFW simulation. That is, it is the only period that is purely influenced by North Atlantic freshwater forcing. The rest of the iTrace run includes other forcings that complicate the response. For more on iTrace, see He et al. (2021).
CESM is an open-source code developed on the Earth System Community Model Portal (ESCOMP) Git repository at https://github.com/ESCOMP/CESM (ESCOMP, 2024). The CESM version used in this work was tagged as release-cesm2.1.1 and is available at https://doi.org/10.5065/D67H1H0V (NCAR, 2020).
The data for this paper are archived as follows: the Lig127 control data are located on the Research Data Archive (https://doi.org/10.5065/1K5C-SG05, NCAR, 2024a). The Lig127-H11 data are located on the Research Data Archive (https://doi.org/10.5065/PXM0-MC93, NCAR, 2024b). The 2deg PI data are available on the Earth System Grid Federation CMIP6 data archive (https://doi.org/10.22033/ESGF/CMIP6.11301, Danabasoglu, 2019).
MB wrote the manuscript with contributions from all authors. GL carried out the 127kaFW experiment extension beyond 1000 years. RT carried out the 127ka and the first 1000 years of the 127kaFW experiment. MB analyzed the data. ES, WL, and BOB supervised the project. All authors discussed the results and helped shape the research, analysis, and manuscript.
The contact author has declared that none of the authors has any competing interests.
Publisher's note: Copernicus Publications remains neutral with regard to jurisdictional claims made in the text, published maps, institutional affiliations, or any other geographical representation in this paper. While Copernicus Publications makes every effort to include appropriate place names, the final responsibility lies with the authors.
Computing and data storage resources for CISM simulations, including the Cheyenne supercomputer (https://doi.org/10.5065/D6RX99HX), were provided by the Computational and Information Systems Laboratory (CISL) at NSF NCAR.
This study was supported by National Science Foundation grants nos. 2045075 and 2044965. Gunter Leguy, William Lipscomb, Bette Otto-Bliesner, Esther Brady, and Bob Tomas were supported by the NSF National Center for Atmospheric Research, which is a major facility sponsored by the National Science Foundation under cooperative agreement no. 1852977.
This paper was edited by Marisa Montoya and reviewed by Joel B. Pedro and two anonymous referees.
Arias, P. A., Bellouin, N., Coppola, E., Jones, R. G., Krinner, G., Marotzke, J., Naik, V., Palmer, M. D., Plattner, G.-K., Rogelj, J., Rojas, M., Sillmann, J., Storelvmo, T., Thorne, P. W., Trewin, B., Rao, K. A., Adhikary, B., Allan, R. P., Armour, K., Bala, G. , Barimalala, R., Berger, S., Canadell, J. G., Cassou, C., Cherchi, A., Collins, W., Collins, W. D., Connors, S. L., Corti, S., Cruz, F., Dentener, F. J., Dereczynski, C., Luca, A. D., Niang, A. D., Doblas-Reyes, F. J., Dosio, A., Douville, H., Engelbrecht, F., Eyring, V., Fischer, E., Forster, P., Fox-Kemper, B., Fuglestvedt, J. S., Fyfe, J. C., Gillett, N. P., Goldfarb, L., Gorodetskaya, I., Gutierrez, J. M., Hamdi, R., Hawkins, E., Hewitt, H. T., Hope, P., Islam, A. S., Jones, C., Kaufman, D. S., Kopp, R. E., Kosaka, Y., Kossin, J., Krakovska, S., Lee, J.-Y., Li, J., Mauritsen, T., Maycock, T. K., Meinshausen, M., Min, S.-K., Monteiro, P. M. S., Ngo-Duc, T., Otto, F., Pinto, I., Pirani, A., Raghavan, K., Ranasinghe, R., Ruane, A. C., Ruiz, L., Sallée, J.-B., Samset, B. H., Sathyendranath, S., Seneviratne, S. I., Sörensson, A. A., Szopa, S., Takayabu, I., Tréguier, A.-M., van den Hurk, B., Vautard, R., von Schuckmann, K., Zaehle, S., Zhang, X., and Zickfeld, K.: Technical summary, in: Climate Change 2021: The Physical Science Basis: Working Group, Contribution to the Sixth Assessment Report of the Intergovernmental Panel on Climate Change, edited by: Masson-Delmotte, V. P., Zhai, A., Pirani, S. L., and Connors, C., Cambridge University Press, Cambridge, UK, 33–144, https://doi.org/10.1017/9781009157896.002, 2021. a, b
Armour, K. C., Marshall, J., Scott, J. R., Donohoe, A., and Newsom, E. R.: Southern Ocean warming delayed by circumpolar upwelling and equatorward transport, Nat. Geosci., 9, 549–554, 2016. a, b
Berdahl, M., Leguy, G., Lipscomb, W. H., Urban, N. M., and Hoffman, M. J.: Exploring ice sheet model sensitivity to ocean thermal forcing and basal sliding using the Community Ice Sheet Model (CISM), The Cryosphere, 17, 1513–1543, https://doi.org/10.5194/tc-17-1513-2023, 2023. a, b
Bitz, C. M., Chiang, J. C. H., Cheng, W., and Barsugli, J. J.: Rates of thermohaline recovery from freshwater pulses in modern, Last Glacial Maximum, and greenhouse warming climates, Geophys. Res. Lett., 34, L07708, https://doi.org/10.1029/2006GL029237, 2007. a
Böhm, E., Lippold, J., Gutjahr, M., Frank, M., Blaser, P., Antz, B., Fohlmeister, J., Frank, N., Andersen, M., and Deininger, M.: Strong and deep Atlantic meridional overturning circulation during the last glacial cycle, Nature, 517, 73–76, 2015. a, b
Brown, N. and Galbraith, E. D.: Hosed vs. unhosed: interruptions of the Atlantic Meridional Overturning Circulation in a global coupled model, with and without freshwater forcing, Clim. Past, 12, 1663–1679, https://doi.org/10.5194/cp-12-1663-2016, 2016. a
Buizert, C., Fudge, T. J., Roberts, W. H. G., Steig, E. J., Sherriff-Tadano, S., Ritz, C., Lefebvre, E., Edwards, J., Kawamura, K., Oyabu, I., Motoyama, H., Kahle, E. C., Jones, T. R., Abe-Ouchi, A., Obase, T., Martin, C., Corr, H., Severinghaus, J. P., Beaudette, R., Epifanio, J. A., Brook, E. J., Martin, K., Chappellaz, J., Aoki, S., Nakazawa, T., Sowers, T. A., Alley, R. B., Ahn, J., Sigl, M., Severi, M., Dunbar, N. W., Svensson, A., Fegyveresi, J. M., He, C., Liu, Z., Zhu, J., Otto-Bliesner, B. L., Lipenkov, V. Y., Kageyama, M., and Schwander, J.: Antarctic surface temperature and elevation during the Last Glacial Maximum, Science, 372, 1097–1101, https://doi.org/10.1126/science.abd2897, 2021. a, b
Capron, E., Govin, A., Feng, R., Otto-Bliesner, B. L., and Wolff, E.: Critical evaluation of climate syntheses to benchmark CMIP6/PMIP4 127 ka Last Interglacial simulations in the high-latitude regions, Quaternary Sci. Rev., 168, 137–150, 2017. a, b, c, d, e, f, g
Clark, P. U., He, F., Golledge, N. R., Mitrovica, J. X., Dutton, A., Hoffman, J. S., and Dendy, S.: Oceanic forcing of penultimate deglacial and last interglacial sea-level rise, Nature, 577, 660–664, 2020. a, b, c, d, e
Colville, E. J., Carlson, A. E., Beard, B. L., Hatfield, R. G., Stoner, J. S., Reyes, A. V., and Ullman, D. J.: Sr-Nd-Pb isotope evidence for ice-sheet presence on southern Greenland during the Last Interglacial, Science, 333, 620–623, 2011. a
Dahl-Jensen, D., Gogineni, P., and White, J.: Reconstruction of the last interglacial period from the NEEM ice core, Inside Pages, 53 pp., https://digitalcommons.usf.edu/pages/53 (last access: 22 October 2024), 2013. a
Danabasoglu, G.: NCAR CESM2-FV2 model output prepared for CMIP6 CMIP piControl, Earth System Grid Federation [data set], https://doi.org/10.22033/ESGF/CMIP6.11301, 2019. a
Danabasoglu, G., Lamarque, J.-F., Bacmeister, J., Bailey, D., DuVivier, A., Edwards, J., Emmons, L., Fasullo, J., Garcia, R., Gettelman, A., Hannay, C., Holland, M. M., Large, W. G., Lauritzen, P. H., Lawrence, D. M., Lenaerts,J. T. M., Lindsay, K., Lipscomb, W. H., Mills, M. J., Neale, R., Oleson, K. W., Otto-Bliesner, B., Phillips, A. S., Sacks, W., Tilmes, S., van Kampenhout, L., Vertenstein, M., Bertini, A., Dennis, J., Deser, C., Fischer, C., Fox-Kemper, B., Kay, J. E., Kinnison, D., Kushner, P. J., Larson, V. E., Long, M. C., Mickelson, S., Moore, J. K., Nienhouse, E., Polvani, L., Rasch, P. J., and Strand, W. G.: The community earth system model version 2 (CESM2), J. Adv. Model. Earth Syst., 12, e2019MS001916, https://doi.org/10.1029/2019MS001916, 2020. a, b
DeConto, R. M. and Pollard, D.: Contribution of Antarctica to past and future sea-level rise, Nature, 531, 59–597, https://doi.org/0.1038/nature17145, 2016. a
de Vernal, A. and Hillaire-Marcel, C.: Natural variability of Greenland climate, vegetation, and ice volume during the past million years, Science, 320, 1622–1625, 2008. a
Ditlevsen, P. and Ditlevsen, S.: Warning of a forthcoming collapse of the Atlantic meridional overturning circulation, Nat. Commun., 14, 1–12, 2023. a
Dutton, A., Carlson, A. E., Long, A. J., Milne, G. A., Clark, P. U., DeConto, R., Horton, B. P., Rahmstorf, S., and Raymo, M. E.: Sea-level rise due to polar ice-sheet mass loss during past warm periods, Science, 349, aaa4019, https://doi.org/10.1126/science.aaa4019, 2015. a, b, c, d, e
ESCOMP: CESM, GitHub [code], https://github.com/ESCOMP/CESM (last access: 22 October 2024), 2024. a
Ferreira, D., Marshall, J., Bitz, C. M., Solomon, S., and Plumb, A.: Antarctic Ocean and sea ice response to ozone depletion: A two-time-scale problem, J. Climate, 28, 1206–1226, 2015. a
Fischer, H., Meissner, K. J., Mix, A. C., Abram, N. J., Austermann, J., Brovkin, V., Capron, E., Colombaroli, D., Daniau, A., Dyez, K. A., Felis, T., Finkelstein, S. A., Jaccard, S. L., McClymont, E. L., Rovere, A., Sutter, J., Wolff, E. W., Affolter, S., Bakker, P., JBallesteros-Cánovas, J. A., Barbante, C., Caley, T., Carlson, A. E., Churakova (Sidorova), O., Cortese, G., Cumming, B. F., Davis, B. A. S., de Vernal, A., Emile-Geay, J., Fritz, S. C., Gierz, P., Gottschalk, J., Holloway, M. D., Joos, F., Kucera, M., Loutre, M.-F., Lunt, D. J., Marcisz, K., Marlon, J. R., Martinez, P., Masson-Delmotte, V., Nehrbass-Ahles, C., Otto-Bliesner, B. L., Raible, C. C., Risebrobakken, B., Sánchez Goñi, M. F., Saleem Arrigo, J., Sarnthein, M., Sjolte, J., Stocker, T. F., Velasquez Alvárez, P. A., Tinner, W., Valdes, P. J., Vogel, H., Wanner, H., Yan, Q., Yu, Z., Ziegler, M., and Zhou, L.: Palaeoclimate constraints on the impact of 2 °C anthropogenic warming and beyond, Nat. Geosci., 11, 474—85, https://doi.org/10.1038/s41561-018-0146-0, 2018. a
Garbe, J., Albrecht, T., Levermann, A., Donges, J. F., and Winkelmann, R.: The hysteresis of the Antarctic ice sheet, Nature, 585, 538–544, 2020. a
Goelzer, H., Huybrechts, P., Loutre, M.-F., and Fichefet, T.: Impact of ice sheet meltwater fluxes on the climate evolution at the onset of the Last Interglacial, Clim. Past, 12, 1721–1737, https://doi.org/10.5194/cp-12-1721-2016, 2016. a
Golledge, N. R., Keller, E. D., Gomez, N., Naughten, K. A., Bernales, J., Trusel, L. D., and Edwards, T. L.: Global environmental consequences of twenty-first-century ice-sheet melt, Nature, 566, 65–72, 2019. a
Guarino, M. V., Sime, L. C., Diamond, R., Ridley, J., and Schroeder, D.: The coupled system response to 250 ears of freshwater forcing: Last Interglacial CMIP6–PMIP4 HadGEM3 simulations, Clim. Past, 19, 865–881, https://doi.org/10.5194/cp-19-865-2023, 2023. a, b
He, C., Liu, Z., Otto-Bliesner, B. L., Brady, E. C., Zhu, C., Tomas, R., Buizert, C., and Severinghaus, J. P.: Abrupt Heinrich Stadial 1 cooling missing in Greenland oxygen isotopes, Sci. Adv., 7, eabh1007, https://doi.org/10.1126/sciadv.abh1007, 2021. a, b, c
Herraiz-Borreguero, L. and Naveira Garabato, A. C.: Poleward shift of circumpolar deep water threatens the East Antarctic Ice Sheet, Nat. Clim. Change, 12, 728–734, 2022. a
Hoffman, J. S., Clark, P. U., Parnell, A. C., and He, F.: Regional and global sea-surface temperatures during the last interglaciation, Science, 355, 276–279, 2017. a
Holloway, M. D., Sime, L. C., Allen, C. S., Hillenbrand, C.-D., Bunch, P., Wolff, E., and Valdes, P. J.: The spatial structure of the 128 ka Antarctic sea ice minimum, Geophys. Res. Lett., 44, 11–129, 2017. a
Holloway, M. D., Sime, L. C., Singarayer, J. S., Tindall, J. C., and Valdes, P. J.: Simulating the 128-ka Antarctic Climate Response to Northern Hemisphere Ice Sheet Melting Using the Isotope-Enabled HadCM3, Geophys. Res. Lett., 45, 11–921, 2018. a
Jourdain, N. C., Molines, J.-M., Le Sommer, J., Mathiot, P., Chanut, J., de Lavergne, C., and Madec, G.: Simulating or prescribing the influence of tides on the Amundsen Sea ice shelves, Ocean Model., 133, 44–55, 2019. a
Kahle, E. C., Steig, E. J., Jones, T. R., Fudge, T. J., Koutnik, M. R., Morris, V. A., Vaughn, B. H., Schauer, A. J., Stevens, C. M., Conway, H., Waddington, E. D., Buizert, C., Epifanio, J., and White, J. W. C.: Reconstruction of Temperature, Accumulation Rate, and Layer Thinning From an Ice Core at South Pole, Using a Statistical Inverse Method, J. Geophys. Res.-Atmos., 126, e2020JD033300, https://doi.org/10.1029/2020JD033300, 2021. a, b
Kaspar, F., Kühl, N., Cubasch, U., and Litt, T.: A model-data comparison of European temperatures in the Eemian interglacial, Geophys. Res. Lett., 32, L11703, https://doi.org/10.1029/2005GL022456, 2005. a
Landais, A., Masson-Delmotte, V., Capron, E., Langebroek, P. M., Bakker, P., Stone, E. J., Merz, N., Raible, C. C., Fischer, H., Orsi, A., Prié, F., Vinther, B., and Dahl-Jensen, D.: How warm was Greenland during the last interglacial period?, Clim. Past, 12, 1933–1948, https://doi.org/10.5194/cp-12-1933-2016, 2016. a
Lau, S. C. Y., Wilson, N. G., Golledge, N. R., Naish, T. R., Watts, P. C., Silva, C. N. S., Cooke, I. R., Allcock, A. L., Mark, F. C., Linse, K., and Strugnell, J. M.: Genomic evidence for West Antarctic Ice Sheet collapse during the Last Interglacial, Science, 382, 1384–1389, https://doi.org/10.1126/science.ade0664, 2023. a
Lipscomb, W. H., Price, S. F., Hoffman, M. J., Leguy, G. R., Bennett, A. R., Bradley, S. L., Evans, K. J., Fyke, J. G., Kennedy, J. H., Perego, M., Ranken, D. M., Sacks, W. J., Salinger, A. G., Vargo, L. J., and Worley, P. H.: Description and evaluation of the Community Ice Sheet Model (CISM) v2.1, Geosci. Model Dev., 12, 387–424, https://doi.org/10.5194/gmd-12-387-2019, 2019. a
Lipscomb, W. H., Leguy, G. R., Jourdain, N. C., Asay-Davis, X., Seroussi, H., and Nowicki, S.: ISMIP6-based projections of ocean-forced Antarctic Ice Sheet evolution using the Community Ice Sheet Model, The Cryosphere, 15, 633–661, https://doi.org/10.5194/tc-15-633-2021, 2021. a
Luo, F., Ying, J., Liu, T., and Chen, D.: Origins of Southern Ocean warm sea surface temperature bias in CMIP6 models, npj Clim. Atmos. Sci., 6, 127, https://doi.org/10.1038/s41612-023-00456-6, 2023. a
Marino, G., Rohling, E., Rodríguez-Sanz, L., Grant, K., Heslop, D., Roberts, A., Stanford, J., and Yu, J.: Bipolar seesaw control on last interglacial sea level, Nature, 522, 197–201, 2015. a, b
Marshall, J. and Speer, K.: Closure of the meridional overturning circulation through Southern Ocean upwelling, Nat. Geosci., 5, 171–180, 2012. a
Masson-Delmotte, V., Buiron, D., Ekaykin, A., Frezzotti, M., Gallée, H., Jouzel, J., Krinner, G., Landais, A., Motoyama, H., Oerter, H., Pol, K., Pollard, D., Ritz, C., Schlosser, E., Sime, L. C., Sodemann, H., Stenni, B., Uemura, R., and Vimeux, F.: A comparison of the present and last interglacial periods in six Antarctic ice cores, Clim. Past, 7, 397–423, https://doi.org/10.5194/cp-7-397-2011, 2011. a
Masson-Delmotte, V., Steen-Larsen, H. C., Ortega, P., Swingedouw, D., Popp, T., Vinther, B. M., Oerter, H., Sveinbjornsdottir, A. E., Gudlaugsdottir, H., Box, J. E., Falourd, S., Fettweis, X., Gallée, H., Garnier, E., Gkinis, V., Jouzel, J., Landais, A., Minster, B., Paradis, N., Orsi, A., Risi, C., Werner, M., and White, J. W. C.: Recent changes in north-west Greenland climate documented by NEEM shallow ice core data and simulations, and implications for past-temperature reconstructions, The Cryosphere, 9, 1481–1504, https://doi.org/10.5194/tc-9-1481-2015, 2015. a
Morrison, A. K., Frölicher, T. L., and Sarmiento, J. L.: Upwelling in the southern ocean, Phys. Today, 68, 27–32, 2015. a
Nakayama, Y., Menemenlis, D., Zhang, H., Schodlok, M., and Rignot, E.: Origin of Circumpolar Deep Water intruding onto the Amundsen and Bellingshausen Sea continental shelves, Nat. Commun., 9, 1–9, 2018. a
Naughten, K. A., De Rydt, J., Rosier, S. H., Jenkins, A., Holland, P. R., and Ridley, J. K.: Two-timescale response of a large Antarctic ice shelf to climate change, Nat. Commun., 12, 1–10, 2021. a
NCAR: Community Earth System Model 2 (CESM2), NCAR [code], https://doi.org/10.5065/D67H1H0V, 2020. a
NCAR: CESM2 Last Interglacial at 127ka control, NCAR [data set], https://doi.org/10.5065/1K5C-SG05, 2024a. a
NCAR: CESM2 lig127ka FW simulations, NCAR [data set], https://doi.org/10.5065/PXM0-MC93, 2024b. a
Noble, T. L., Rohling, E. J., Aitken, A. R. A., Bostock, H. C., Chase, Z., Gomez, N., Jong, L. M., King, M. A., Mackintosh, A. N., McCormack, F. S., McKay, R. M., Menviel, L., Phipps, S. J., Weber, M. E., Fogwill, C. J., Gayen, B., Golledge, N. R., Gwyther, D. E., McHogg, A. C., Martos, Y. M., Pena-Molino, B., Roberts, J., van de Flierdt, T., and Williams, T.: The sensitivity of the Antarctic ice sheet to a changing climate: past, present, and future, Rev. Geophys., 58, e2019RG000663, https://doi.org/10.1029/2019RG000663, 2020. a, b, c
Otto-Bliesner, B. L., Rosenbloom, N., Stone, E. J., McKay, N. P., Lunt, D. J., Brady, E. C., and Overpeck, J. T.: How warm was the last interglacial? New model–data comparisons, Philos. T. Roy. Soc. A, 371, 20130097, https://doi.org/10.1098/rsta.2013.0097, 2013. a
Otto-Bliesner, B. L., Braconnot, P., Harrison, S. P., Lunt, D. J., Abe-Ouchi, A., Albani, S., Bartlein, P. J., Capron, E., Carlson, A. E., Dutton, A., Fischer, H., Goelzer, H., Govin, A., Haywood, A., Joos, F., LeGrande, A. N., Lipscomb, W. H., Lohmann, G., Mahowald, N., Nehrbass-Ahles, C., Pausata, F. S. R., Peterschmitt, J.-Y., Phipps, S. J., Renssen, H., and Zhang, Q.: The PMIP4 contribution to CMIP6 – Part 2: Two interglacials, scientific objective and experimental design for Holocene and Last Interglacial simulations, Geosci. Model Dev., 10, 3979–4003, https://doi.org/10.5194/gmd-10-3979-2017, 2017. a
Otto-Bliesner, B. L., Brady, E. C., Tomas, R. A., Albani, S., Bartlein, P. J., Mahowald, N. M., Shafer, S. L., Kluzek, E., Lawrence, P. J., Leguy, G., and Rothstein, M.: A comparison of the CMIP6 midHolocene and lig127k simulations in CESM2, Paleoceanogr. Paleoclim., 35, e2020PA003957, https://doi.org/10.1029/2020PA003957, 2020. a, b, c, d, e, f, g, h, i, j, k, l, m, n, o, p, q
Otto-Bliesner, B. L., Brady, E. C., Zhao, A., Brierley, C. M., Axford, Y., Capron, E., Govin, A., Hoffman, J. S., Isaacs, E., Kageyama, M., Scussolini, P., Tzedakis, P. C., Williams, C. J. R., Wolff, E., Abe-Ouchi, A., Braconnot, P., Ramos Buarque, S., Cao, J., de Vernal, A., Guarino, M. V., Guo, C., LeGrande, A. N., Lohmann, G., Meissner, K. J., Menviel, L., Morozova, P. A., Nisancioglu, K. H., O'ishi, R., Salas y Mélia, D., Shi, X., Sicard, M., Sime, L., Stepanek, C., Tomas, R., Volodin, E., Yeung, N. K. H., Zhang, Q., Zhang, Z., and Zheng, W.: Large-scale features of Last Interglacial climate: results from evaluating the lig127k simulations for the Coupled Model Intercomparison Project (CMIP6)–Paleoclimate Modeling Intercomparison Project (PMIP4), Clim. Past, 17, 63–94, https://doi.org/10.5194/cp-17-63-2021, 2021. a
Oyabu, I., Kawamura, K., Buizert, C., Parrenin, F., and Uemura, R.: Surface temperature at Dome Fuji during the last interglacial period, in: AGU Fall Meeting Abstracts, vol. 2023, 11–15 December 2023, San Francisco, CA, C44A-01, 2023. a
Pauling, A. G., Bitz, C. M., Smith, I. J., and Langhorne, P. J.: The response of the Southern Ocean and Antarctic sea ice to freshwater from ice shelves in an Earth system model, J. Climate, 29, 1655–1672, 2016. a
Pauling, A. G., Smith, I. J., Langhorne, P. J., and Bitz, C. M.: Time-dependent freshwater input from ice shelves: Impacts on Antarctic sea ice and the Southern Ocean in an Earth System Model, Geophys. Res. Lett., 44, 10454–10461, 2017. a
Pedro, J. B., Jochum, M., Buizert, C., He, F., Barker, S., and Rasmussen, S. O.: Beyond the bipolar seesaw: Toward a process understanding of interhemispheric coupling, Quaternary Sci. Rev., 192, 27–46, 2018. a, b, c, d
Scherer, R. P., Aldahan, A., Tulaczyk, S., Possnert, G., Engelhardt, H., and Kamb, B.: Pleistocene Collapse of the West Antarctic Ice Sheet, Science, 281, 82–85, https://doi.org/10.1126/science.281.5373.82, 1998. a
Steig, E. J., Huybers, K., Singh, H. A., Steiger, N. J., Ding, Q., Frierson, D. M. W., Popp, T., and White, J. W. C.: Influence of West Antarctic Ice Sheet collapse on Antarctic surface climate, Geophys. Res. Lett., 42, 4862–4868, https://doi.org/10.1002/2015GL063861, 2004. a
Stewart, A. L. and Thompson, A. F.: Sensitivity of the ocean's deep overturning circulation to easterly Antarctic winds, Geophys. Res. Lett., 39, L18604, https://doi.org/10.1029/2012GL053099, 2012. a
Stocker, T. F. and Johnsen, S. J.: A minimum thermodynamic model for the bipolar seesaw, Paleoceanography, 18, 1087, https://doi.org/10.1029/2003PA000920, 2003. a
Sutter, J., Gierz, P., Grosfeld, K., Thoma, M., and Lohmann, G.: Ocean temperature thresholds for last interglacial West Antarctic Ice Sheet collapse, Geophys. Res. Lett., 43, 2675–2682, 2016. a
Turney, C. S., Fogwill, C. J., Golledge, N. R., McKay, N. P., van Sebille, E., Jones, R. T., Etheridge, D., Rubino, M., Thornton, D. P., Davies, S. M., and Ramsey, C. B.: Early Last Interglacial ocean warming drove substantial ice mass loss from Antarctica, P. Natl. Acad. Sci. USA, 117, 3996–4006, 2020. a, b, c, d
Yau, A. M., Bender, M. L., Robinson, A., and Brook, E. J.: Reconstructing the last interglacial at Summit, Greenland: Insights from GISP2, P. Natl. Acad. Sci. USA, 113, 9710–9715, 2016. a
Yeung, N. K.-H., Menviel, L., Meissner, K. J., Choudhury, D., Ziehn, T., and Chamberlain, M. A.: Last Interglacial subsurface warming on the Antarctic shelf triggered by reduced deep-ocean convection, Commun. Earth Environ., 5, 212, https://doi.org/10.1038/s43247-024-01383-x, 2024. a, b, c, d
Yin, J., Overpeck, J. T., Griffies, S. M., Hu, A., Russell, J. L., and Stouffer, R. J.: Different magnitudes of projected subsurface ocean warming around Greenland and Antarctica, Nat. Geosci., 4, 524–528, 2011. a
Zhu, C., Zhang, J., Liu, Z., Otto-Bliesner, B. L., He, C., Brady, E. C., Tomas, R., Wen, Q., Li, Q., Zhu, C., and Zhang, S.: Antarctic Warming during Heinrich Stadial 1 in a Transient Isotope-Enabled Deglacial Simulation, J. Climate, 35, 7353–7365, 2022. a
Ziehn, T., Chamberlain, M. A., Law, R. M., Lenton, A., Bodman, R. W., Dix, M., Stevens, L., Wang, Y.-P., and Srbinovsky, J.: The Australian earth system model: ACCESS-ESM1.5, J. South. Hemisph. Earth Syst. Sci., 70, 193–214, 2020. a


