the Creative Commons Attribution 4.0 License.
the Creative Commons Attribution 4.0 License.
 | 11 Oct 2024
The spatio-temporal evolution of the Chongzhen drought (1627–1644) in China and its impact on famine
Siying Chen
Yun Su
Xudong Chen
Liang Emlyn Yang
Investigations of past extreme climate events offer insights into the interactions between natural forces, ecosystems, and human societies. The Chongzhen drought, which occurred from 1627 to 1644 CE, stands as possibly the most severe drought in central and eastern China over the last 1500 years, remarkable for its duration and extent and the vast number of people affected. Concurrently, a widespread famine emerged, triggering peasant uprisings that are argued as having contributed to the Ming Dynasty's downfall. This study extracted 1802 drought records and 1977 famine records from Chinese historical documents to reconstruct the spatio-temporal progression of the drought and its impact on famine. The records provided drought information of season, duration, and intensity, which enabled a classification of four drought severity levels. Then kernel density estimation reconstructed the spatial pattern of drought and the drought kernel density index (DKDI) series in sub-regions. Between 1627 and 1644, the drought affected most of central and eastern China. The severe drought zone was mainly located north of 29° N, shifting from the northwestern region to the northern region and then expanding to the south. The development of drought in different regions was not synchronized. The northwestern region faced the earliest drought outbreak, which eased in the middle period and peaked in 1640. The northern region's DKDI series forms a single-peaked curve, indicating a gradual aggravation of the drought from 1633 to 1640. The Yangtze–Huai region's DKDI series shows a multi-peaked curve, with repeated cycles of worsening and easing drought, peaking in 1641. Furthermore, the reconstruction of the spatio-temporal progression of famine revealed overlapped ranges and similar development trends to that of the drought. The years marking the peak of the famine kernel density index (FKDI) in the northwestern region, northern region, and Yangtze–Huai region coincided with those of the DKDI. Regression analysis identified drought as the primary factor triggering famine, accounting for approximately 67.3 % of its occurrence. In the northern region, the contribution of drought was higher (73.4 %). Series and correlation analyses indicate a continuity in drought's impacts on famine. This paper further clarifies the dominant pathway of climate impact transmission in this case: extreme drought → declining agricultural harvest → food shortage → famine. Other natural and socio-economic factors, such as locust infestations, nomadic invasions, and economic decline, also played a role in the occurrence of famine. Human response measures were instrumental in regulating the transmission of climate change impacts.
- Article
(10915 KB) - Full-text XML
- BibTeX
- EndNote


Climate change, as the most dynamic component of the Earth system, serves as a crucial backdrop for the evolution of human civilization. Numerous studies have highlighted the profound impacts of climate change on agricultural production (Wright and Thorpe, 2003; Yin et al., 2015; Zhang et al., 2021; Chen et al., 2021), human health (Anthony et al., 2006), migration (Büntgen et al., 2016), economic development (Pei et al., 2013), social rise and fall (Pederson et al., 2014; Yancheva et al., 2007; Zhang and Lu, 2007; Yin et al., 2016), and the collapse of civilizations (Harvey and Bradley, 2001; Cullen et al., 2000; Buckley et al., 2010; Haug et al., 2003). The interaction between climate change and human societies on different timescales represents a vital research area of global change. Investigations into significant historical extreme weather events and their societal impacts are instrumental in understanding such interactions (PAGES, 2009; Yang et al., 2019).
Drought, characterized as an extreme climatic event, may intensify the conflicts between humans and the environment at different timescales, influencing the trajectory of civilizational development. Prolonged droughts contributed to the collapse of the Classic Maya civilization (Medina-Elizalde and Rohling, 2012; Douglas et al., 2015); the migration of the Anasazi population (Benson et al., 2007); and the demise of Angkor, the capital of the Khmer Empire (Buckley et al., 2014). In China, drought is the most frequent natural disaster, with 1074 recorded drought disasters from 1766 BCE to 1937 CE (Li et al., 2003; Deng, 2012). In historical times when agricultural harvests depended heavily on climatic conditions, long-lasting and widespread drought events declined food production and thus were likely to trigger famine (Teng et al., 2014; Tian et al., 2022, 2024). Defined as a state of extensive hunger resulting from a lack of food, famine denotes a crisis in food security. Famines may further lead to consequences like displacement, plague outbreaks, and social unrest. Historically, the large-scale peasantry uprisings in China in the late Eastern Han (180s), late Sui (610s), late Tang (860–880s), late Ming (1620–1640s), and late Qing dynasties (1840–1860s, 1890–1900s) all erupted in the context of extreme drought and famines (Ge, 2011; Fang et al., 2024), most of which played a critical role in dynasties changing. In sum, famine is a significant manifestation of the adverse effects of climate change reaching the human system. It also serves as a vital link in the chain of transmission of these effects to the economic, political, and military domains, which is particularly evident in agrarian societies.
The years 1627–1644 CE saw an extraordinary and extreme drought in China, known as the “Chongzhen drought” because it coincided with the last period of the Ming Dynasty (1368–1644 CE), the Chongzhen Emperor's reign. This drought has been corroborated by natural evidence of stalagmites, tree rings, sporopollenin, and historical documents (Zhang et al., 2008, 2017; Tan et al., 2011a; Fang et al., 2012). This period is characterized by weak monsoon activity and a dry climate, likely influenced by phenomena such as El Niño events and violent volcanic eruptions (Shen et al., 2007; Liu et al., 2014; Yue et al., 2024). The Chongzhen megadrought is potentially the most severe drought in eastern China during the past 1500 years, and its duration and geographical extent, as well as the number of affected people, were rare in history (Tan, 2003; Zheng et al., 2006; Peng and Xu, 2009). The drought led to a decline in food production, which triggered a widespread and enduring famine, manifesting as food shortages, food substitution, displacement, starving to death, and the breakdown of social order. A large number of famine victims joined the peasant uprising army, which played a pivotal role in the collapse of the Ming Dynasty (Zheng et al., 2014; Fang et al., 2024). The progression of the Peasants' War was also closely related to the development of the famine (Cao, 2019).
Several studies have examined the duration, extent, and progression of the Chongzhen drought (Chinese Academy of Meteorological Sciences, 1981; Y. Chen, 1991; Fang, 2006; Liu et al., 2014; Tan, 2001; Guo, 2014), yet many of these lacked detailed spatial and temporal resolution or concentrated solely on limited areas. There is still a shortfall in research offering yearly temporal resolution for drought reconstruction that at the same time encompasses the entire affected region. Regarding the impacts of the Chongzhen drought, existing research has mainly focused on historical accounts, particularly highlighting the drought as a catalyst for peasantry uprising (Cao, 2019; Chen, 2006; Zheng et al., 2014; Wang et al., 2010; Chen and Zhu, 2003; Li, 1999). However, the specific processes and mechanisms through which drought impacts were transmitted to the human system remain poorly understood, with an absence of quantitative or semi-quantitative analyses.
In the case of the Chongzhen drought, the drought represented a manifestation of the natural system, whereas famine emerged as a typical manifestation of the human system. This study therefore concentrates on these two critical aspects to investigate the transmission of extreme climate impacts. We extracted drought records from Chinese historical documents from 1627 to 1644 and divided them into different levels based on semantic differences. To illustrate the spatial and temporal development, we employed kernel density estimation, creating a year-by-year spatial pattern of drought and the series of drought kernel density index (DKDI) across various regions. A similar approach was taken for famine records. By comparing the spatio-temporal patterns of drought and famine and conducting statistical analysis, we investigate their interconnection and how drought precipitates famine. The study area is the region of China with recorded droughts during this period, represented by the coloured portion in Fig. 1a, which was further divided into five subregions based on physical geography and socio-economic distinctions. Figure 1b shows the natural overview of the study area.

Figure 1Map of the study area. (a) The location of the study area and subregions. (b) DEM of the study area with main rivers and lakes shown.
2.1 Data source
Historical documents are invaluable proxies for reconstructing past climate change, with the advantages of high temporal resolution, location accuracy, and clarity of climatic significance (Pfister et al., 2008). China owns a wealth of historical documents lasting for thousands of years without interruption. In recent decades, meteorological departments and scholars have mined these documents for climate- and disaster-related records, assembling them into comprehensive historical data collections. Records related to disasters within the study area during 1627–1644 were extracted from 24 collections (see Appendix A). The records were organized into six fields: year, location, province, content, source, and original document provenance, thereby establishing a detailed database of disasters in eastern central China from 1627 to 1644. The “year” field was standardized to the Common Era notation of the Gregorian calendar. The “location” was updated to reflect current place names, guided by The Historical Atlas of China (Tan, 1982), with counties serving as the basic geographic administrative units. For the “province” field, the current administrative divisions of the People's Republic of China were applied. For example, there is an item of record with the ancient place name Wuding, corresponding to modern Huimin County in Shandong Province. Hence, the “location” of this record is noted as Huimin County and the “province” as Shandong Province. The “content” is the text description regarding disasters. The “source” refers to the name of the collection where the record came from. The “original document provenance” mainly includes local chronicles, the History of Ming, and Ming Shilu. Records sharing the same year and location were merged, resulting in a database comprising 6282 entries.
2.2 Processing of drought records
All records directly related to drought were extracted from the database, totalling 1802 entries. The contents of these drought records can be divided into four categories: (1) precipitation, which often includes details about the season or month, e.g. “late spring rains” and “no rain in June”; (2) hydrology concerning rivers, lakes, springs, and groundwater, e.g. “the river is shallow enough to walk through”, “wells dry up”, “the lake's bottom is bursting”; (3) plant growth, e.g. “the grass is withered” and “no grass in the wild”; and (4) comprehensive descriptions of drought conditions, e.g. “drought” and “severe drought”. To study the relationship between drought and famine, it is crucial to maintain the independence of these two sets of data. Therefore, drought records were extracted and graded based on the manifestations in natural systems – such as the atmosphere, hydrosphere, and biosphere, while deliberately excluding records on the social damages and losses caused by drought.

Based on semantic differences, we distinguish the meanings of qualitative text within the historical records to categorize drought events into various levels and thus measure drought. It is worth noting that the study area is characterized by a typical monsoon climate, with precipitation highly concentrated in the summer and autumn. Consequently, droughts occurring in the wet seasons (summer and autumn) are indicative of greater precipitation anomalies compared to those in the dry seasons (spring and winter). The criteria for rating droughts were established by considering the season of occurrence, duration, and intensity of drought events (Table 1). The basic time unit for drought events is the year, while the basic spatial unit is the county.
All drought records were rated according to Table 1. Finally, the classification yielded 210 records for Level 1, 631 records for Level 2, 905 records for Level 3, and 56 records for Level 4.
2.3 Processing of famine records
A total of 1977 records directly related to famine were extracted from the database. Famine records were rated according to the criteria in Table 2, yielding 430 records for Level 1, 791 records for Level 2, and 756 records for Level 3.
Table 2Criteria for classifying famine levels.
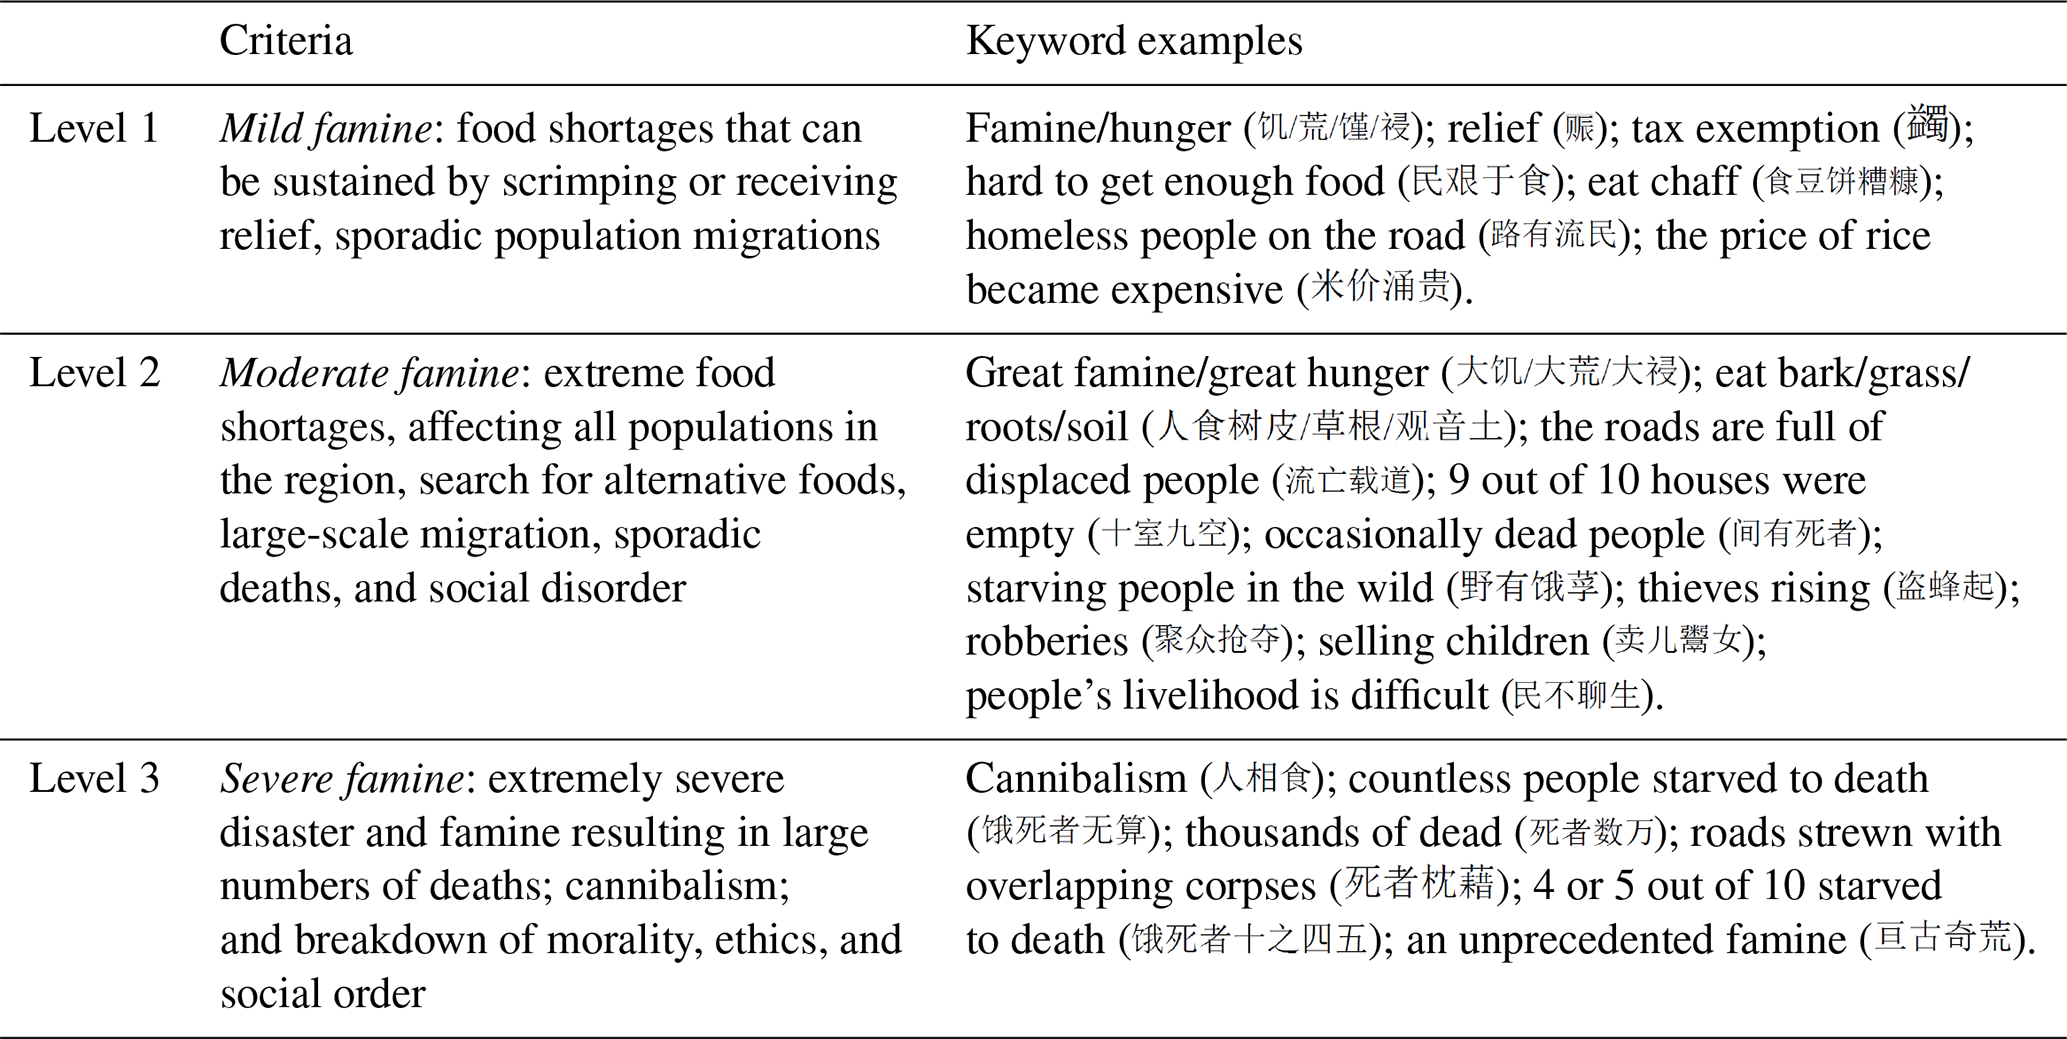
Note that these criteria were adapted from Xiao (2020) and Wei (2020).
2.4 Methods for reconstructing the spatial-temporal progression of drought and famine
Kernel density estimation (KDE) is a non-parametric method employed in spatial analysis to delineate trends in the spatial distribution of discrete point elements (Wang, 2006). This technique was utilized to reconstruct the spatial patterns of drought on an annual basis, as well as cumulatively, for the period 1627–1644. The locations of drought occurrences were identified and represented as point elements. These points were subsequently analysed using the KDE tool, with the drought level as the attribute value (termed the “population” field). Given that the basic spatial unit of the drought records was the county, a search radius of 65 km was selected, which equals the mean distance between adjacent administrative counties during the late Ming Dynasty (Zhou et al., 2007). The value of kernel density for a given raster is influenced by the quantity of surrounding drought events and their respective levels. Consequently, it can be inferred that a higher kernel density value signifies a more severe drought condition within the area. Employing the same methodology, the spatial distribution of famine was also reconstructed.
To examine the evolution of drought, the drought kernel density index (DKDI) series for each region was reconstructed with an annual temporal resolution. Initially, the average drought kernel density value for each region was calculated based on the kernel density distribution map. The results were then normalized to obtain DKDI values. The normalization was conducted by Eq. (1):
where DKDIij is the drought kernel density index for region j in year i, dij is the mean value of drought kernel density for region j in year i, min(d) is the minimum value of the annual kernel density mean for each region, and max(d) is the maximum value of the annual kernel density mean for each region. Thus, the DKDI series for the period 1627–1644 were obtained for each region. The same method was employed to reconstruct the famine kernel density index (FKDI) series.
Compare the spatial patterns and temporal series of drought and famine to investigate their relationship. Statistical analyses, including Spearman correlation and regression analysis, were conducted on the DKDI and FKDI to examine the contribution of drought to famine.
The Chongzhen drought is characterized by its extensive spatial coverage and prolonged duration. Figure 2a presents the general distribution of drought from 1627–1644. The drought affected a vast area across central and eastern China. The majority of the severe drought zone appeared north of 29° N, mainly consisting of three parts: (1) the area encompassing Beijing, southern Hebei, northern Henan, and western Shandong, which was the political heart and seat of the capital of China at the time; (2) the area along the Yellow, Wei, and Fen rivers in central Shaanxi and southwestern Shanxi; and (3) the Yangtze River delta, which was the most economically advanced area in the late Ming, contributing over 17 % to the nation's total tax revenue (Liang, 2008). These areas belonged to the northern region, northwestern region, and the Yangtze–Huai region, respectively.
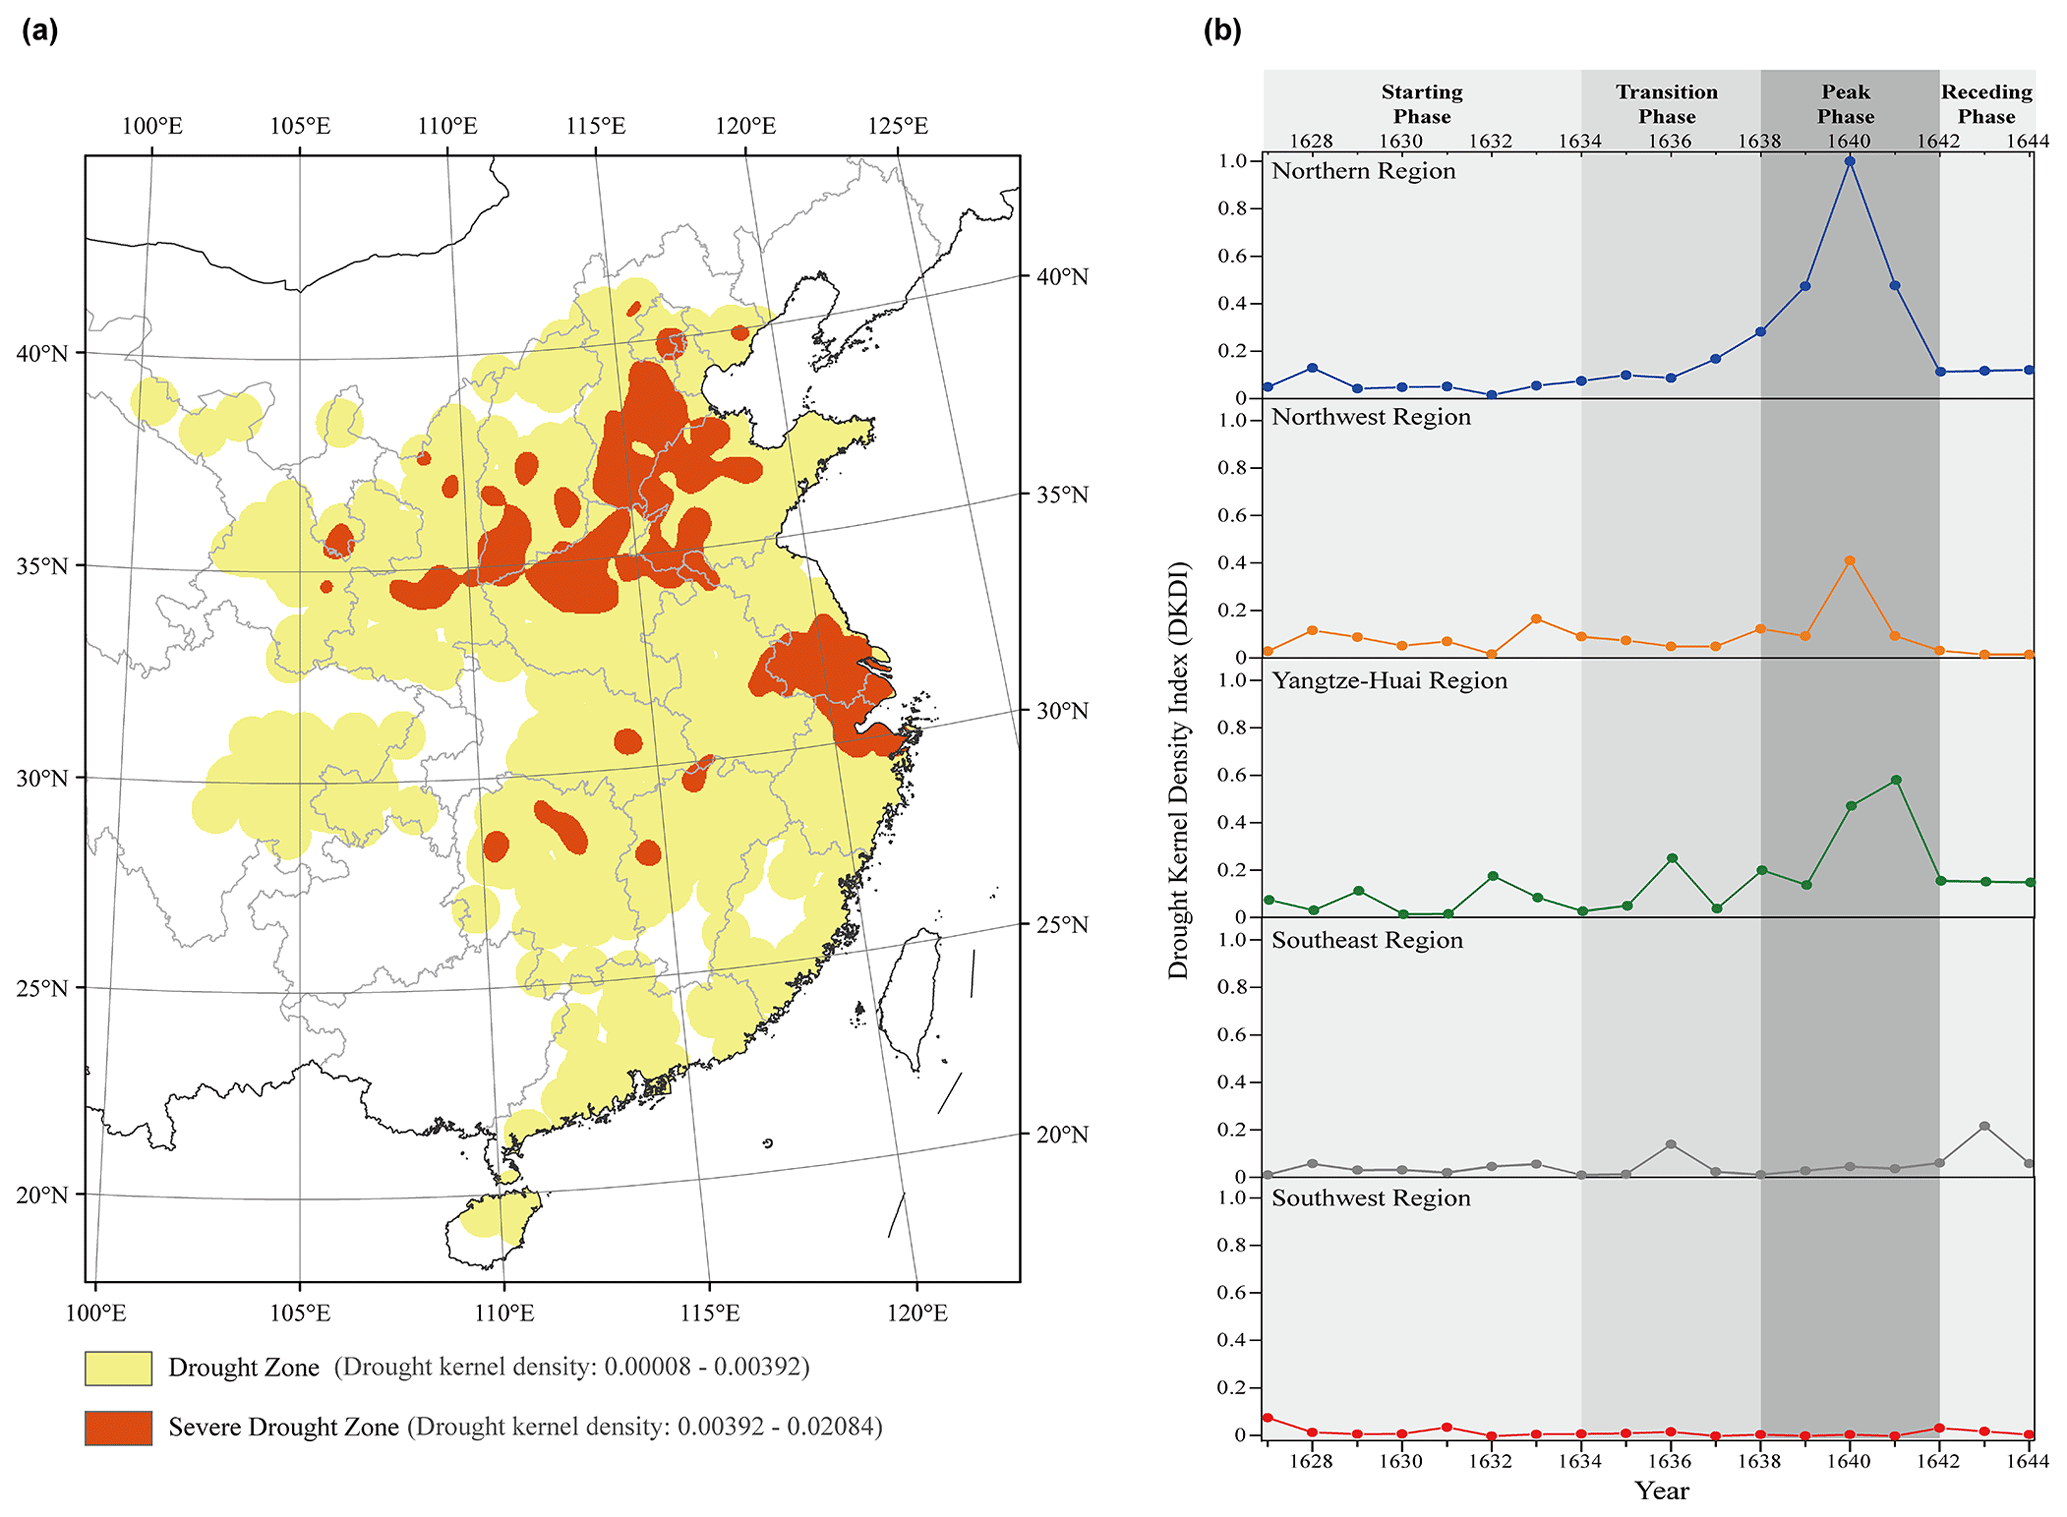
Figure 2Spatial and temporal patterns of drought, 1627–1644. (a) Overall spatial distribution of drought, 1627–1644. (b) Drought kernel density index (DKDI) series for five regions.
Figure 2b presents the DKDI series for the five subregions within the study area. The data reveal that the northern region, northwestern region, and Yangtze–Huai region were primarily affected by the drought. In contrast, the DKDI values for the southeastern and southwestern regions were comparatively low, suggesting these areas experienced less severe drought conditions.
Notably, the progression of drought exhibits significant regional variations, indicating diverse evolutionary patterns across the different regions. The DKDI series for the northern region resembles a single-peaked curve. Between 1633 and 1638, the DKDI gradually increased each year, although at a slow pace; after 1638, there was a marked surge. The peak of this series appeared in 1640, a year characterized by both the maximum spatial extent and the highest intensity of the drought. From 1638 to 1641, drought affected the entire region almost annually, with a notable decline after 1642. During the early Chongzhen period, the northwestern region, particularly Shaanxi Province, faced severe and prolonged drought until 1634. The DKDI gradually decreased afterward but surged again after 1638, also peaking in 1640. The DKDI series for the Yangtze–Huai region depicted a multi-peaked curve, reflecting continuous cycles of drought aggravation and alleviation. Before 1638, significant fluctuations occurred, with peaks in 1629, 1632, and 1636. Each drought event lasted 1 year, followed by relief. After 1638, the DKDI rose again, and the drought lasted for a long time. The DKDI reached its top in 1641, a year later than the northern and northwestern regions.
Focusing on the three predominantly impacted regions – the northwestern region, northern region, and Yangtze–Huai region – it is obvious that from 1627 to 1644 the DKDI exhibited a low–high–low fluctuating pattern. Furthermore, there was a shift in the region experiencing the most acute drought conditions. Thus, the Chongzhen drought is divided into four phases by analysing its spatial and temporal evolution (Fig. 2b).
-
Starting phase (1627–1633). Here the primary drought zone was situated in the northwestern region, particularly in Shaanxi and Shanxi provinces.
-
Transition phase (1634–1637). Here there was a gradual shift in the main drought zones from the northwestern region to the northern region.
-
Peak phase (1638–1641). Here the drought zones in both the north and south became interconnected, extending across all areas north of 29° N.
-
Receding phase (1642–1644). Here the drought contracted in scope and weakened in intensity.
The delineation of the four phases is informed by key events: declining DKDI in the northwestern region and increasing DKDI in the northern region in 1634; the beginning of an increase in DKDI in all three regions mainly in 1638; and a remarkable decline and following stabilization in DKDI in those three regions in 1642.

Figure 3Spatial distribution of drought during representative years of each phase.
We also reconstructed the spatial distribution pattern of drought at annual resolution (see Appendix B for details). Figure 3 illustrates these patterns across select years, highlighting the drought's progression through its distinct phases. In the starting phase, the drought was concentrated in the northern part, particularly around Shaanxi Province in the northwestern region, where it was extensive, intense, and prolonged. During the transition phase, the drought in the northwestern region eased, while in the northern region, especially in Henan and Hebei provinces, the drought's extent grew annually. During the peak phase (1638–1641), the drought area in the north merged with that in the Yangtze River basin, continuously expanding. Meanwhile, the drought intensity markedly increased, with a greater proportion of Level 3 and Level 4 drought events. The year 1640 witnessed the broadest and most intense drought conditions, with 367 counties reporting droughts, 69 % of which were Level 3 or Level 4. Significant waterbodies dried up, including sections of the Yellow River in Henan and Jiangsu1, the Fen and Zhang rivers in Shanxi, and the Dawen and Si rivers in Shandong, as well as Baiyangdian, the northern region's largest freshwater lake. In 1641, the drought slightly eased in the north but intensified in the south. In the Yangtze River delta, records indicated more than 4 months without rain during the summer and autumn – highly unusual for the area's climatic norms. Rivers such as the Suzhou Creek dried up. The record “no water even when drilling a well at the bottom of the river” indicated that the groundwater levels had dropped significantly. The receding phase began in 1642, with a notable reduction in drought severity and a contraction of the affected areas. Overall, from 1627 to 1644, the primary zone of extreme drought shifted from the northwestern region to the northern region and then expanded southwards.
It is important to note that the drought zones identified in this study were reconstructed using historical document records. However, the northern and northwestern parts of the study area were near the borders of the Ming Dynasty at that time, as illustrated in Fig. 1a. Conflicts are frequent here during the Chongzhen era, contributing to social instability. The unrest resulted in a significant scarcity of historical documentation in these areas. Consequently, the actual extent of the drought may have been more widespread towards the west and north than the historical records suggest.

Figure 4Spatial and temporal patterns of famine, 1627–1644. (a) Overall spatial distribution of famine, 1627–1644. (b) Famine kernel density index (FKDI) series for five regions.
Figure 4a presents the general spatial distribution of famine during 1627–1644, indicating that famine affected most areas of central and eastern China. The extent of the famine zone closely matched that of the drought zone. All severe famine zones located north of 29° N largely overlapped with the three areas experiencing severe drought.
Figure 4b presents the famine kernel density index (FKDI) series for five regions from 1627 to 1644. The northern region, northwestern region, and Yangtze–Huai region were significantly affected by famine, exhibiting higher FKDI values. In contrast, the southeastern and southwestern regions experienced milder famine conditions, with FKDI peaks not exceeding 0.2. A comparison of the FKDI and DKDI series reveals a generally consistent trend in the development of famine and drought across the regions. In the starting phase of the drought, FKDI was comparatively high in northwestern region. During the transition phase, FKDI in northern region grew but at a slow pace. The peak phase saw the FKDI reaching its maximum in northern region, northwestern region, and the Yangtze–Huai region in the years 1640, 1640, and 1641, respectively, coinciding with the peak years of DKDI in these regions. In the receding phase, FKDI showed a downward trend as the drought eased.
Although the trends exhibit similarities, it is important to recognize that the FKDI and DKDI series differ significantly in two key aspects.
Firstly, the FKDI series is smoother than the DKDI series, characterized by fewer fluctuations. Specifically, several peaks observed in the DKDI series before 1640 are absent in the FKDI series. For example, the DKDI series for the northern region peaks in 1628, and the DKDI for the Yangtze–Huai region peaks in 1629, 1632, and 1636, yet these peaks have no equivalents in the FKDI series. This discrepancy suggests that not all drought events escalate into famines.
Secondly, while the highest peaks of the FKDI and DKDI series occurred in the same years for the northwestern region, northern region, and Yangtze–Huai region (1640, 1640, and 1641, respectively), the FKDI peaks were broader and exhibited a right skew. It means that although both DKDI and FKDI values decreased in the year following their peak, the decline in FKDI was less pronounced than that of the DKDI. Despite the reduction in drought intensity, society was unable to promptly recover from its devastated state, resulting in the continued prevalence of famine. This pattern indicates a continuity in the impact of drought on famine.
To examine if there is a statistically significant relationship between drought and famine, a Spearman correlation analysis was conducted on the DKDI and FKDI data from the northwestern region, northern region, and Yangtze–Huai region. The results, presented in Table 3, reveal a significant positive correlation between DKDI and FKDI, with a correlation coefficient of 0.710. This indicates that the severity of drought is closely associated with the likelihood of severe famine. Additionally, the DKDI and FKDI of the subsequent year also exhibit a significant positive correlation, though the correlation coefficient decreases to 0.583. However, the correlation between DKDI and FKDI in the third year is not significant. These results underscore the ongoing impact of drought on famine, lasting until the following year, albeit at a reduced intensity.
Table 3The correlation coefficients between DKDI and FKDI at the regional scale.
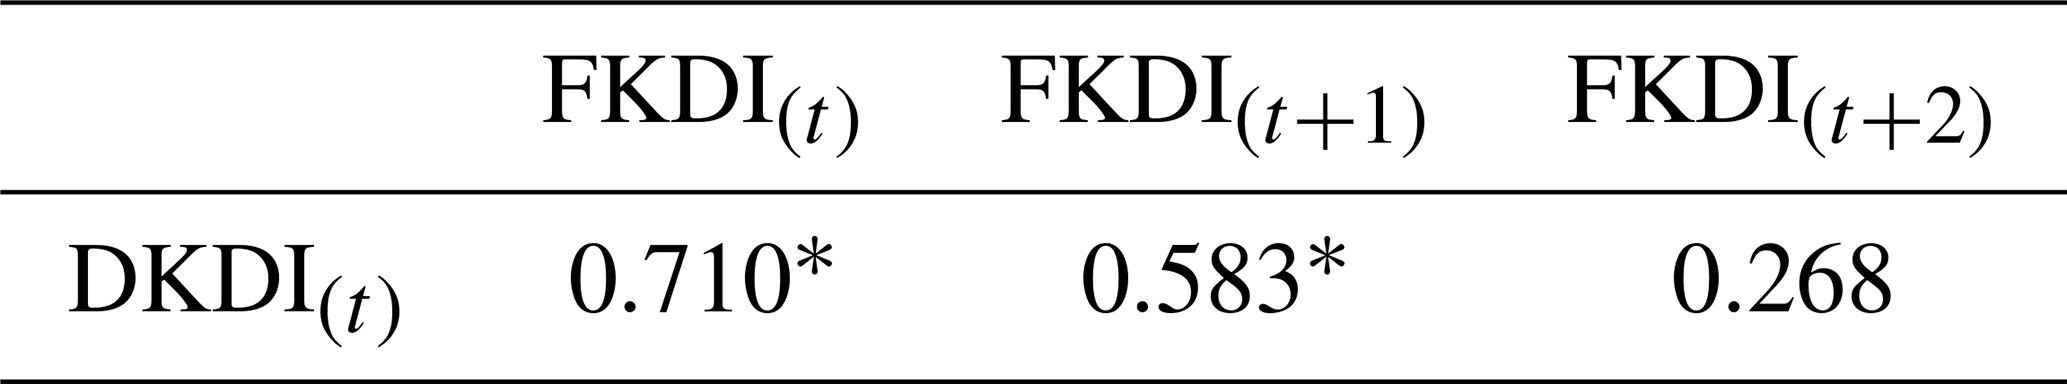
* This indicates significant correlation (two-tailed, p<0.01).
To further explore the contribution of drought to famine and whether there are regional differences, the northern region, northwestern region, and Yangtze–Huai region were subdivided into 16, 14, and 11 sub-provincial zones, respectively, for downscaling studies (detailed in Appendix C). This subdivision considered both physical and human geographical features, referencing China's provincial regionalization schemes. The methodology described in Sect. 2.4 was employed to calculate the DKDI and FKDI for each sub-provincial zone. Then regression analysis was carried out using DKDI as the independent variable and FKDI as the dependent variable. Since both scatter plots and correlation analysis showed a linear relationship between the two variables, a unary linear regression model was selected. The obtained regression equation is presented as Eq. (2):
The regression model demonstrates statistical significance (p<0.001), with a coefficient of determination (R2) of 0.673. This indicates that approximately 67.3 % of the variation in the FKDI series can be explained by changes in the DKDI. Consequently, drought is the primary factor influencing famine, accounting for roughly two-thirds of its variability.
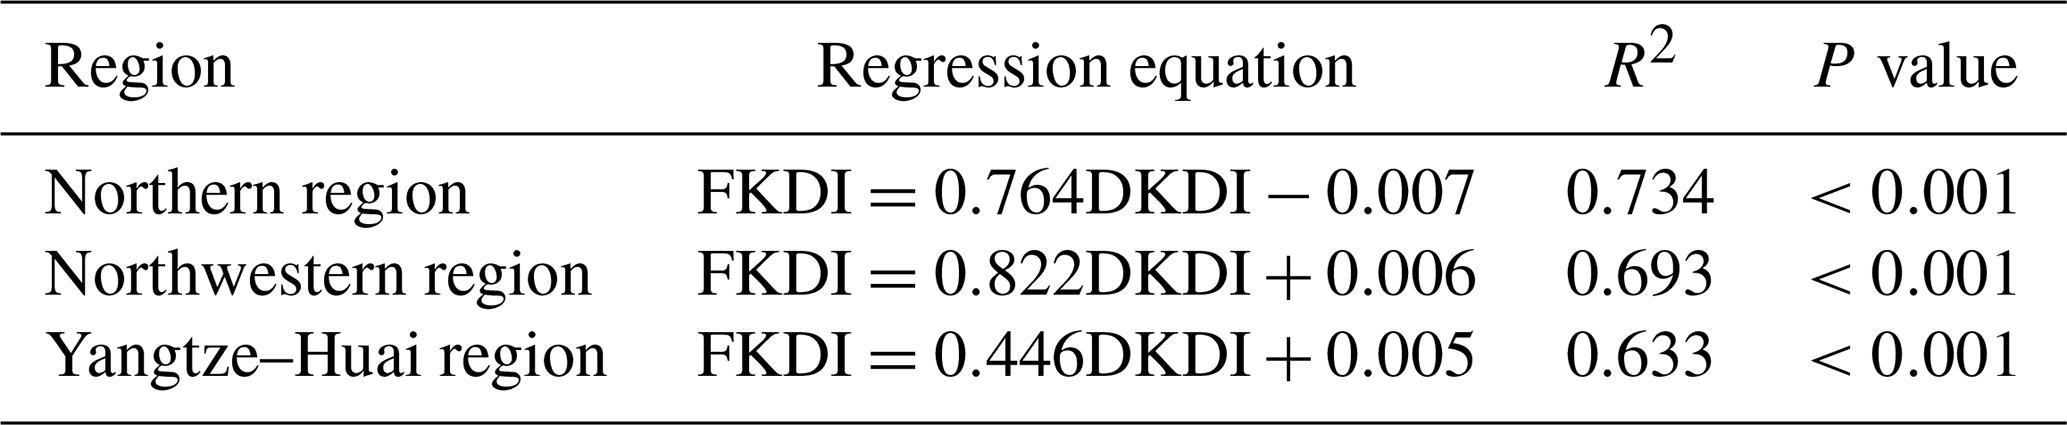
Table 4 presents the results of regression analyses across different regions. No matter which region, the regression equations achieved statistical significance at the 99.9 % level, all with positive regression coefficients. Based on the coefficient of determination (R2), the contribution of DKDI to FKDI in the northern region, northwestern region, and Yangtze–Huai region is 73.4 %, 69.3 %, and 63.3 %, respectively. Among the three principal disaster-affected regions, drought had the highest impact on famine in the northern region.
Table 4The regression analysis results of DKDI and FKDI at the sub-provincial scale.

6.1 The transmission process of extreme drought impacts
In ancient China, agriculture was pivotal to the nation's foundation and also a critical link in the transmission of climate change impacts to human society. The severity of drought's impact on agriculture largely depends on the season it occurs. In this study, 886 drought records provided specific seasonal or monthly details. This facilitated an analysis of the seasonal distribution of droughts in the northern region, northwestern region, and Yangtze–Huai region from 1627 to 1644 (Fig. 5). In the northern region, summer experienced the highest frequency of droughts, constituting 73 % of the total occurrences, followed by spring and autumn with 34 % and 23 %, respectively. Consecutive droughts spanning spring to summer or summer to autumn were also common. The region primarily cultivates two types of food crops: cereals like millet and sorghum, planted in spring and harvested in autumn, and winter wheat, sown in autumn and harvested in the next summer (Han, 2000). Summer serves as the critical growth period for cereals, whereas autumn and spring cover the tillering and grain-filling stages of winter wheat with huge water requirements (Zhong et al., 2000). That is to say, most drought events coincided with the crucial crop growth periods in the northern region, resulting in inadequate water supply for crops. A similar situation is observed in other regions. The most drought-prone seasons in the northwestern region are summer (62 %) and autumn (36 %), which meet the primary growth periods for spring wheat. In the Yangtze–Huai region, the majority of droughts occurred in summer (73 %) and autumn (41 %). The main food crop in the region is rice, which is cultivated in spring, transplanted in summer, and harvested in autumn, with a huge water demand. Droughts during these growth seasons often lead to diminished crop yields or complete failures, subsequently reducing the per capita food availability. Famine ensues when the food reserves of most people fails to meet their basic needs for survival and health. Hence, the dominant pathway through which climate change impacts translate into social consequences is as follows: extreme drought → declining agricultural harvest → food shortage → famine.
Series and correlation analyses reveal that droughts have continuous impacts on famine, although these effects diminish over time. The reason is that the impacts of drought, once transmitted to societal levels, disrupt the production, population, and economic systems to various extents. Even as the drought eased and precipitation normalized, the society remained damaged, hindering the immediate restoration of production and life order. Historical records underscore this phenomenon. For instance, in 1641, there was a record that “at that time, there was land, but no people and cattle, so the land was out of cultivation and turned back barren”2 in Neihuang, Henan Province. As many people died and cattle were sold or eaten, there was a shortage of both labour and production means, so it was hard to resume agricultural activities. Similarly, a record from Xinzheng, Henan Province, said that “in spring, famine followed by plague, the dead seven out of ten. In May, although the wheat is ripe, no one to harvest”3. These examples illustrate that the societal devastation led by drought is a persistent process. When drought is over, it takes some time for the society to return to normalcy from disaster damage.
Table 5Response measures in the Yangtze–Huai region from 1627 to 1644.
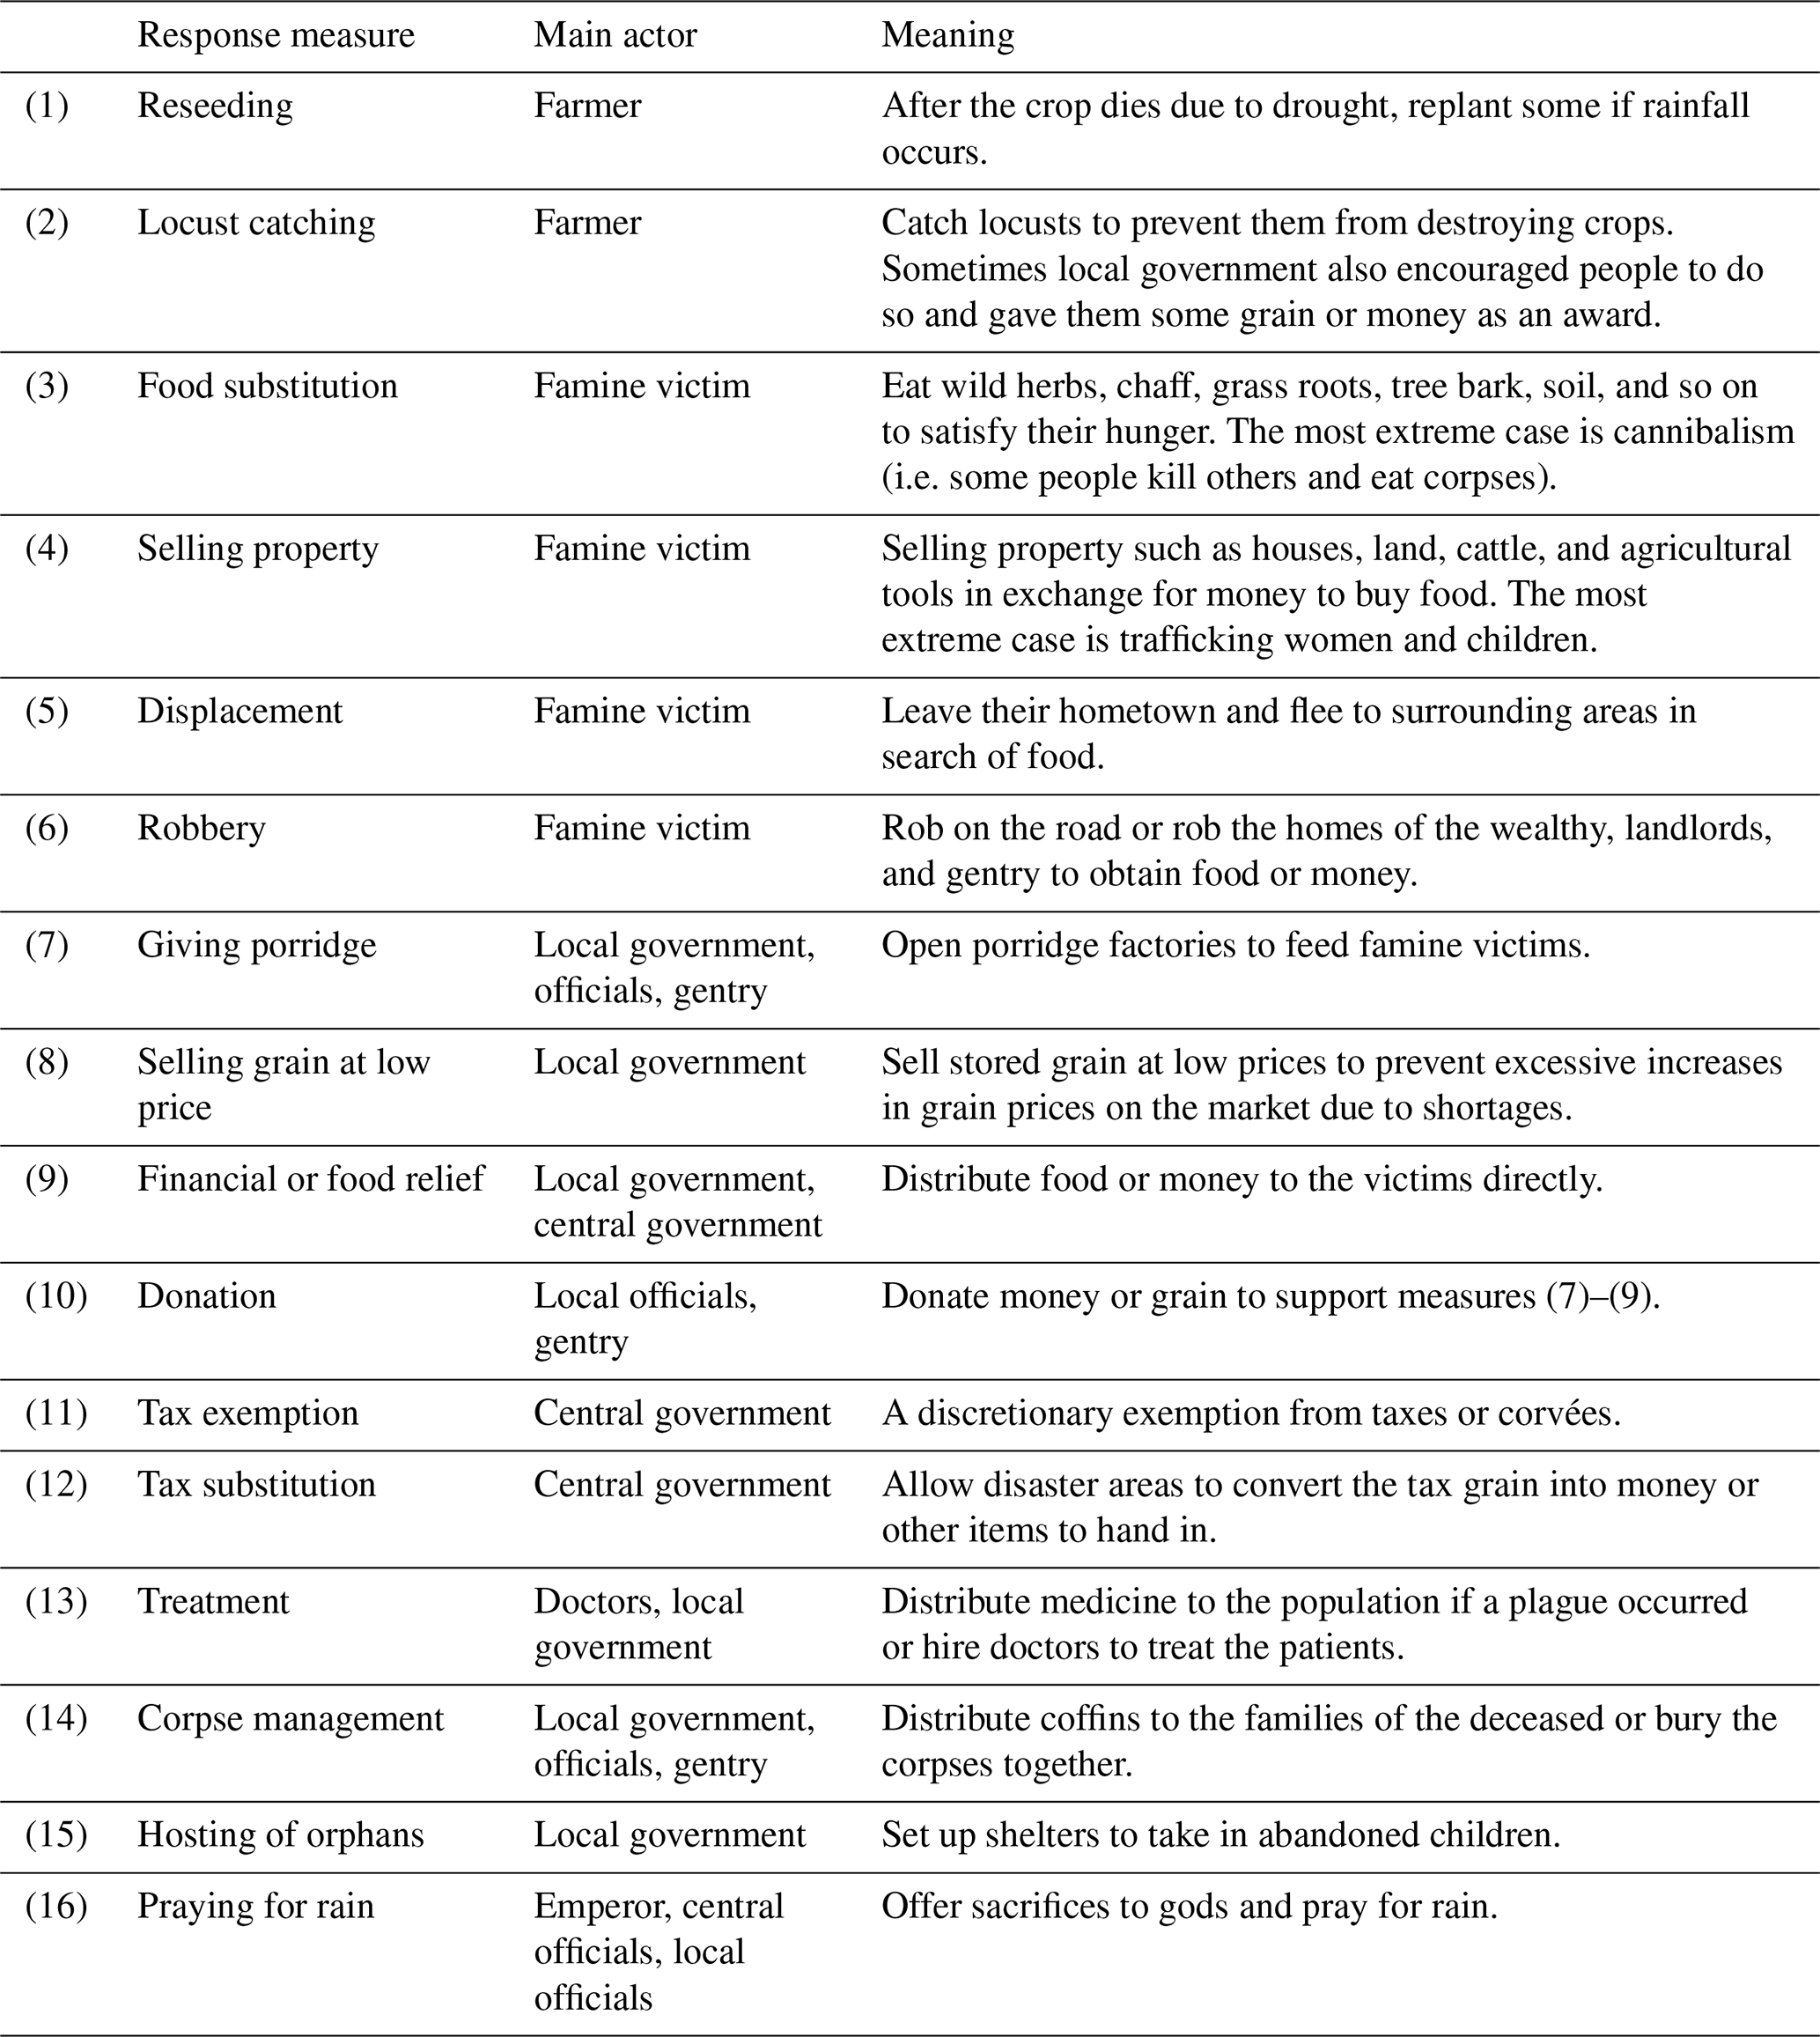
The comparison of the DKDI and FKDI series indicates that not all drought events turn into famine. It is particularly evident in the Yangtze–Huai region, where the DKDI series identifies peaks in 1629, 1632, 1636, and 1638, but the FKDI series does not present corresponding peaks. This discrepancy suggests that although extreme droughts occurred in the Yangtze–Huai region in these years, their impacts decreased or even dissipated before reaching the famine level, largely due to human societies being active in developing various coping measures (Yang et al., 2021). Between 1627 and 1644, the Yangtze–Huai region documented at least 16 categories of response measures (Table 5), the most varied and frequent across all regions studied. Individual people initiated measures (1) to (6). Measures (1)–(2) operated in the production subsystem, aiming to reduce the impacts of droughts and locusts on food production. Measures (3) to (6) sought to enhance food accessibility to cope with shortages caused by crop failures. On the other hand, measures (7)–(16) were government-driven initiatives. Measures (7)–(9) distributed grain to the hungry in different ways. These grains were mainly sourced from warehousing storage, which in the Ming Dynasty included various types, such as disaster-preparing granaries, price-stabilizing granaries, community granaries, and charity granaries (G. Chen, 1991). The first two were managed by local governments, while civilian groups operated the latter two. Donations, represented by measure (10), also made a great contribution to the food supply in disaster years. Measures (11) and (12) left a greater proportion of grain to producers through tax reductions. Measures (7)–(12) were all essentially aimed at increasing the per capita share of food of local people to ensure individual food security (Fang et al., 2024). Furthermore, measures (13)–(15) dealt with the social influences of famine, such as plague, displacement, and population mortality, while measure (16) could appease the populace to some degree, so as to maintain a stable social order. These measures worked on different segments of the socio-ecological system, effectively mitigating the impacts of the droughts and preventing, or at least curtailing, their spread to higher-level subsystems, demonstrating the Yangtze–Huai region's resilience to the drought impacts. While all regions have certainly tried to make use of all their capacities and possible measures, the limits of social resilience were challenged when the drought impacts exceeded the system's threshold (Xu et al., 2021). From 1640 to 1641, 110 counties within the Yangtze–Huai region reported drought, with Level 3 and 4 drought events accounting for more than 65 %. The Yangtze River Delta even recorded “little rain for the whole year”. While the above response measures still exist, they were only a drop in the bucket for local people. Severe famine swept through the region, and there were even instances of cannibalism.

Figure 6Areas affected by the locust infestation and plague. (a) Locust infestation and (b) plague.
6.2 Other factors triggering and exacerbating famine
Regression analysis indicates that drought was the primary cause of famine in this case, contributing about two-thirds. However, it was not the only cause. Other natural and social factors also played significant roles. (1) On a long timescale, the late Ming was a period of climate cooling in the Little Ice Age. Between the 1550s and 1650s, the mean temperature of China decreased by about 0.4 °C; the mean temperature in northern China was about 0.7 °C lower than the 1951–2000 average (Ge et al., 2013). This cooling shortened the growing season for crops and reduced arable land in the north. As a result, there had been an overall decline in per capita food availability, making society more sensitive to external forcings, including climate extremes (Fang et al., 2014). (2) Other disasters were also present, such as localized floods, windstorms, frosts, and large-scale locust infestations, in the context of persistent droughts (Fig. 6a). These disasters, compounded with droughts, exacerbated the damage to agricultural production. Against the backdrop of massive famine, there was a severe plague during the Chongzhen period (Fig. 6b), which led to numerous deaths and made the resumption of social order more difficult (Cao, 1997). (3) The Ming government's declining governance capacity both politically and economically is also clearly shown. Political issues included the emperor's negligence, abuse of power by eunuchs, power struggles among central officials, and corruption among local officials. Economic problems included revenue shortages, overspending, and reduced warehousing (Bai, 1999; Twitchett and Fairbank, 1998). These issues limited the government's ability to respond to large-scale droughts effectively (Chen et al., 2024). (4) The growing border crisis also contributed to these issues. From the 16th century onwards, wars between the Mongols and the Ming Dynasty increased significantly (Fu et al., 1986). At the same time, the Manchu in the northeast gradually developed under the leadership of Nurhaci, and in 1618 declared war on the Ming Dynasty. The prolonged war strained financial resources and diverted funds from disaster relief. It is notable that climate change also played a role in the border crisis. Climate cooling led to grassland degeneration and desertification in the north, reducing the production capacity of the Mongols and Manchus and pushing them to invade the Ming Dynasty's territory for resources (Ge, 2011). (5) The increasing taxes also contributed to the crisis. Due to the Manchu invasion and peasant uprisings, the Ming government imposed additional taxes to meet the escalating military expenditures. The most notable examples were the “Three Extra Levies”: the Liao levy (initiated in 1618 for the war in the northeast), the Suppression levy (initiated in 1637 to quell peasantry uprisings), and the Training levy (initiated in 1639 for training new armies). By 1639, the total amount of these additional levies even exceeded the regular tax revenue of normal years (Guo, 1983). These increasing taxes further lowered the living standards of the populace and exacerbated social conflicts. These factors, in conjunction with the primary impact of drought, illustrate a complex web of causes behind the famine, highlighting the interplay between natural events and human society.
A coupled socio-ecological system (Gallopin, 2006) comprises three tiers: the natural system, support system, and human system (Bossel, 1999; Fang et al., 2014). Typically, the effects of climate change propagate through these levels sequentially (Fig. 7). However, this transmission does not follow a simple cause-and-effect pattern. Instead, climate change acts as an external force on the socio-ecological system, interacting with the vulnerability of society and triggering a cascade of feedback mechanisms. In the case of Chongzhen drought, the core event in the natural system was the persistent extreme droughts; the core event in the support system was the decline in food production; and the initial core event in the human system was famine. Famine further triggered a sequence of social consequences, including peasantry uprisings, plagues, widespread mortality, and decreased social stability, and ultimately contributed to the collapse of the Ming Dynasty (Zheng et al., 2014; Tan et al., 2011b). As can be seen, when the effects of climate change ascend to higher levels, the outcomes tend to be more complex and regulated by more non-climatic factors (e.g. economy, policy).

Based on historical records and employing kernel density estimation, this study has reconstructed the spatial distribution patterns of drought from 1627 to 1644, alongside developing the drought kernel density index (DKDI) series for five regions in China. This extreme drought event lasted for 18 years and affected most of central and eastern China spatially. Drought is relatively severe in the northern region, northwestern region, and Yangtze–Huai region, mainly located north of 29° N. The analysis reveals notable regional differences in drought evolution. In the northern region, the DKDI followed a single-peaked trajectory, with drought intensifying from 1633 and reaching its peak in 1640. The northwestern region experienced the earliest onset of drought, which eased in the middle period before peaking again in 1640. The Yangtze–Huai region displayed a multi-peaked DKDI, undergoing several cycles of worsening and easing drought, with the most severe drought occurring in 1641, a year later than in the north. The temporal and spatial progression of the Chongzhen drought can be divided into four phases: the starting phase (1627–1633), where the main drought zone was in the northwestern region; the transition phase (1634–1637), during which the drought zone gradually shifted to the northern region; the peak phase (1638–1641), where drought zones in the north and south converged and expanded to all areas north of 29° N; and the receding phase (1642–1644), marked by a weakening of the drought. The year 1640 witnessed the broadest and most intense drought conditions, during which numerous significant waterbodies, including sections of the Yellow River, dried up. From 1627 to 1644, there was a shift in the primary drought zones from the northwestern region to the northern region, and they then expanded southwards. Summer and autumn, the critical crop-growing seasons in the study area, experienced the highest frequencies of drought, significantly impacting food production.
In the case of the Chongzhen drought, drought was the primary factor in triggering famine, with the spatial and temporal patterns of both phenomena displaying remarkable similarities. Spatially, the area affected by famine from 1627 to 1644 significantly overlapped with that experiencing drought. Temporally, the progression timelines of drought and famine exhibited generally consistent patterns. The years when the famine kernel density index (FKDI) reached its peak in the northern region, northwestern region, and Yangtze–Huai region coincided with the peaks of the DKDI series. Moreover, a significant positive correlation between DKDI and FKDI was observed. Regression analysis revealed that, on a sub-provincial scale, drought accounted for approximately 67.3 % of the famine's causation, increasing to as much as 73.4 % in the northern region. Series and correlation analyses further demonstrated the continuous impacts of drought on famine.
Extreme drought → declining agricultural harvest → food shortage → famine is the dominant transmission pathway in which the climate change impacts reached the human system in this case. However, the transmission of climate change impacts is characterized by a non-linear process with multiple feedback mechanisms. In addition to extreme drought, other natural factors and socio-economic contexts also play significant roles in the occurrence and development of famines. Moreover, human responses regulated the transmission of drought impacts. In the Yangtze–Huai region in particular, multiple response measures curtailed the spread of drought impacts to the human system before 1640. This thorough study deepens our understanding of historical extreme climate events and their social impacts, while also underscoring the significance of grasping the interaction between natural dynamics and human actions when dealing with climate challenges.
Table A1Sources of historical records used in this study.

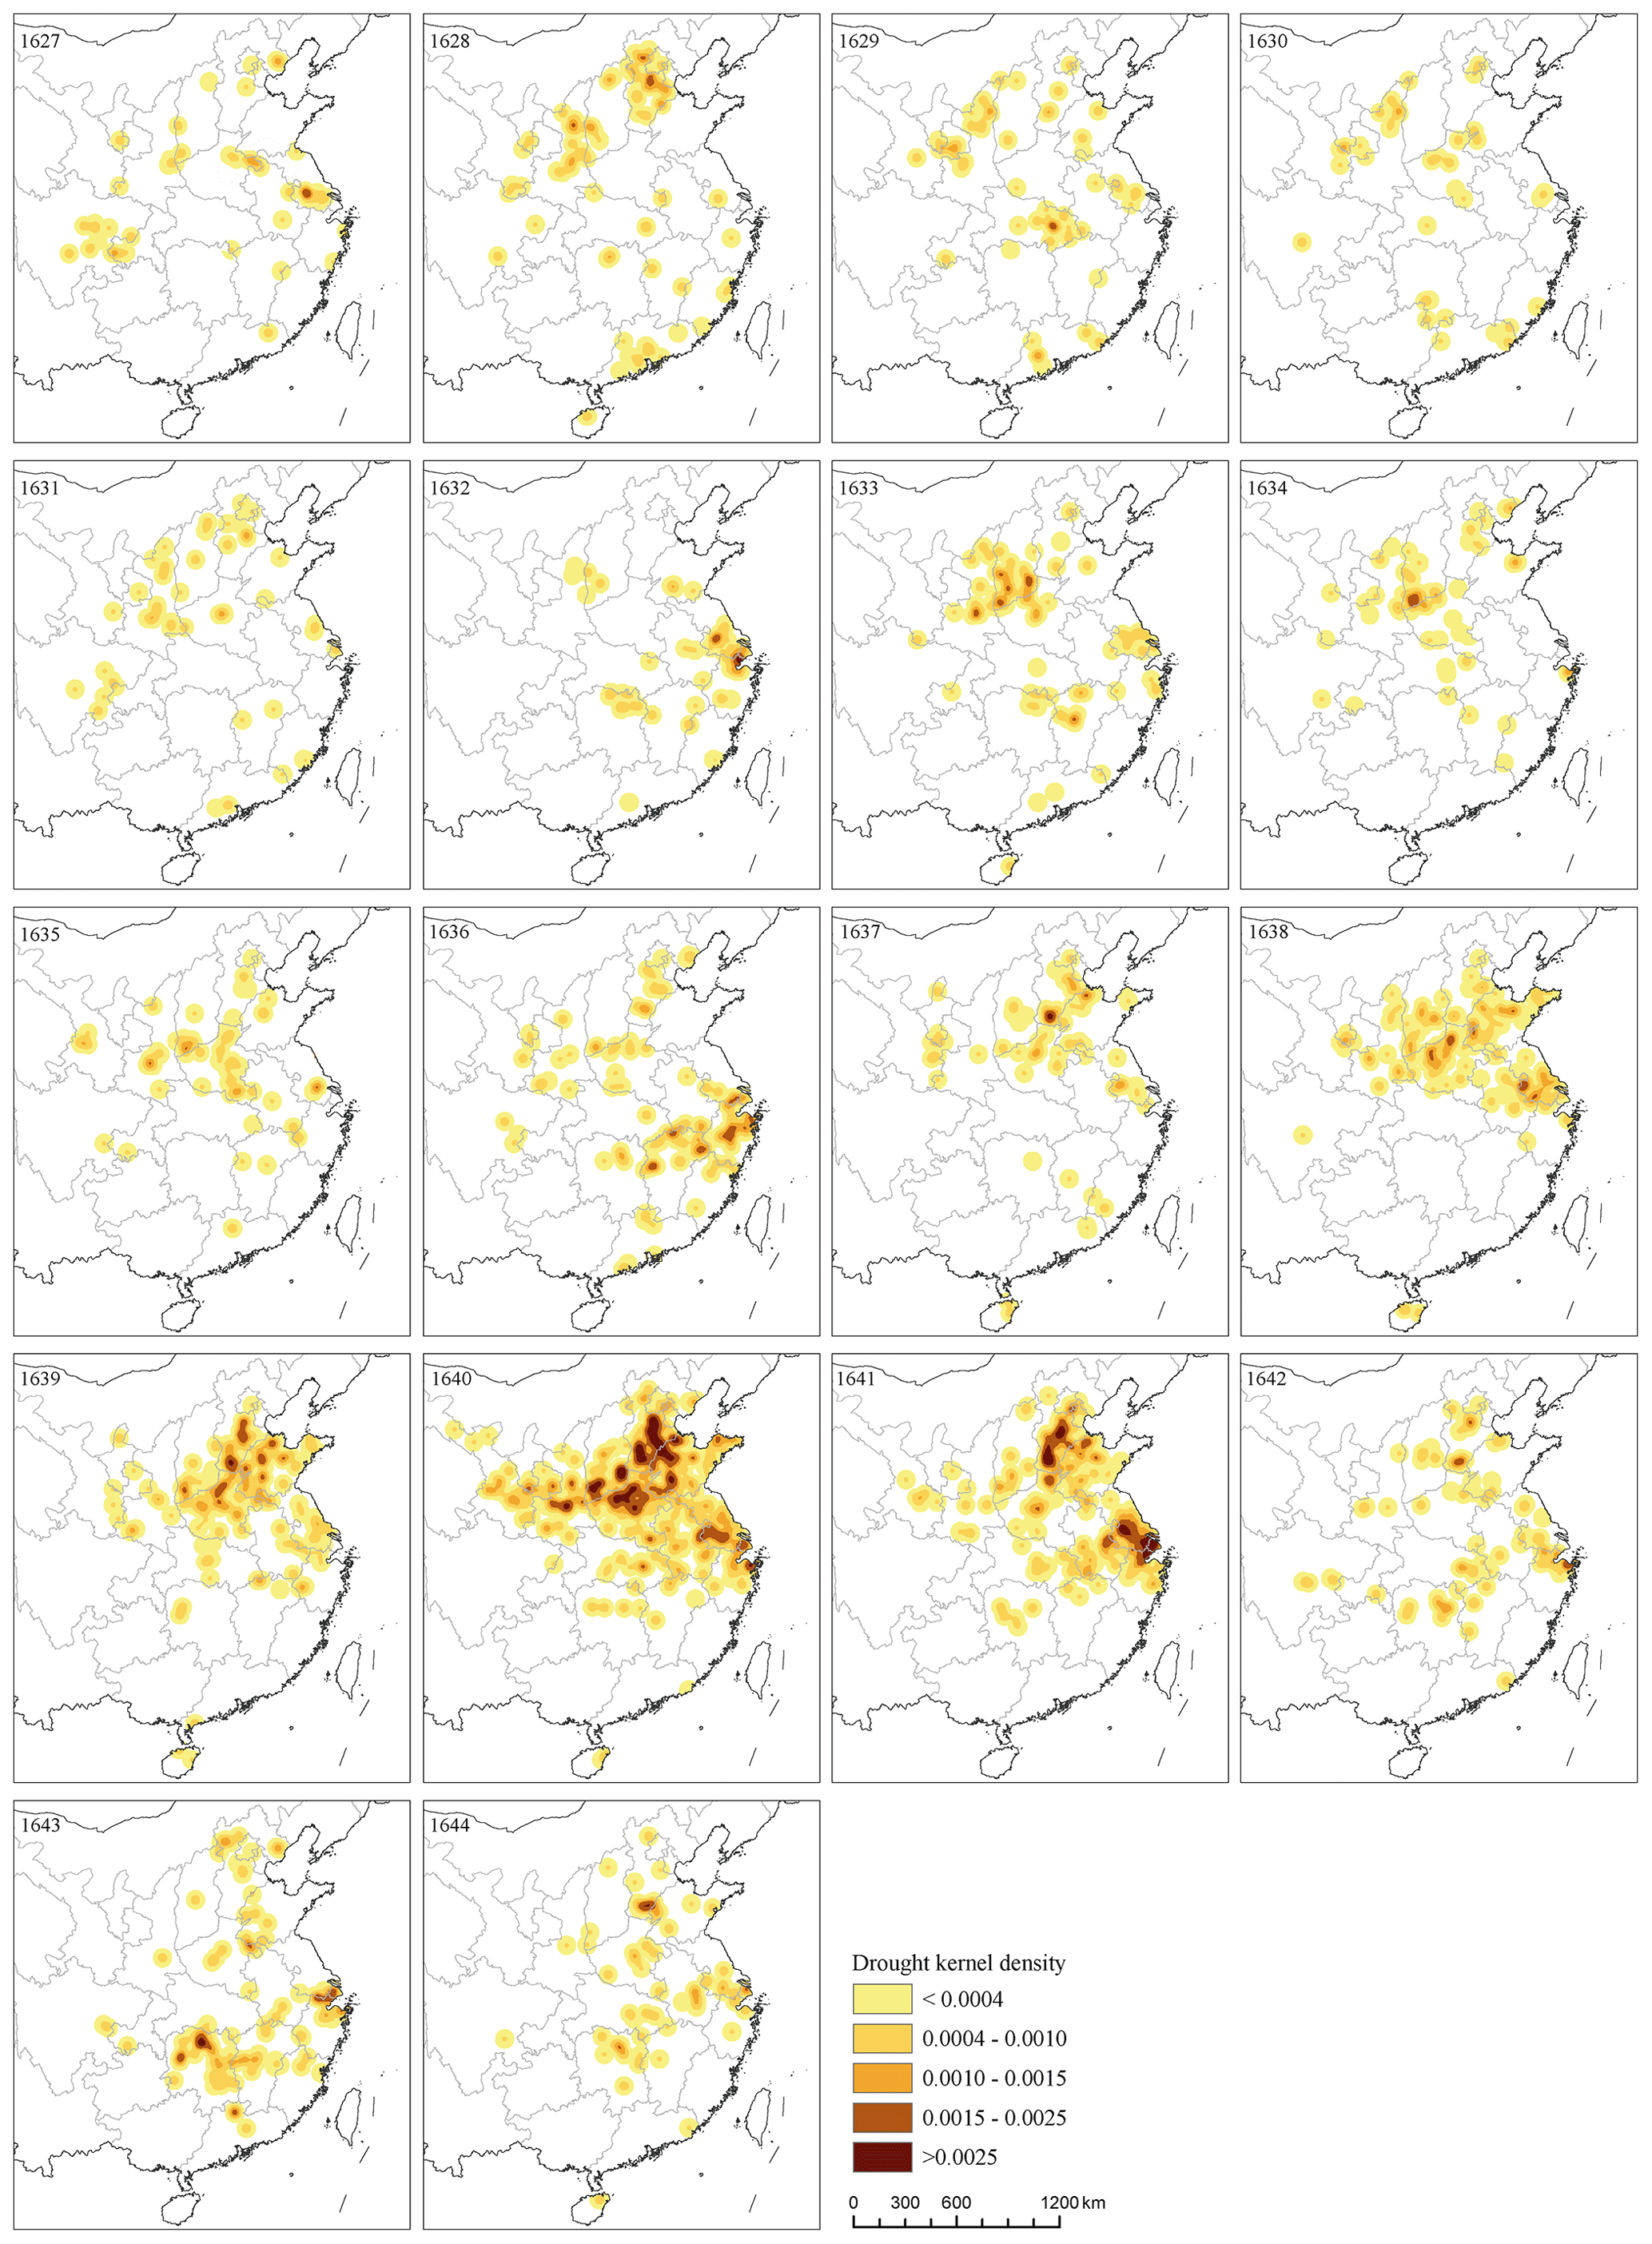
Figure B1Year-by-year spatial distribution of drought during 1627–1644.

Figure C1The division of sub-provincial zones.

Figure D1Year-by-year spatial distribution of famine during 1627–1644.
All the data used in this study are described in Appendix A.
SC and YS contributed to the study conception and methodology design. SC collected data, performed most of the analysis, and wrote the initial draft. YS performed the funding acquisition and supervised the whole study. XC drafted the writing outline and contributed to the data visualization. LEY participated in writing the discussion section and revised the manuscript. All authors read and approved the final manuscript.
The contact author has declared that none of the authors has any competing interests.
Publisher's note: Copernicus Publications remains neutral with regard to jurisdictional claims made in the text, published maps, institutional affiliations, or any other geographical representation in this paper. While Copernicus Publications makes every effort to include appropriate place names, the final responsibility lies with the authors. Regarding the maps used in this paper, please note that Figs. 1, 2, 3, 4, 6, B1, and D1 contain disputed territories.
We would like to thank all of our colleagues in our research group from the Beijing Normal University in China and the Ludwig-Maximilians-Universität München (LMU) in Germany. We would like to thank Yixin Jin for her help with the language. We would like to thank the reviewers and editors for their comments.
This research has been supported by the Major Program of National Fund of Philosophy and Social Science of China (grant nos. 22&ZD223).
This paper was edited by Chantal Camenisch and reviewed by three anonymous referees.
Anthony, J. M., Rosalie, E. W., and Simon, H.: Climate change and human health: present and future risks, Lancet, 367, 859–869, https://doi.org/10.1016/s0140-6736(06)68079-3, 2006.
Bai, S.: An outline history of China: the Ming dynasty, Shanghai People's Publishing House, Shanghai, China, ISBN 978-7-208-11162-2, 1999.
Benson, L., Petersen, K., and Stein, J.: Anasazi (pre-Columbian native-American) migrations during the middle-12th and late-13th centuries – were they drought induced?, Climatic Change, 83, 187–213, https://doi.org/10.1007/s10584-006-9065-y, 2007.
Bossel, H.: Indicators for Sustainable Development: Theory, Method, Applications. International Institute for Sustainable Development, Winnipeg, Canada, ISBN 1-895536-13-8, 1999.
Buckley, B. M., Anchukaitis, K. J., Penny, D., Fletcher, R., Cook, E. R., Sano, M., Nam, L. C., Wichienkeeo, A., Minh, T. T., and Hong, T. M.: Climate as a contributing factor in the demise of Angkor, Cambodia, P. Natl. Acad. Sci. USA, 107, 6748–6752, https://doi.org/10.1073/pnas.0910827107, 2010.
Buckley, B. M., Fletcher, R., Wang, S. Y. S., Zottoli, B., and Pottier, C.: Monsoon extremes and society over the past millennium on mainland Southeast Asia, Quaternary Sci. Rev., 95, 1–19, https://doi.org/10.1016/j.quascirev.2014.04.022, 2014.
Büntgen, U., Myglan, V. S., Ljungqvist, F. C., McCormick, M., Cosmo, N. D., Sigl, M., Jungclaus, J., Wagner, S., Krusic, P. J., Esper, J., Kaplan, J. O., Vaan, M. A. C., Luterbacher, J., Wacker, L., Tegel, W., and Kirdyanov, A. V.: Cooling and societal change during the Late Antique Little Ice Age from 536 to around 660 AD, Nat. Geosci., 9, 231–236, https://doi.org/10.1038/NGEO2652, 2016.
Cao, S.: Plague epidemic and social changes in North China (1580–1644 AD), Hist. Res., 1, 17–32, 1997.
Cao, S.: Grain and army: the relationship between great drought and peasant war in late Ming, Hist. Rev., 2, 76–87, 2019.
Chen, C.: Brief analysis of natural disasters in Zhejiang Province during Chongzhen 13 and 14 years of Ming Dynasty, J. Qinghai Normal Univers., 2, 61–64, 2006.
Chen, G.: Research on the warehouse system and famine preparation in the Ming Dynasty, Seeker, 5, 117–128, https://doi.org/10.16059/j.cnki.cn43-1008/c.1991.05.024, 1991.
Chen, G. and Zhu, C.: Influence of natural disasters on people's behaviors, J. Catastrophol., 4, 90–95, 2003.
Chen, Y.: A study on the droughts and their impacts from 1470 to 1979 in North China (in Chinese with English abstract), Meteorol. Mon., 3, 17–21, 1991.
Chen, Q., Yang, L. E., Luo, J., Liu, F., Zhang, Y., Zhou, Q., Guo, R., and Gu, X.: The 300-year cropland changes reflecting climate impacts and social resilience at the Yellow River-Huangshui River Valley, China, Environ. Res. Lett., 16, 065006, https://doi.org/10.1088/1748-9326/abe82a, 2021.
Chen, X., Tian, F., Tao, L., and Su, Y.: The response rules to maintain social stability facing the climate change in ming dynasty, Heliyon, 10, 065006, https://doi.org/10.1016/j.heliyon.2024.e31696, 2024.
Chinese Academy of Meteorological Sciences: Yearly charts of dryness/wetness in China for the last 500-year period, book no. 12014-1086, China Cartographic Publishing House, Beijing, China, 1981.
Cullen, H. M., deMenocal, P. B., Hemming, S., Hemming, G., Brown, F. H., Guilderson, T., and Sirocko, F.: Climate change and the collapse of the Akkadian empire: Evidence from the deep sea, Geology, 28, 379–382, https://doi.org/10.1130/0091-7613(2000)28<379:CCATCO>2.0.CO;2, 2000.
Deng, Y., The History of famine relief in China, Wuhan University Press, Wuhan, China, ISBN 978-7-100-08446-8, 2012.
Douglas, P. M., Pagani, M., Canuto, M. A., Brenner, M., Hodell, D. A.,b Eglinton, T. I., and Curtis, J. H.: Drought, agricultural adaptation, and sociopolitical collapse in the Maya Lowlands, P. Natl. Acad. Sci. USA, 112, 5607–5612, https://doi.org/10.1073/pnas.1419133112, 2015.
Fang, A.: The disaster and the society to help oneself in the Zhejiang area Chongzhen years in the Ming dynasty, Doctoral thesis, Jilin University, Changchun, China, 56 pp., https://cdmd.cnki.com.cn/Article/CDMD-10183-2006115089.htm (last access: 22 December 2023), 2006.
Fang, K., Gou, X., Chen, F., Frank, D., Liu, C., Li, J., and Kazmer, M.: Precipitation variability during the past 400 years in the Xiaolong Mountain (central China) inferred from tree rings, Clim. Dynam., 39, 1697–1707, https://doi.org/10.1007/s00382-012-1371-7, 2012.
Fang, X., Zheng, J., and Ge, Q.: Historical climate change impact-response processes under the framework of food security in China, Sci. Geogr. Sin., 34, 1291–1298, 2014.
Fang, X., Su, Y., Zheng, J., Xiao, L., Wei, Z., and Yin, J.: The Social Impact of Climate Change in China over the Past 2000 Years, Science Press, Bejing, China and Springer, New York, USA, https://doi.org/10.1007/978-981-97-0202-2, 2024.
Fu, Z., Zhang, X., Tian, Z., and Yang, B.: Chinese Military History: Chronology of War in Past Dynasties, Liberation Army Press, Beijing, China, ISBN 7-5065-4349-4, 1986.
Gallopin, G. C.: Linkages between vulnerability, resilience, and adaptive capacity, Global Environ. Change, 16, 293–303, https://doi.org/10.1016/j.gloenvcha.2006.02.004, 2006.
Ge, Q.: Climate change in China's past dynasties, Science Press, Beijing, China, ISBN 978-7-03-029753-2, 2011.
Ge, Q., Hao, Z., Zheng, J., and Shao, X.: Temperature changes over the past 2000 in China and comparison with the Northern Hemisphere, Clim. Past, 9, 1153–1160, https://doi.org/10.5194/cp-9-1153-2013, 2013.
Guo, C.: Research on the drought and famine and social responses in Shaanxi during the Chongzhen Period of the Ming Dynasty, Doctoral thesis, Shaanxi Normal University, Xi'an, China, 195 pp., https://cdmd.cnki.com.cn/Article/CDMD-10718-1014402694.htm (last access: 15 December 2023), 2014.
Guo, S.: Three extra levies in the late Ming Dynasty, Essays in Ming History, 220–245, https://cpfd.cnki.com.cn/Article/CPFDTOTAL-SKMS198306001012.htm (last access: 17 August 2024), 1983.
Han, M.: A brief discussion of the crop cultivation system in ancient China, Agricult. Hist. China, 3, 91–99+64, 2000.
Harvey, W. and Bradley, R. S.: What Drives Societal Collapse?, Science, 291, 609–610, https://doi.org/10.1126/science.1058775, 2001.
Haug, G. H., Günther, D., Peterson, L. C., Sigman, D. M., Hughen, K. A., and Aeschlimann, B.: Climate and the collapse of Maya civilization, Science, 299, 1731–1735, https://doi.org/10.1126/science.1080444, 2003.
Li, B.: Climate change and several ups and downs of population in China's history, Popul. Res., 1, 15–19, 1999.
Li, M., Li, S., and Li, Y.: Studies on drought in the past 50 years in China, Chin. J.Agrometeorol., 24, 7–10, 2003.
Liang, F.: Statistics on household, land, and tax in China's past dynasties, Zhonghua Book Company, Beijing, China, ISBN 978-7-101-06288-5, 2008.
Liu, Q., Li, G., and Yang, X.: The extreme drought event at the end of Ming Dynasty during 1637–1643 AD, J. Northwest Univers., 44, 833–837, 2014.
Medina-Elizalde, M. and Rohling, E. J.: Collapse of Classic Maya civilization related to modest reduction in precipitation, Science, 335, 956–959, https://doi.org/10.1126/science.1216629, 2012.
PAGES: Science Plan and Implementation Strategy, IGBP Report No. 57, IGBP Secretariat, Stockholm, Sweden, https://pastglobalchanges.org/publications/pages-science-plan-and-implementation-strategy (last access: 3 December 2023), 2009.
Pederson, N., Hessl, A. E., Baatarbileg, N., Anchukaitis, K. J., and Cosmo, N. D.: Pluvials, droughts, the Mongol Empire, and modern Mongolia, P. Natl. Acad. Sci. USA, 111, 4375–4379, https://doi.org/10.1073/pnas.1318677111, 2014.
Pei, Q., Zhang, D., Li, G., and Lee, H.: Short-and long-term impacts of climate variations on the agrarian economy in pre-industrial Europe, Clim. Res., 56, 169–180, https://doi.org/10.3354/cr01145, 2013.
Peng, Y. and Xu, Y.: A preliminary study on the simulation of drought and flood events in eastern China during the past 530 years, Quatern. Sci., 29, 1095–1103, 2009.
Pfister, C., Luterbacher, J., Wanner, H., Wheeler, D., Brázdil, R., Ge, Q., Hao, Z., Moberg, A., Grab, S., and Rosario del Prieto, M.: Documentary evidence as climate proxies, in: PAGES/CLIVAR Proxy Uncertainty Workshop, 8 June 2008, Trieste, Italy, https://www.hist.unibe.ch/e11168/e52524/e69145/e186327/e188618/19_Pfister-al-Documentary-White_Paper_09_ger.pdf (last access: 7 October 2024), 2008.
Shen, C., Wang, W., Hao, Z., and Gong, W.: Exceptional drought events over eastern china during the last five centuries, Climatic Change, 85, 453–471, https://doi.org/10.1007/s10584-007-9283-y, 2007.
Tan, L., Cai, Y., An, Z., Edwards, R. L., Cheng, H., Shen, C., and Zhang, H.: Centennial- to decadal-scale monsoon precipitation variability in the semi-humid region, northern China during the last 1860 years: Records from stalagmites in Huangye Cave, Holocene, 21, 287–296, https://doi.org/10.1177/0959683610378880, 2011a.
Tan, L., Cai, Y., An, Z., Yi, L., Zhang, H., and Qin, S.: Climate patterns in north central China during the last 1800 yr and their possible driving force, Clim. Past, 7, 685–692, https://doi.org/10.5194/cp-7-685-2011, 2011b.
Tan, Q.: The historical atlas of China (Volume 7): the Yuan dynasty period and the Ming dynasty period, China Cartographic Publishing House, Beijing, China, ISBN 7-5031-1843-1, 1982.
Tan, X.: Study of major drought catastrophes in China in recent 500 years, J. Disast. Prevent. Mitig. Eng., 23, 77–83, 2003.
Tan, X.: Drought disaster trends shown by drought statistics in the past 500 years, China Water Resour., 7, 51–53+21, 2001.
Teng, J., Su, Y., and Fang, X.: The reconstruction and analysis of famine sequence from the Western Han to the Qing Dynasty (206 BC–1911 AD), J. Chin. Hist. Geogr., 29, 26–32, 2014.
Tian, F., Chen, X., and Su, Y.: Comparative analysis of extreme drought events and social impacts in henan province during the middle ming dynasty, Weather Clim. Soc., 14, 1009–1021, https://doi.org/10.1175/WCAS-D-22-0015.1, 2022.
Tian, F., Su, Y., and Gong, Z.: How did ancient China prevent the transition from extreme drought to famine? Taking Wanli drought of the Ming dynasty as an example, Int. J. Disast. Risk Reduct., 110, 104618, https://doi.org/10.1016/j.ijdrr.2024.104618, 2024.
Twitchett, D., and Fairbank, J.K.: The Cambridge History of China, in: Vol. 7: The Ming dynasty, 1368–1644, Part 1, Cambridge University Press, Cambridge, UK, https://doi.org/10.1017/CHOL9780521243322, 1998.
Wang, F.: Quantitative methods and applications in GIS, CRC Press, New York, USA, ISBN 9780429190261, 2006.
Wang, X., Chen, F., Zhang, J., Yang, Y., Li, J., Hasi, E., Zhang, C., and Xia, D.: Climate, desertification, and the rise and collapse of China's historical dynasties, Hum. Ecol., 38, 157–172, https://doi.org/10.1007/s10745-009-9298-2, 2010.
Wei, Z.: Spatio-temporal characteristics of famine and its environmental causes in the Jiangsu-Shanghai region during the Qing Dynasty (1644–1911), Prog. Geogr., 39, 1333–1344, 2020.
Wright, H. E. and Thorpe, J. L.: Climatic change and the origin of agriculture in the Near East, in: Global Change in the Holocene, edited by: Mackay, A., Battarbee, R., Birks, J., and Oldfield, F., Routledge, London, UK, 49–62, ISBN 9780340762233, 2003.
Xiao, L.: Spatio-temporal distribution of famine and its relationship with climate, disaster, harvest in North China during 1736–1911, Adv. Earth Sci., 35, 478–487, 2020.
Xu, A., Yang, L. E., Yang, W., and Chen, H.: Water conservancy projects enhanced local resilience to floods and droughts over the past 300 years at the Erhai Lake basin, Southwest China, Environ. Res. Lett., 15, 125009, https://doi.org/10.1088/1748-9326/abc588, 2021.
Yancheva, G., Nowaczyk, N. R., Mingram, J., Dulski, P., Schettler, G., Negendank, J. F. W., Liu, J. Q., Sigman, D. M., Peterson, L. C., and Haug, G. H.: Influence of the intertropical convergence zone on the East Asian monsoon, Nature, 445, 74–77, https://doi.org/10.1038/nature05431, 2007.
Yang, L.E., Bork, H. R., Fang, X., and Mischke, S.: Socio-Environmental Dynamics along the Historical Silk Road, Springer-Nature, Cham, https://doi.org/10.1007/978-3-030-00728-7, 2019.
Yang, L. E., Chen, J., Geng, J., Fang, Y., and Yang, W.: Social resilience and its scale effects along the historical Tea-Horse Road, Environ, Res. Lett., 16, 045001, https://doi.org/10.1088/1748-9326/abea35, 2021.
Yin, J., Su, Y., and Fang, X.: Relationships between temperature change and grain harvest fluctuations in China from 210 BC to 1910 AD, Quatern. Int., 355, 153–163, 2015.
Yin, J., Fang, X., and Su, Y.: Correlation between climate and grain harvest fluctuations and the dynastic transitions and prosperity in China over the past two millennia, Holocene, 26, 1914–1923, https://doi.org/10.1177/0959683616646186, 2016.
Yue, W., Chen, F., Torbenson, M. C., Zhao, X., Zheng, Y., Xu, Y., Hu, M., Wang, S., Hou, T., Zhang, H., and Chen, Y.: Late Ming Dynasty weak monsoon induced a harmonized megadrought across north-to-south China, Commun. Earth Environ., 5, 439, https://doi.org/10.1038/s43247-024-01602-5, 2024.
Zhang, D. and Lu, L.: Anti-correlation of summer/winter monsoons?, Nature, 450, E7–E8, https://doi.org/10.1038/nature06338, 2007.
Zhang, D., Fang, X., and Yang, L. E.: Comparison of the HYDE cropland data over the past millennium with regional historical evidence from Germany, Reg. Environ. Change, 21, 1–15, https://doi.org/10.1007/s10113-020-01735-1, 2021.
Zhang, P., Cheng, H., Edwards, R. L., Chen, F., Wang, Y., Yang, X., Liu, J., Tan, M., Wang, X., Liu, J., An, C., Dai, Z., Zhou, J., Zhang, D., Jia, J., Jin, L., and Johnson, K. R.: A Test of Climate, Sun, and Culture Relationships from an 1810-Year Chinese Cave Record, Science, 322, 940–942, https://doi.org/10.1126/science.1163965, 2008.
Zhang, Y., Tian, Q., Guillet, S., and Stoffel, M.: 500-yr. precipitation variability in Southern Taihang Mountains, China, and its linkages to ENSO and PDO, Climatic Change, 144, 419–432, https://doi.org/10.1007/s10584-016-1695-0, 2017.
Zheng, J., Wang, W., Ge, Q., Man, Z., and Zhang, P.: Precipitation variability and extreme events in eastern China during the past 1500 years, Terr. Atmos. Ocean. Sci., 17, 579–592, https://doi.org/10.3319/TAO.2006.17.3.579(A), 2006.
Zheng, J., Xiao, L., Fang, X., Hao, Z., Ge, Q., and Li, B.: How climate change impacted the collapse of the Ming dynasty, Climatic Change, 127, 169–182, https://doi.org/10.1007/s10584-014-1244-7, 2014.
Zhong, Z., Zhao, J., Yu, X., and Ju, H.: Calculation and Analysis on Water Requirements of Major Crops in Northern China, Chin. J. Agrometeorol., 2, 2–5+53, 2000.
Zhou, Z., Guo, H., and Jin, R.: General history of Chinese administrative regions: the Ming Dynasty volume, Fudan University Press, Shanghai, China, ISBN 978-7-309-12702-7, 2007.
In the 17th century, the Yellow River flowed through Jiangsu Province into the sea. However, after a breach at Tongwagang, Henan Province, in 1855, its course changed. Currently, it does not flow through Jiangsu Province, as illustrated in Fig. 1.
Quoted from Neihuang County Chronicles.
Quoted from Xinzheng County Chronicles.
- Abstract
- Introduction
- Data and methods
- The evolution of drought
- The evolution of famine and comparison with drought
- The statistical relationship between drought and famine
- Discussion
- Conclusion
- Appendix A: Sources of historical records used in this study
- Appendix B: Year-by-year spatial distribution of drought during 1627–1644
- Appendix C: The division of sub-provincial zones
- Appendix D: Year-by-year spatial distribution of famine during 1627–1644
- Data availability
- Author contributions
- Competing interests
- Disclaimer
- Acknowledgements
- Financial support
- Review statement
- References