the Creative Commons Attribution 4.0 License.
the Creative Commons Attribution 4.0 License.
 | 16 Sep 2024
Contrasting responses of summer precipitation to orbital forcing in Japan and China over the past 450 kyr
Taiga Matsushita
Mariko Harada
Hiroaki Ueda
Takeshi Nakagawa
Yoshimi Kubota
Yoshiaki Suzuki
Youichi Kamae
Understanding orbital-scale changes in East Asian summer monsoon (EASM) precipitation is a fundamental issue in paleoclimate research as it helps assess the response of the East Asian monsoon to different climatic forcings, such as insolation, ice volume, and greenhouse gases. However, due to inconsistencies between different proxies, the fundamental driving force for EASM variability remains controversial. The present study simulated the global climate under given insolation changes over the past 450 kyr using a climate model, version 2.3 of the Meteorological Research Institute's Coupled General Circulation Model (MRI-CGCM2.3). Changes in summer insolation over East Asia resulted in distinct climatic responses in China and Japan: an increase in summer insolation led to increased summer precipitation in China and decreased summer precipitation in Japan. Composite analyses of simulated climate under strong boreal-summer insolation suggest that warming of the Indian Ocean occurs under intense insolation, resulting in the intensification of the North Pacific subtropical high (sub-high). The northern shift in the monsoon front, associated with the intensified sub-high, leads to an increase in rainfall in the coastal area of China. In contrast, the intensity of the EASM around Japan is affected by the strength of the North Pacific High. Under strong insolation, the increase in thermal contrast between the North American continent and the North Pacific Ocean intensifies the North Pacific High, decreasing summer precipitation around Japan. Thus, strong regional differences in the effects of solar-insolation variability on summer precipitation in East Asia exist due to interactions with different ocean basins.
- Article
(6175 KB) - Full-text XML
-
Supplement
(1637 KB) - BibTeX
- EndNote


The East Asian summer monsoon (EASM) plays an essential role in the hydrological cycle over East Asia, affecting food production, water supply, and extreme events (such as floods and droughts in densely populated areas; An et al., 2015). Understanding the variability in the EASM is crucial for assessing future climate projections (e.g. global warming) in East Asia and, eventually, human social and economic activity. Notably, investigating the long-term variation in the EASM over geological time is of fundamental importance in both modern climatology and paleoclimatology as it enables us to reveal the mechanisms of EASM variability under different climatic forcings.
The Late Pleistocene climate, characterized by periodic changes in Northern Hemisphere summer insolation and a high-latitude ice volume, has received considerable attention. The insolation cycle is caused by variations in three of the Earth's orbital parameters: precession (23 kyr periodicity), obliquity (41 kyr), and eccentricity (100 kyr) (Berger, 1978; Berger and Loutre, 1991). Although changes in eccentricity have a relatively small effect on insolation variability, the eccentricity cycle is considered an underlying cause of the 100 kyr glacial–interglacial cycle (Lisiecki and Raymo, 2005) through interactions between the climate, ice sheets, and the lithosphere–asthenosphere system (Abe-Ouchi et al., 2013). These orbital and glacial factors might have been the major driving forces of EASM variability during the Late Pleistocene (Wang et al., 2017).
Geological records indicate that the EASM is affected by changes in insolation, ice volume, or both (Cheng et al., 2016; Clemens et al., 2018; G. Liu et al., 2020; Sun et al., 2006, 2015, 2019). For example, loess–paleosol records from the Chinese Loess Plateau, northern China, show the coexistence of 100, 41, and 23 kyr periods, along with a distinguished 100 kyr periodicity associated with the glacial–interglacial cycle (Beck et al., 2018; Nie et al., 2017; Sun et al., 2015). The local seawater δ18O of the East China Sea has been dominated by 100 and 41 kyr cycles, with almost no precession variance (Clemens et al., 2018). These results suggest that the EASM is more sensitive to high-latitude ice volume variations than to direct insolation changes. In contrast, speleothem δ18O records from caves in southern China show an almost pure precession cycle, implying the dominance of direct insolation forcing in summer precipitation over southern China (Cheng et al., 2016; Wang et al., 2008; Zhang et al., 2019). Similarly, a long pollen record from Lake Biwa in Japan contains distinct precession and obliquity signals, suggesting that the EASM has been controlled primarily by insolation forcing and that the effect of ice volume changes only becomes predominant when insolation is weak (Nakagawa et al., 2008).
The different responses of these proxies are likely interpreted as regional heterogeneity in the relative impact of EASM driving forces. For instance, G. Liu et al. (2020) suggested that the lack of glacial–interglacial cycles in the speleothem δ18O may be explained by the moisture transport pathway effect, in which glacial–interglacial cycles in the monsoon moisture source decrease landward. However, due to proxy data being scattered across limited areas, forming a spatially continuous interpretation has proven difficult. In addition, proxies potentially have complex sensitivities to several climatic factors (e.g. temperature changes and moisture sources), making the interpretation of records difficult (An et al., 2015; Clemens et al., 2010, 2018; X. Liu et al., 2020).
To reveal the mechanisms of EASM variability, numerous modelling studies with different boundary conditions have been conducted over the last decades (e.g. Braconnot et al., 2007a; Chen et al., 2011; Dai et al., 2021; Kutzbach, 1981; Kutzbach et al., 2008; Li et al., 2013; Liu et al., 2014; Lyu et al., 2021; Shi et al., 2011; Suarez and Held, 1976; Sun et al., 2015, 2018, 2019, 2021, 2023; Thomas et al., 2016; Weber and Tuenter, 2011; Yin et al., 2008, 2009, 2014; Yin and Berger, 2012; Zhao et al., 2020). Many of these studies have consistently indicated the presence of the 20 kyr precession cycle in summer precipitation across most EASM regions (Li et al., 2013; Sun et al., 2015; Lyu et al., 2021; Weber and Tuenter, 2011), suggesting that insolation appears to be the key factor determining the variability in the EASM (Dai et al., 2021; Li et al., 2013; Sun et al., 2023). The impact of ice volume on summer precipitation varies between regions (Sun et al., 2015, 2021; Lyu et al., 2021); for instance, Lyu et al. (2021) indicated that the effect of the glacial–interglacial 100 kyr cycle becomes significant in the 20–25° N region, whereas in other regions, summer precipitation is primarily influenced by the 20 kyr precession cycle. These results suggest that, in the EASM regions, summer rainfall variability is affected by orbital and glacial forcings; however, the relative impact of each forcing differs across regions (e.g. Dai et al., 2021; Sun et al., 2015). The proposed mechanisms that cause spatial and temporal variability in the EASM are often attributed to the anomalous western North Pacific subtropical high (sub-high) (Dai et al., 2021; Liu et al., 2014; Sun et al., 2015), which causes shifts in seasonal Meiyu/Baiu rain bands (Yihui and Chan, 2005), and variation in southerly wind that provides moisture to EASM regions (Liu et al., 2014). However, the simulated regionality varied between studies due to the unclear position of the sub-high depending on the model (Dai et al., 2021), and the detailed mechanisms of the sub-high fluctuation remain ambiguous. In addition, determining the individual impact of insolation and ice volume changes on EASM variability remains challenging because of the complex relationship between orbital and glacial forcings (Yin et al., 2014; Lyu et al., 2021). Thus, monsoon variability under individual forcings (insolation or ice volume) should be analysed more substantially with respect to the global climate system, including atmospheric circulation, atmosphere–ocean interactions, and teleconnections.
In the present study, we aim to reassess the relative impact of insolation changes due to orbital forcing on EASM variability. We conducted 450 kyr long, idealized, time-sliced simulations with boundary conditions based on the Earth's three orbital parameters (Berger and Loutre, 1999) to reconstruct orbital-scale EASM variability using a global climate model. Using the time-slice method, the quasi-equilibrium climate state of each period was simulated at 5 kyr intervals. This study reveals the possible mechanisms responsible for regionally different responses of EASM variability to insolation changes through data–model comparisons over East Asia. Section 2 describes the climate model and the experimental design (or datasets). Section 3 explains the model results and compares the numerical results with proxy data. Section 4 discusses the possible climate systems associated with EASM variability that are responsible for the known regionality of proxy data. In Sect. 5, we summarize and conclude the paper.
2.1 Model
Experiments were performed using version 2.3 of the Meteorological Research Institute's Coupled General Circulation Model (MRI-CGCM2.3) (Yukimoto et al., 2006). The atmospheric component of the model is a spectral model with a T42 spatial resolution (approximately 2.8°) and 30 vertical layers, based on Shibata et al. (1999). The oceanic component of the model is a Bryan–Cox-type ocean general circulation model with a horizontal resolution of 2.5° in longitude and 0.5–2° in latitude and 23 vertical layers. Details of the model are described in Yukimoto et al. (2006).
The land component, incorporating vegetation effects, relies on the Simple Biosphere (SiB) model (Sellers et al., 1986; Sato et al., 1989). In this model, ice sheets are treated as one of the vegetation types, which is reflected in the albedo in the simulation. Vegetation is fixed as a boundary condition in each simulation. Thus, the dynamics of vegetation and ice sheets are not integrated; adjustments in ice volume can be accommodated by modifying land vegetation and altitude, specified as boundary conditions. Sea ice compactness and thickness are forecasted using thermodynamics, horizontal advection, and diffusion principles.
MRI-CGCM2 has been widely used for future climate predictions (e.g. Kitoh, 2007; Ueda et al., 2006) and paleoclimate simulations (e.g. Braconnot et al., 2007a; Kamae et al., 2016, 2017; Kitoh et al., 2007; Ueda et al., 2011). The reproducibility of MRI-CGCM2 has been studied by Yukimoto et al. (2006) and shows good agreement with observations of the distribution of surface air temperature and precipitation. The model effectively simulates summer precipitation over East Asia, including its onset timing and migration (Yukimoto et al., 2006), and has been used for paleo-Asian monsoon simulations, including the Last Glacial Maximum (LGM) (Ueda et al., 2011), the Medieval Warm Period, and the Little Ice Age (Kamae et al., 2017).
2.2 Experimental design
We used a time-slice approach, dividing the last 450 kyr into 91 periods (5 kyr intervals). The quasi-equilibrium climate state was evaluated for each period. While this approach may not fully capture the transient behaviour of climate systems, as demonstrated in recent transient simulations (Chen et al., 2011; Clemens et al., 2018; Kutzbach et al., 2008; Timmermann et al., 2007), the mean climate states obtained through the time-slice method are well suited for evaluating the responses of prescribed external forcings to monsoon variability. This methodology has been employed in numerous studies (Kutzbach, 1981; Liu et al., 2014; Wen et al., 2016). The time-slice approach allows us to calculate the long-term integral within the same period, enabling us to discuss the seasonal evolution of the EASM in addition to long-term climate responses to orbital forcing (Cubasch et al., 1995).
As a boundary condition, insolation was simulated from the Earth's three orbital parameters (longitude of perihelion in terms of precession, obliquity, and eccentricity) for each corresponding time period, based on Berger and Loutre (1999). In all time-slice experiments, other time-varying boundary conditions, such as vegetation, the concentration of greenhouse gases, ice sheets, topography, and land–sea boundaries, were prescribed at pre-industrial (PI) levels (0 ka). In particular, the concentration of greenhouse gases was set to the same value as that used for the second phase of the Paleoclimate Modelling Intercomparison Project (PMIP 2) (Braconnot et al., 2007a, b). Although ice volume changes and variations in greenhouse gas concentrations might impact EASM variability (Clemens et al., 2018; Yin et al., 2008; Yin and Berger, 2012), we focused exclusively on the effect of orbital changes to evaluate the relative impact of insolation changes on the EASM. All experiments were conducted without flux adjustments. To eliminate the effects of climate drift (Kitoh et al., 2007), the model was integrated for 230 years prior to the main experiments. Then, the result of the 230th year was forwarded to the main experiments as an initial condition. After integrating another 55 years into the main experiments, the average output of the last 50 years was analysed as the representative climate state of each time period.
The “anomaly” in the climate state of each period, defined as the difference in climate state between the PI era and each time period, was analysed to capture the effect of insolation variability. In addition, we defined a strong period (SP) as a period in which the summer insolation anomaly at the top of the atmosphere across low–middle latitudes (20–40° N) exceeded 1 SD (standard deviation). Seasonality was discussed based on the Northern Hemisphere seasons. Specifically, this section used “summer” to refer to June–August (JJA). Unless otherwise noted, all correlation coefficients calculated in this study exceeded the 99.9 % confidence level using Pearson's t test.
In this section, we describe the simulated climate variability and its predominant cycles in the three main EASM regions: southeastern China (SEC), the Chinese Loess Plateau (CLP), and Japan (JP). These regions are defined as 24–33° N, 105–120° E; 34–38° N, 100–110° E; and 30–40° N, 130–143° E, respectively (Fig. 1). Figure 2 shows the simulated temporal variation in summer precipitation, annual precipitation, and summer temperature over the last 450 kyr (Fig. 2a) and the periodicity of each parameter (Fig. 2b). Summer precipitation variability in SEC and the CLP exhibited a strong correlation with changes in summer insolation and local summer temperature. Notably, the maxima of summer precipitation precisely coincided with the SPs of summer insolation (vertical pink bars in Fig. 2a). Furthermore, we found a strongly positive correlation between summer insolation and precipitation across SEC (R=0.94; p<0.001) and the CLP (R=0.78; p<0.001) (Fig. 3). These results confirm the significance of the effect of insolation on variability in the EASM in China and are further supported by previous simulations using different models, such as CCSM3 (Li et al., 2013) and HadCM3 (Lyu et al., 2021). All three regions (SEC, the CLP, and JP) exhibited similar variabilities in simulated local JJA temperatures, consistent with insolation changes – that is, summer temperature increased with increasing summer insolation. In JP, the relationship between summer insolation and precipitation was relatively unclear; the minima of summer precipitation corresponded to certain summer insolation SPs (Fig. 2a). The correlation coefficient between summer insolation and precipitation in JP was negative (; p<0.001) (Fig. 3). These results suggest that the effect of summer insolation on precipitation varies between regions, with notable differences in the response observed between China and Japan.
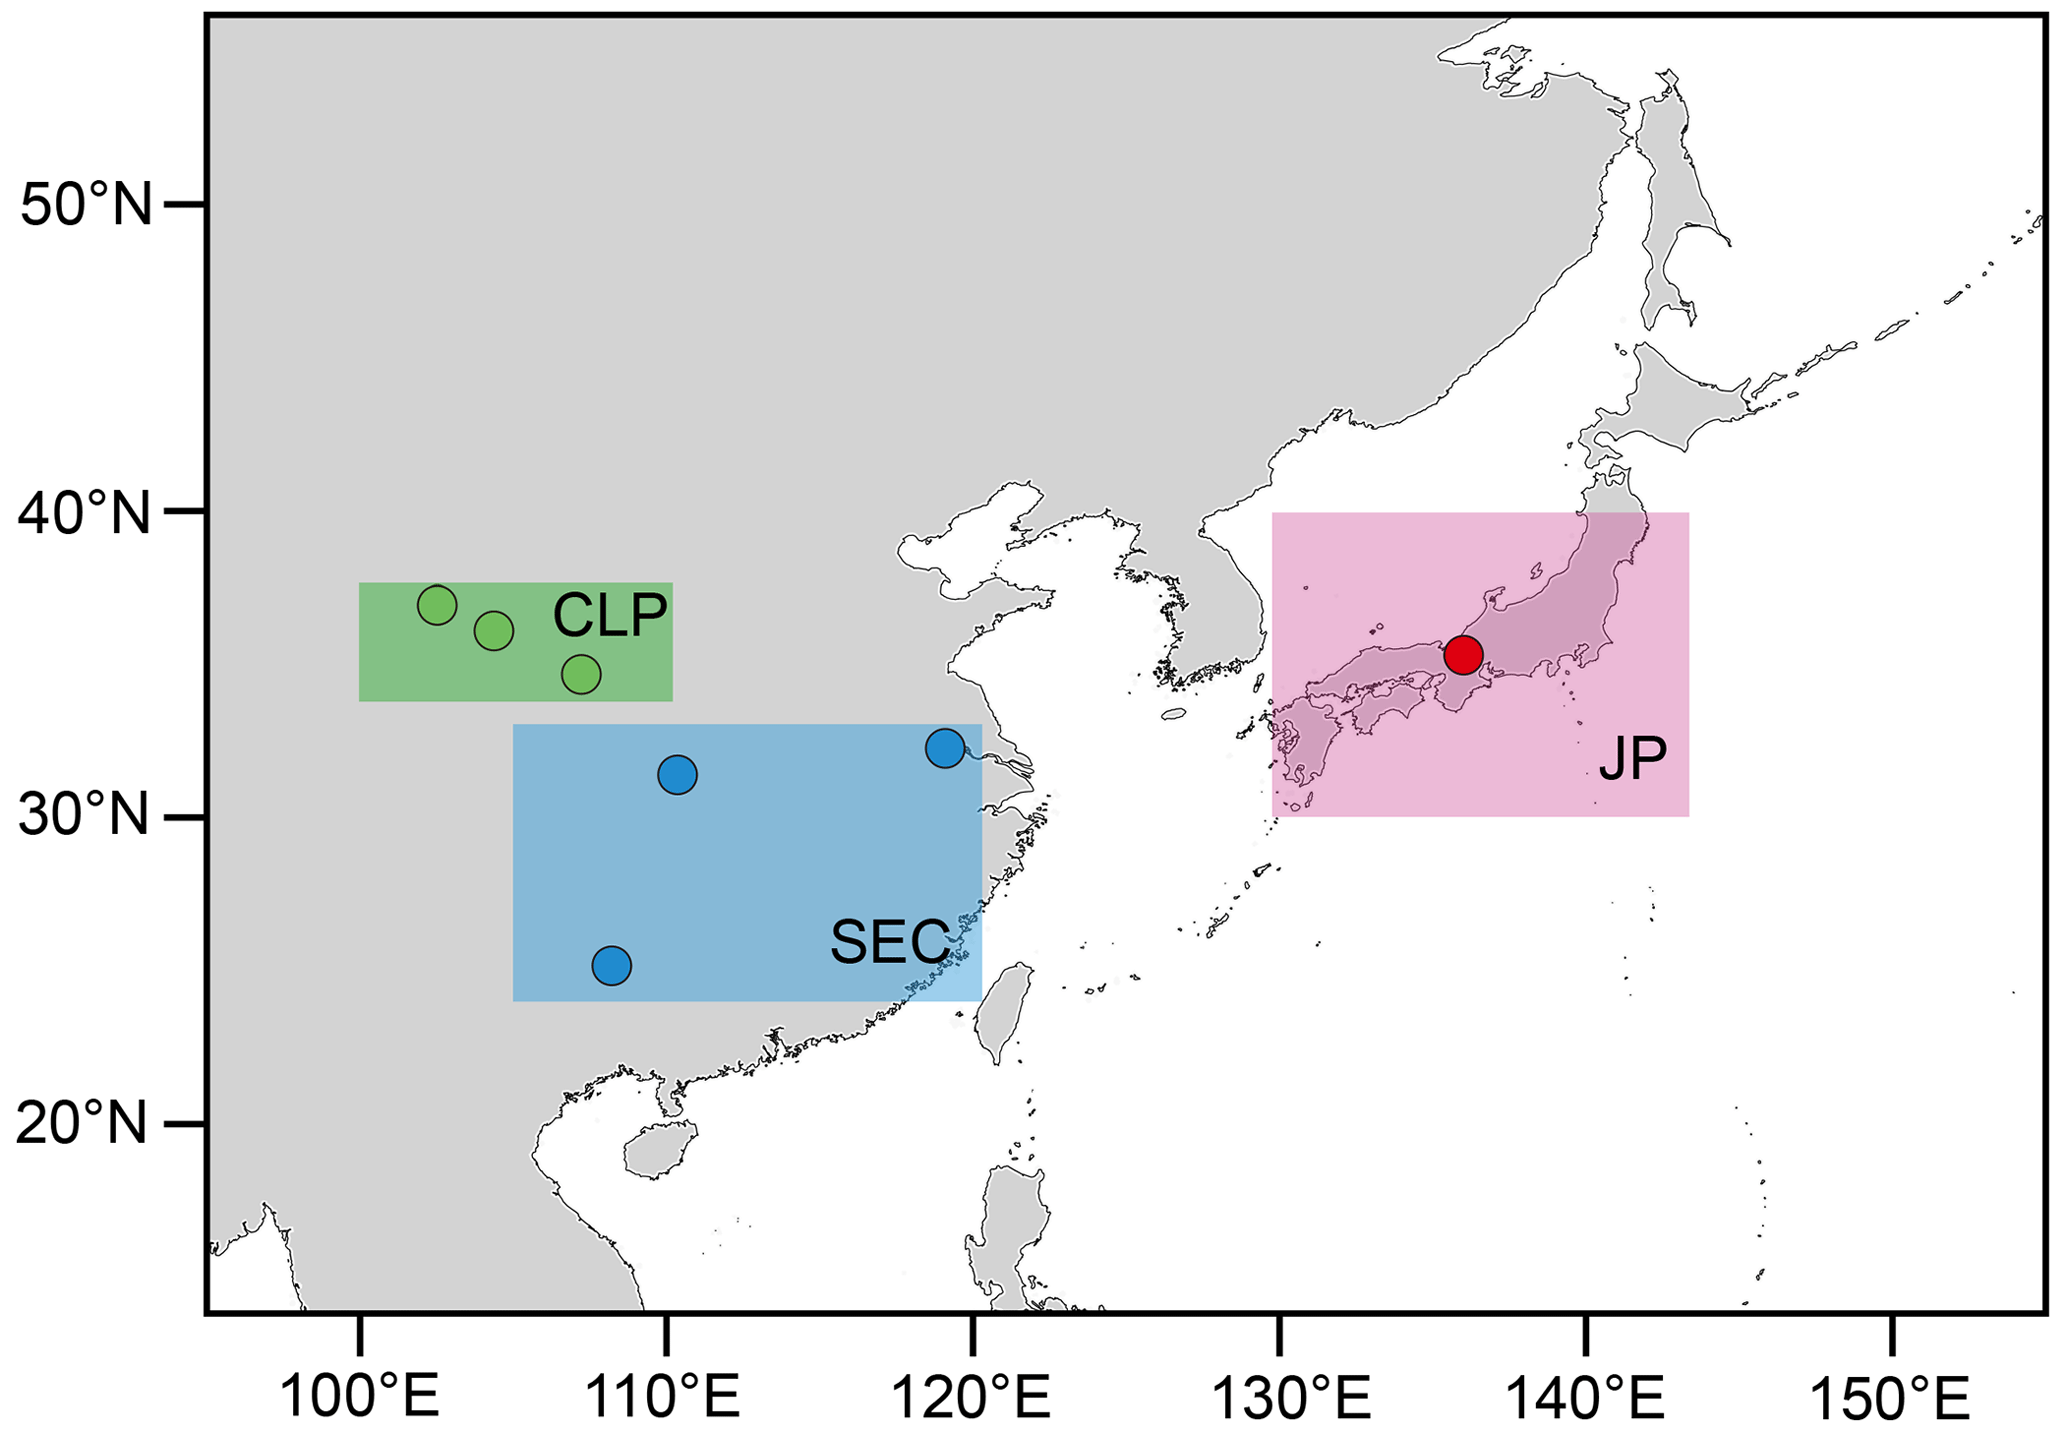
Figure 1The three EASM regions defined in this study. The blue area represents southeastern China (24–33° N, 105–120° E), the green area indicates the Chinese Loess Plateau (34–38° N, 100–110° E), and the red area represents Japan (30–40° N, 130–143° E). The circular plots indicate the locations of proxy records (Beck et al., 2018; Cheng et al., 2016; Nakagawa et al., 2008; Sun et al., 2015). The map was created using the free and open-source software QGIS.
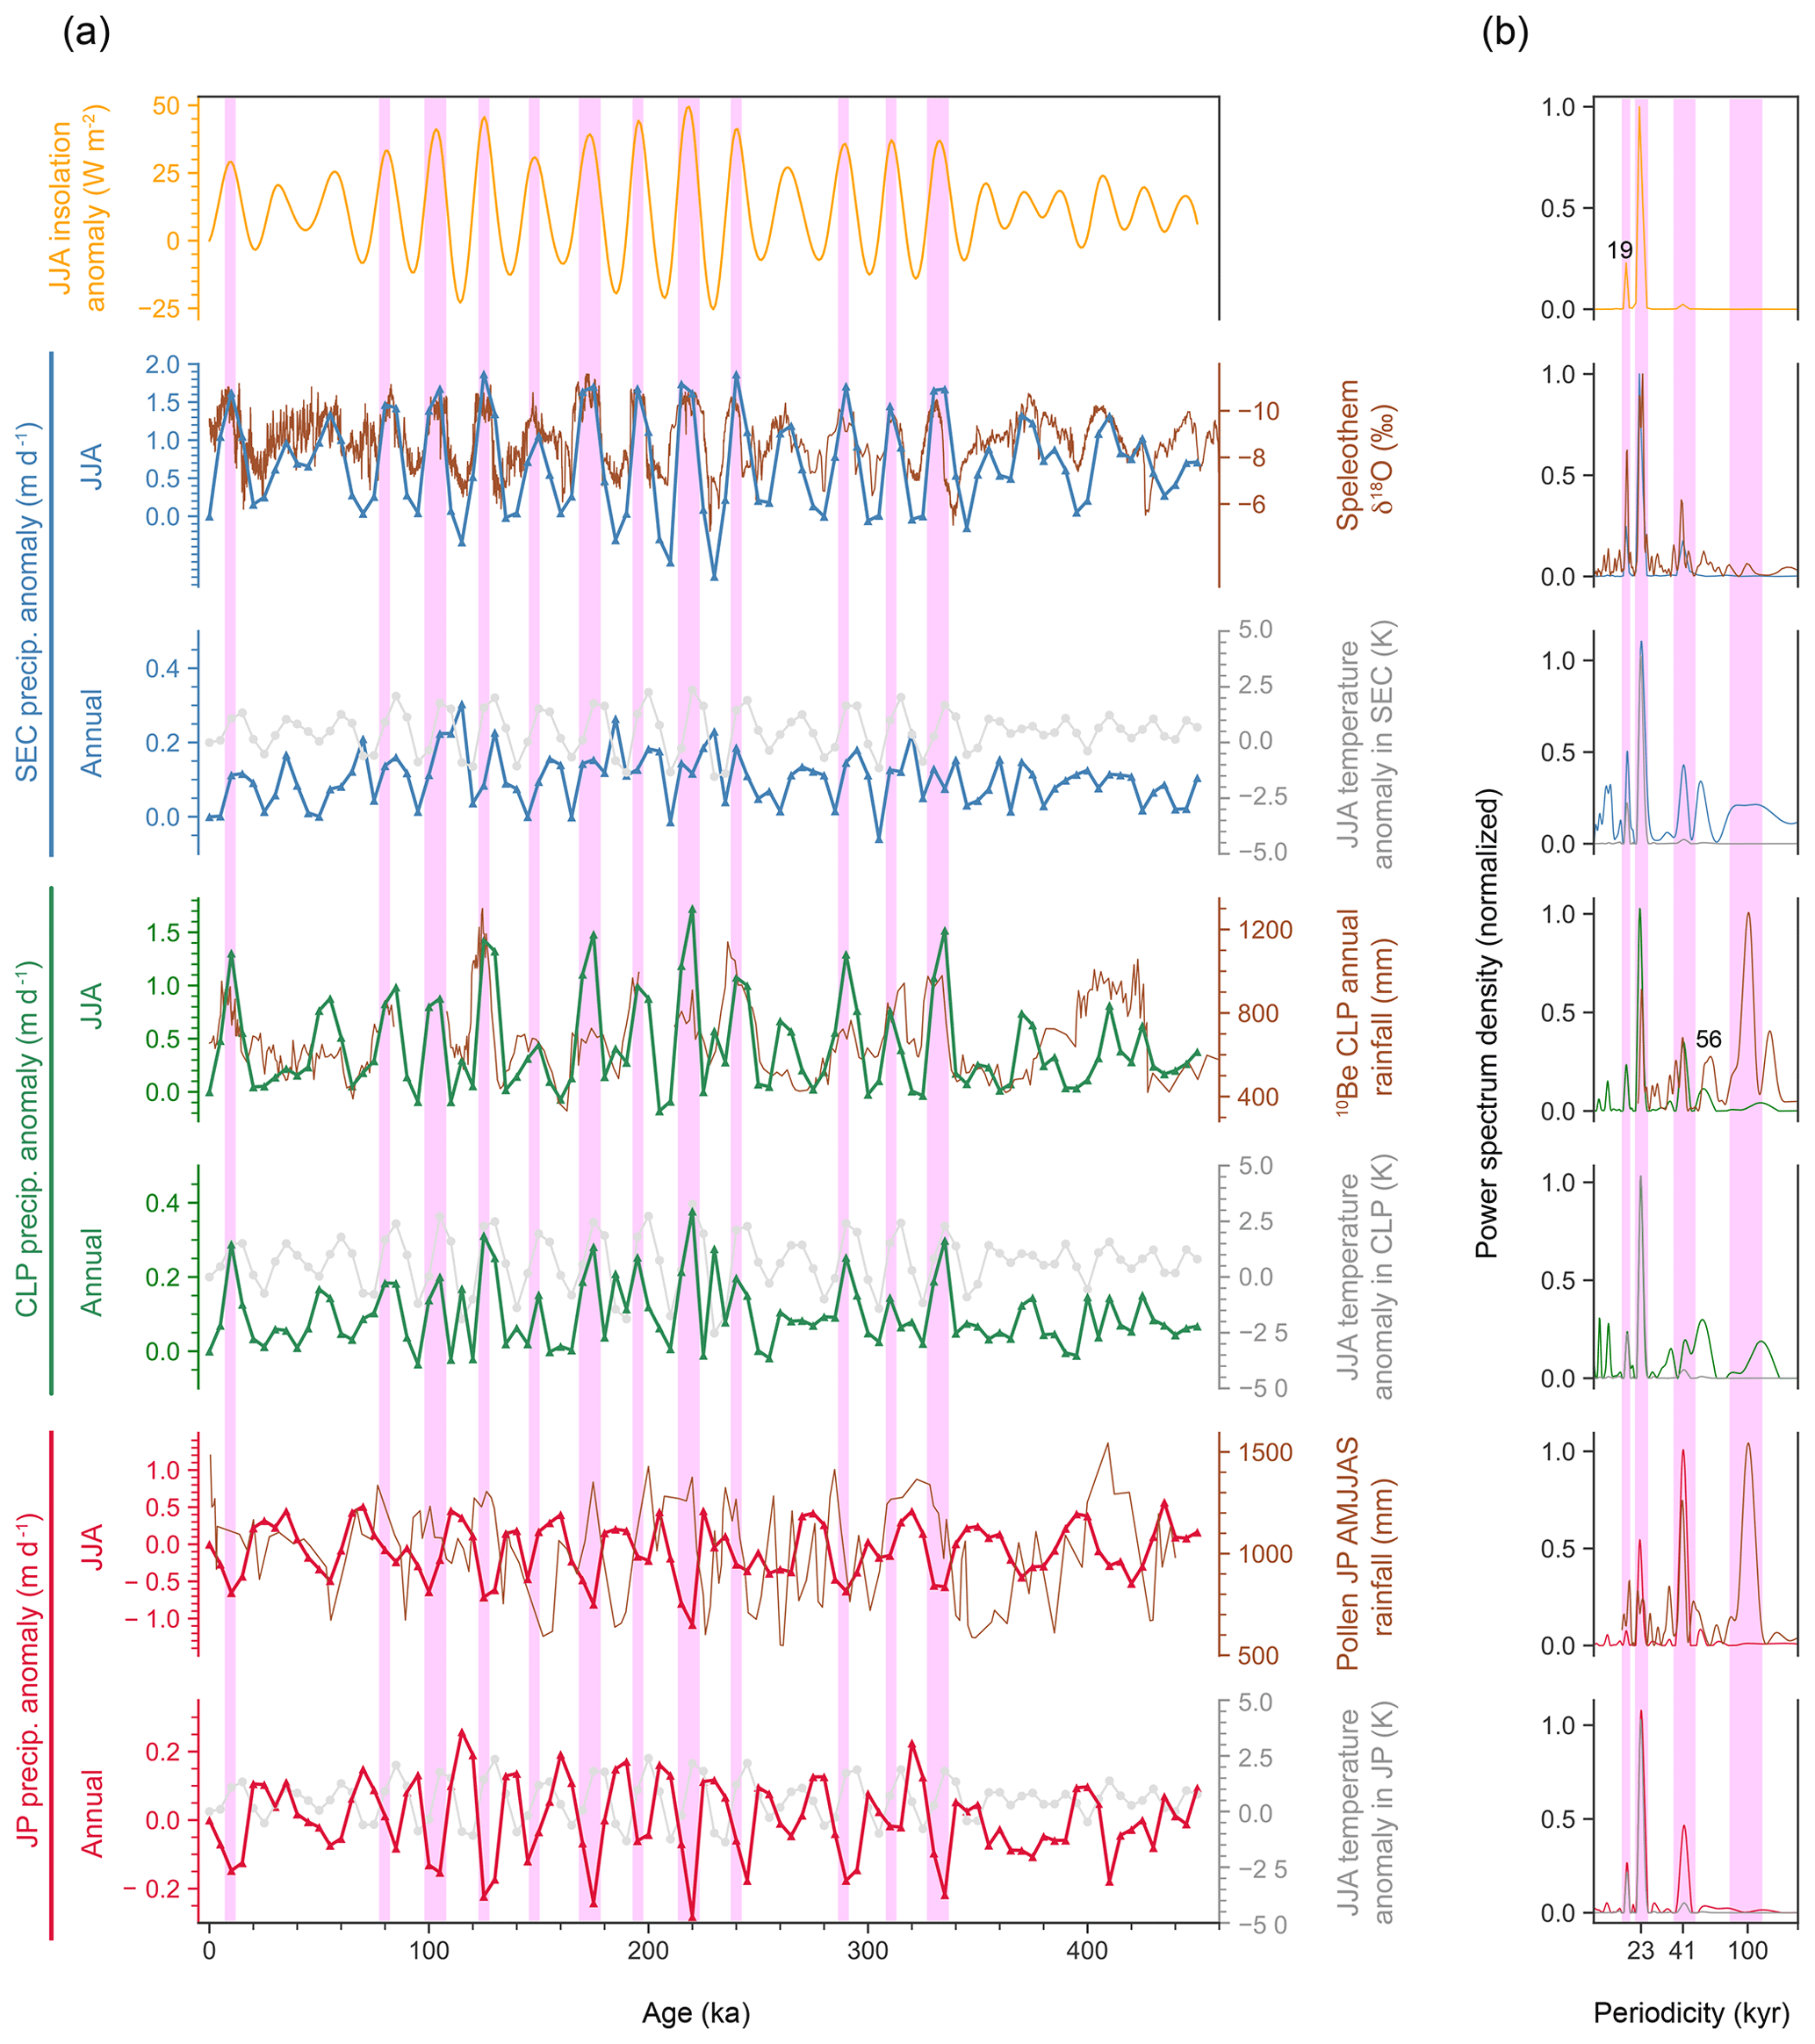
Figure 2(a) Temporal variation in the JJA insolation anomaly (orange; W m−2) and the simulated precipitation anomaly in SEC (blue), the CLP (green), and JP (red). Insolation was averaged over 20–40° N. The precipitation anomaly is given in mm d−1. The brown lines indicate proxy records for the following: speleothem δ18O over SEC (expressed in per mille; Cheng et al., 2016), 10Be-based annual rainfall over the CLP (given in millimetres; Beck et al., 2018), and pollen-based April–September (AMJJAS) rainfall variability in Lake Biwa, JP (expressed in millimetres; Nakagawa et al., 2008). The grey lines indicate the simulated annual temperature anomaly (expressed Kelvin) for each region. Variation in JJA insolation was simulated in the model using orbital parameters taken from Berger and Loutre (1999) and averaged over grid cells ranging from 20 to 40° N. The vertical pink bars in panel (a) denote strong periods (SPs). (b) Normalized power spectrum densities with respect to panel (a), expressed in kiloyears. The vertical pink bars in panel (b) denote the 23, 41, and 100 kyr cycles.
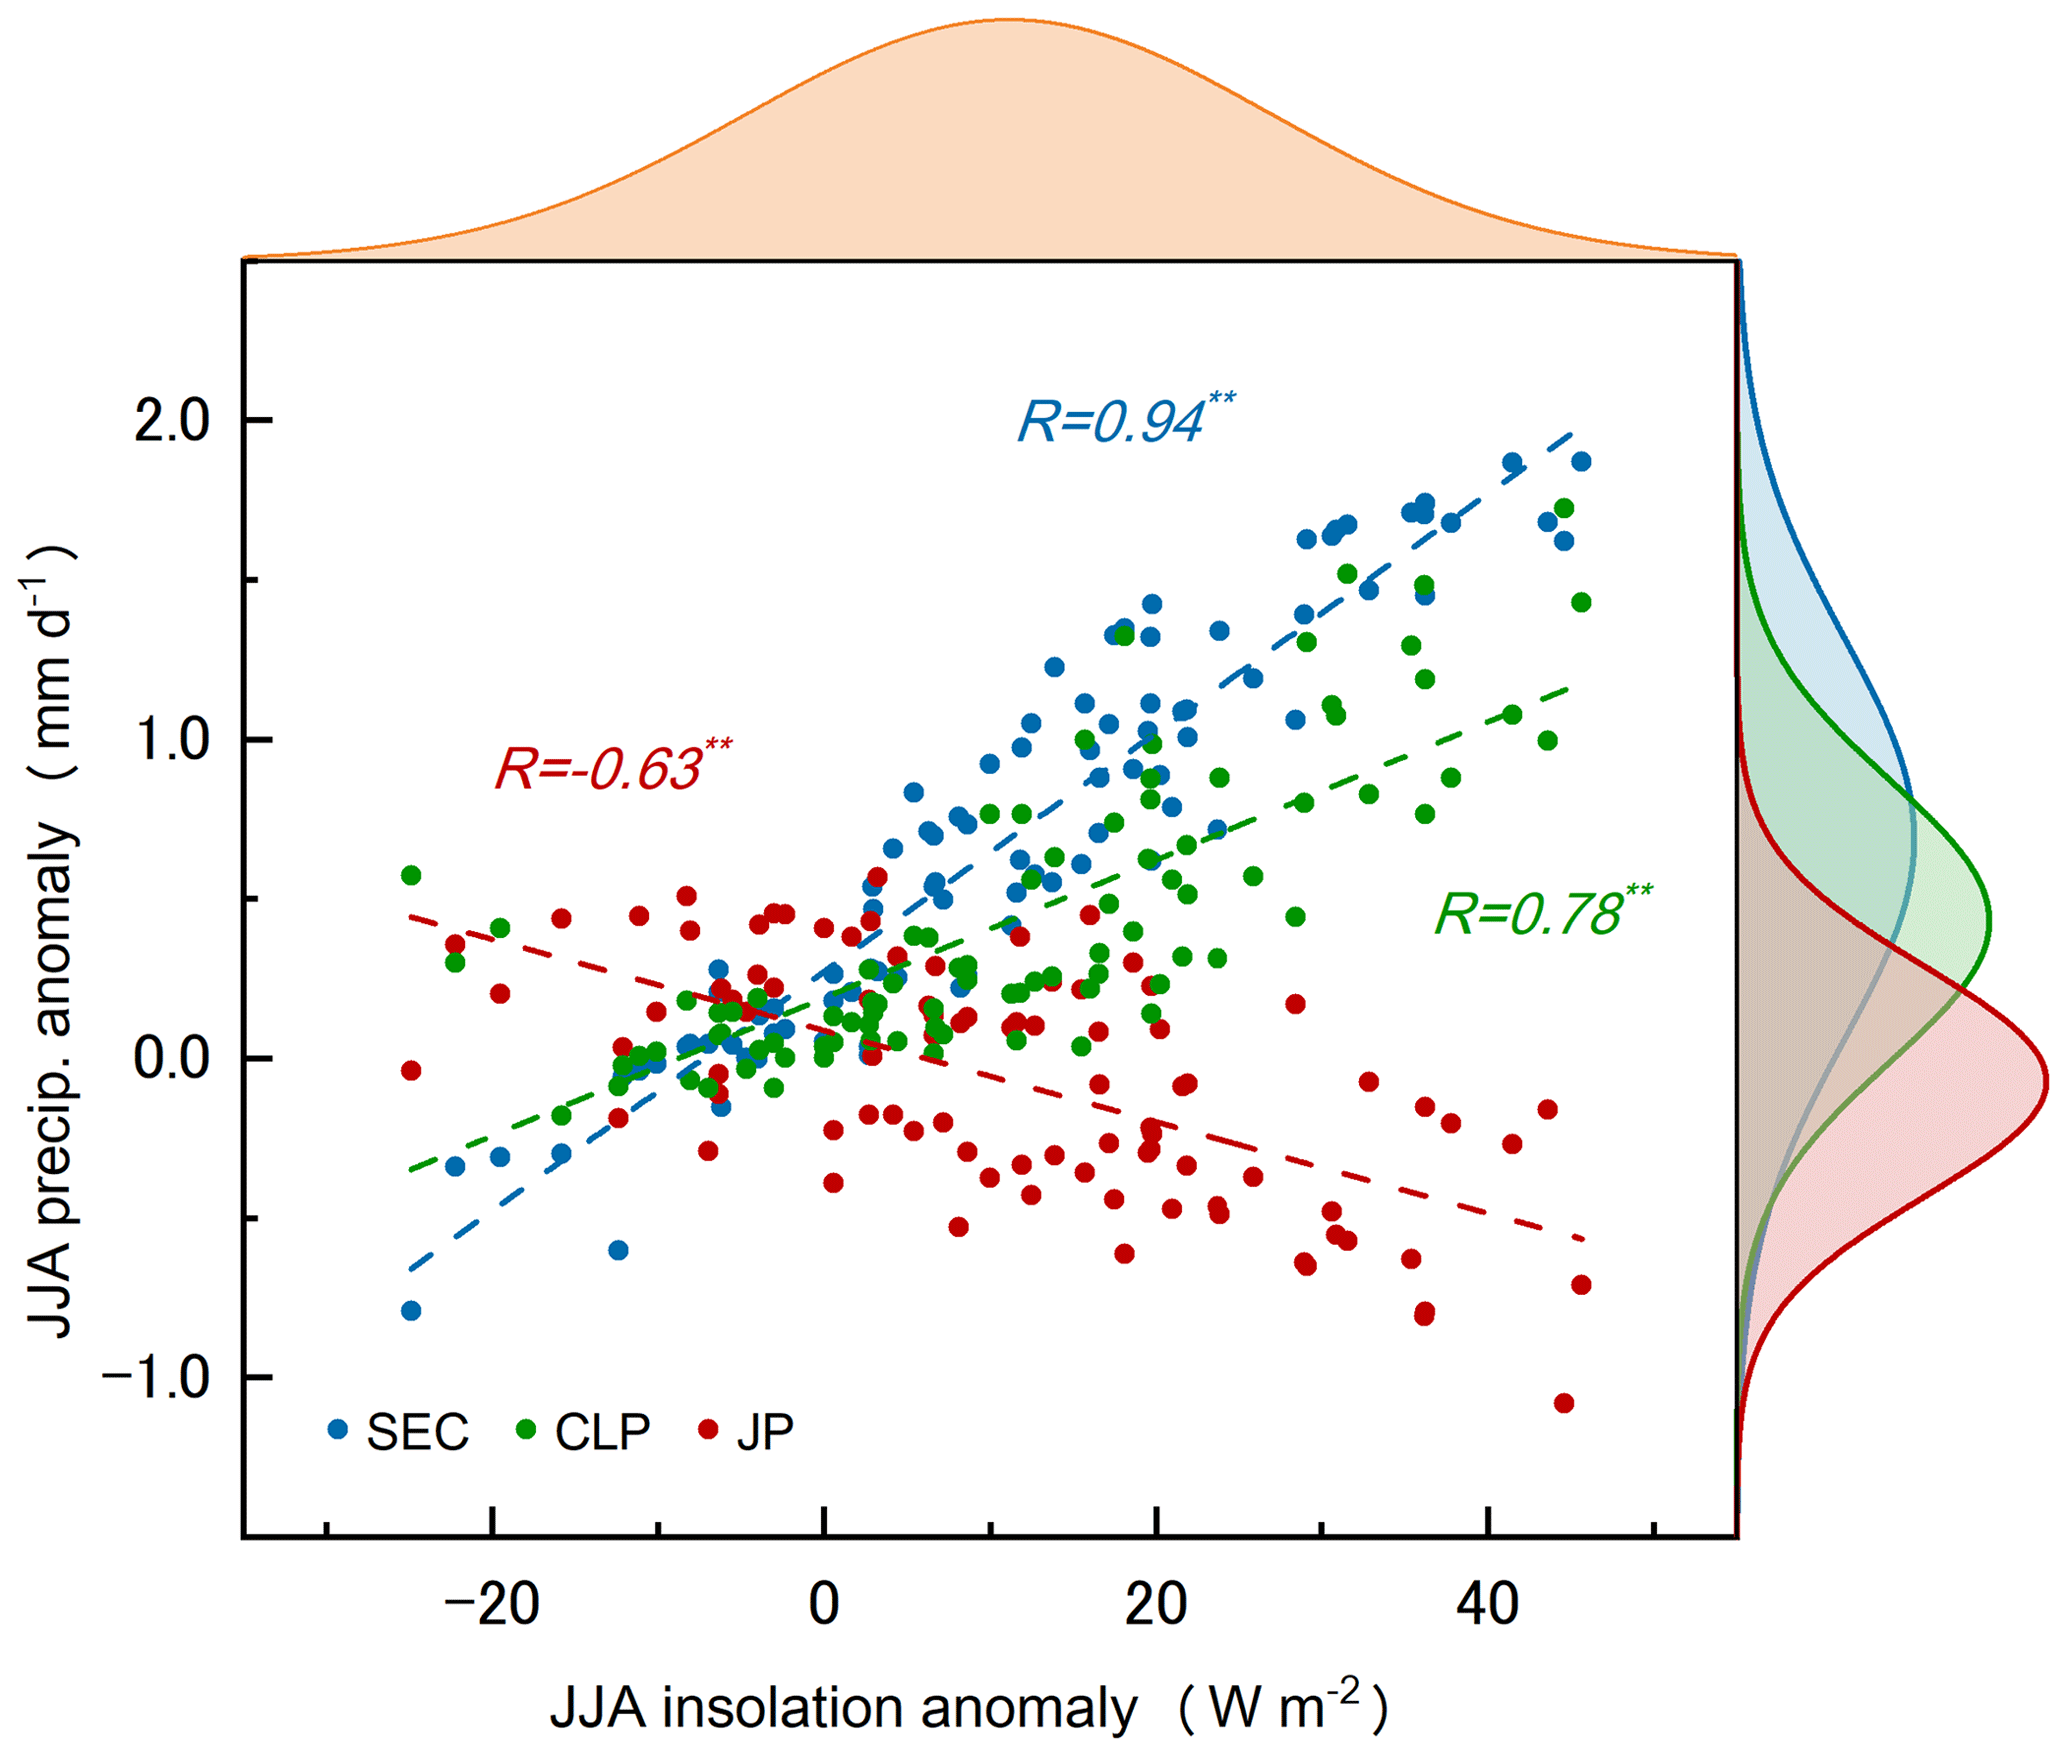
Figure 3Correlation between the simulated JJA insolation (W m−2) and precipitation (mm d−1) anomalies for the three EASM regions (SEC, the CLP, and JP). Insolation was averaged over 20–40° N. The notations in the diagram show correlation coefficients. The shaded curves at the top and on the right each show the normal distribution obtained from the mean and standard deviation of the data points.
In all three regions, annual precipitation varied over a 23 kyr cycle; however, the amplitude of its variability was smaller than that of summer precipitation variability (Fig. 2a). This likely occurred due to fluctuations in precipitation during the summer and other seasons cancelling each other out. Moreover, the contribution of other forms of seasonal precipitation to annual precipitation varied among regions. In SEC, summer variation in precipitation did not coincide with annual precipitation, suggesting that precipitation in other seasons offset the influence of summer precipitation on annual precipitation. In the CLP and JP, annual precipitation fluctuated in phase with summer precipitation, which is consistent with the fact that the contribution of summer precipitation in these areas is larger than that of precipitation in other seasons.
In each region, the periodicity of change in summer precipitation exhibited different characteristics (Fig. 2b). In SEC and the CLP, summer precipitation was dominated by precession bands (19 and 23 kyr), whereas in JP, it was dominated by an obliquity band (41 kyr), with the precession bands not being as strong as those in SEC and the CLP. A slight 56 kyr band, corresponding to one of the periodicities of precession (Berger, 1978), was found with respect to CLP summer precipitation variability, although it was visible neither in insolation nor in other regions. A 100 kyr eccentricity band was not found in any region because the effect of eccentricity on insolation is generally minimal compared to the effect of precession and obliquity (Schneider et al., 2011).
We compared the model results with proxy data, including oxygen isotope ratio (δ18O) records of speleothems from Chinese caves (located in SEC) (Cheng et al., 2016), meteoric 10Be preserved in Pleistocene Chinese loess (CLP) (Beck et al., 2018), and a pollen record from Lake Biwa (JP) (Nakagawa et al., 2008) (Fig. 2). The represented monsoon index differed between proxies. Speleothem δ18O is used to document summer monsoon variability (Wang et al., 2017), whereas the CLP 10Be records indicate the annual amount of precipitation, which can be treated as summer precipitation according to Beck et al. (2018). The pollen record for JP represents precipitation amounts from April to September (Nakagawa et al., 2008).
The model results were highly consistent with the cave δ18O records for SEC (Fig. 2a), with a correlation of (p<0.001) between simulated summer precipitation and δ18O records. The power spectrum densities also exhibited good agreement between the model results and proxy data, with only the precession cycle being distinguished in SEC (Fig. 2b). Proxy records from Chinese caves may be affected by climatic factors beyond summer precipitation variability (e.g. Clemens et al., 2010; Wang et al., 2017). For instance, Clemens et al. (2010) proposed that speleothem δ18O may reflect winter temperature variability. Nevertheless, our results indicate that changes in solar insolation alone have an impact on summer precipitation in China. The simulated variation in summer and annual rainfall across the CLP was consistent with the variation in annual precipitation inferred from 10Be data (Fig. 2a), although the correlation was not as strong as in SEC (with a correlation of R=0.42 (p<0.001) between simulated summer precipitation and the 10Be record. We further compared the simulated climate with available proxies for the CLP by comparing simulated mean annual air temperature (MAAT), EASM intensity (summer precipitation), and East Asian winter monsoon (EAWM) intensity (based on the index from Wang and Chen (2014)) with MAAT inferred from branched glycerol dialkyl glycerol tetraethers (brGDGTs), loess magnetic susceptibility as an EASM proxy, and mean grain size as an EAWM proxy, respectively (Thomas et al., 2016) (Fig. 4). The simulated variations in the EASM and EAWM were generally consistent with precession cycles appearing in the proxies (Figs. 2a and 4a); however, the variation in the 100 kyr periodicity, dominant in the proxy data, was not reproduced in the simulation (Figs. 2b and 4b). Almost no variation in mean annual air temperature (MAAT) was observed in the simulated results because, as with precipitation, the effects of solar radiation on temperature were offset on an annual basis. The deviation from the respective proxies for MAAT, the EASM, and the EAWM was likely derived from the lack of effect elicited by 100 kyr ice sheet variability and related internal feedback in our model. These characteristics corresponding to SEC and the CLP support the idea that summer precipitation variability in China is strongly influenced by changes in summer insolation, particularly in SEC. The inconsistency between proxy and model results for the CLP indicates that, although insolation certainly affects summer precipitation variability in northern China, the actual variability in summer precipitation should be assessed by incorporating other forcings and internal feedback, such as global ice volume change and variations in greenhouse gases.
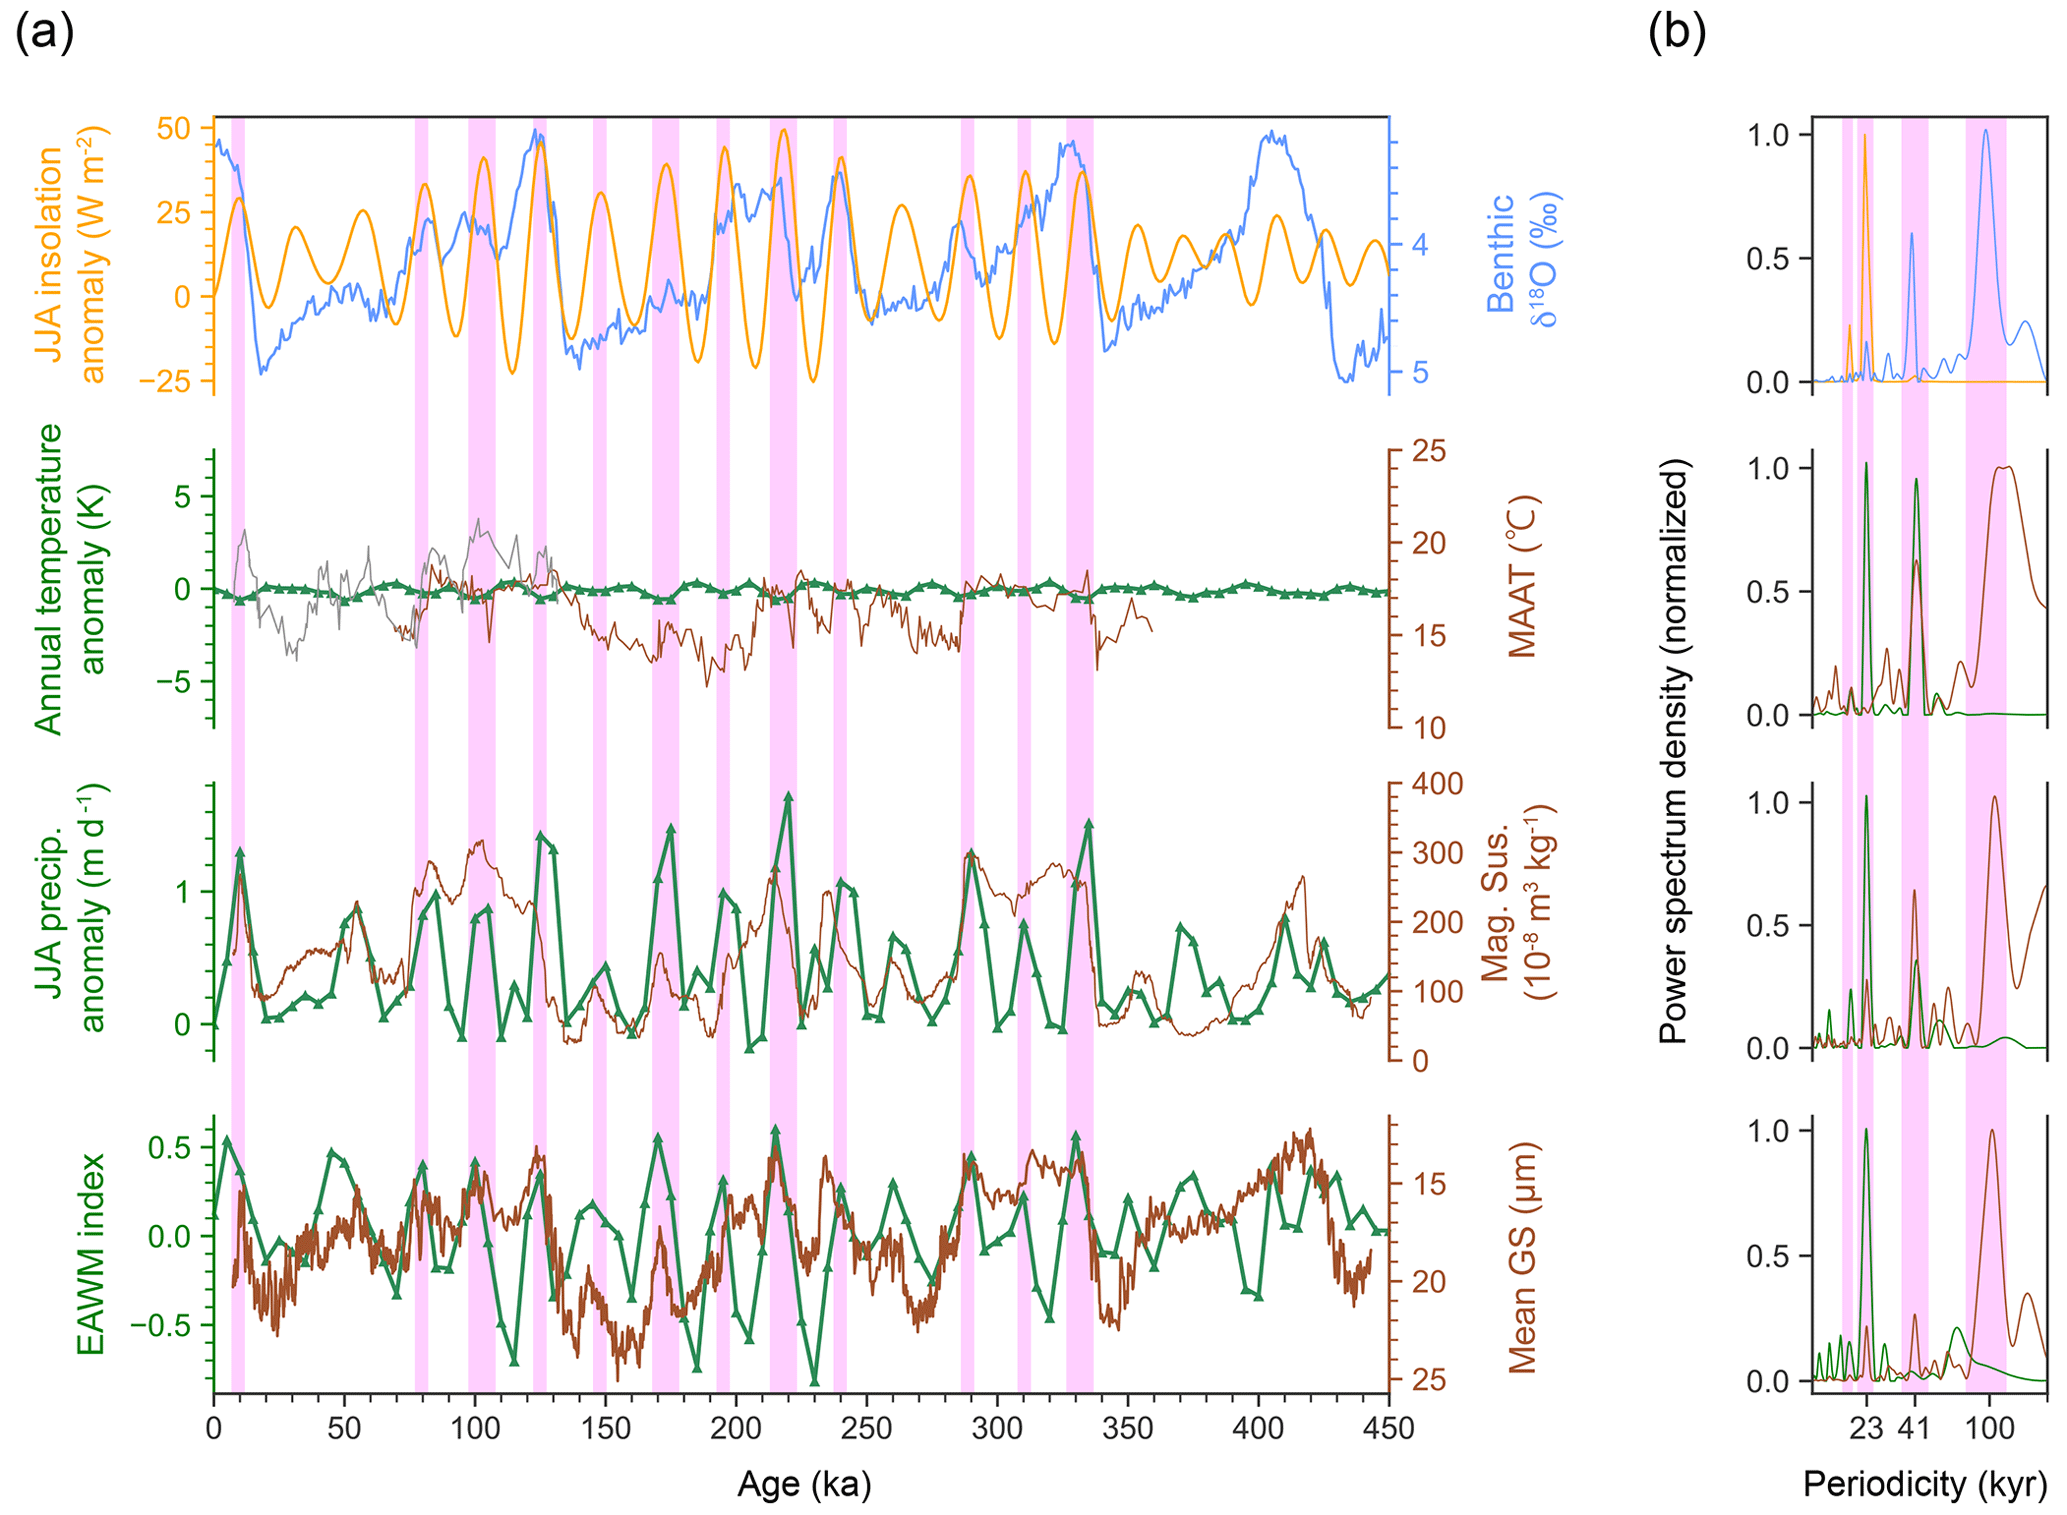
Figure 4Model–proxy comparison for the CLP. (a) Temporal variation in the JJA insolation anomaly (orange; W m−2), as depicted in Fig. 2; the benthic δ18O stack, indicated in light blue (expressed in per mille; Lisiecki and Raymo, 2005); simulated annual temperature (expressed in Kelvin); the JJA precipitation anomaly in the CLP (green; mm d−1); and the East Asian winter monsoon index, based on Wang and Chen (2014). Insolation was averaged over 20–40° N. The brown lines indicate proxy records for the following: mean annual air temperature reconstructed from brGDGTs (expressed in degrees Celsius), magnetic susceptibility (Mag. Sus.; 10−8 m3 kg−1), and mean grain size (GS; expressed in millimetres) (Thomas et al., 2016). The vertical pink bars in panel (a) denote strong periods (SPs). (b) Normalized power spectrum densities with respect to panel (a), expressed in kiloyears. The vertical pink bars in panel (b) denote the 23, 41, and 100 kyr cycles.
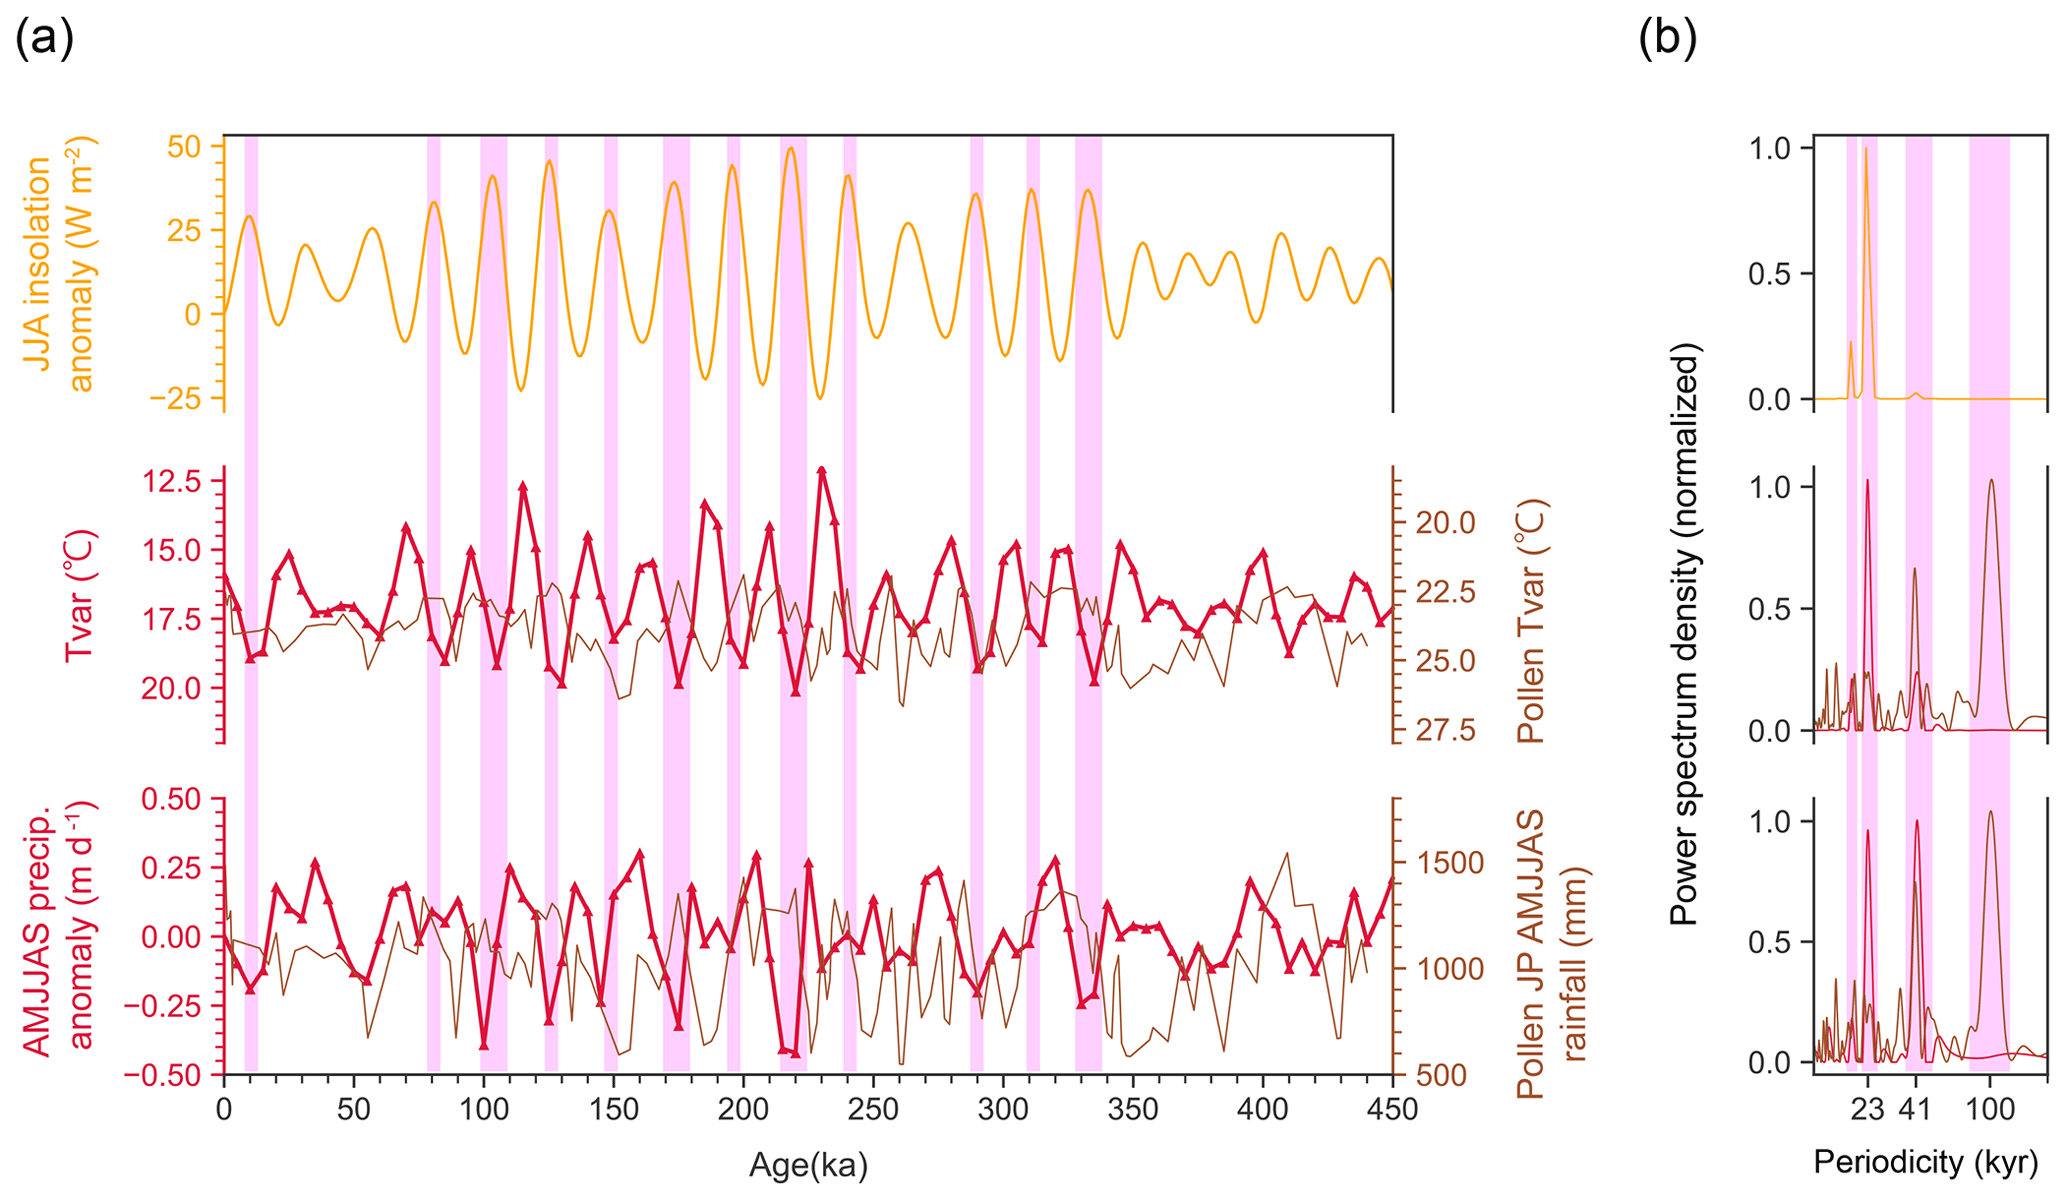
Figure 5Model–proxy comparison for Japan (JP). (a) Temporal variation in the simulated JJA insolation anomaly (orange; W m−2), as depicted in Fig. 2; the annual temperature range Tvar (expressed in Kelvin); and the AMJJAS precipitation anomaly (mm d−1) in the CLP (red). Insolation was averaged over 20–40° N. The brown lines indicate proxy records for Tvar (expressed in degrees Celsius) and AMJJAS rainfall (given in millimetres). The vertical pink bars in panel (a) denote strong periods (SPs). (b) Normalized power spectrum densities with respect to panel (a), expressed in kiloyears. The vertical pink bars in panel (b) denote the 23, 41, and 100 kyr cycles.
The simulated summer rainfall variability in JP appeared to be inconsistent with the rainfall reconstructed from proxy data (Fig. 2a), with the correlation being negative and below a significant level (; p=0.01). The similarity in the dominant cycles (i.e. the dominance of precession and obliquity bands) between the model results and proxy data may support the idea that changes in summer insolation affect monsoon variability in JP (Fig. 2b). However, in the simulation, strong summer insolation caused a decrease in summer precipitation in JP, while the proxy data appeared to indicate the opposite response. Based on the assumption that the changes in land–sea thermal contrast and resultant EASM variability are negatively correlated with the annual temperature range (Tvar) (Nakagawa et al., 2008), we compared the simulated results with variations in Tvar and AMJJAS rainfall reconstructed from pollen records (Fig. 5). The results suggested that Tvar is negatively correlated with summer precipitation; however, the simulation and proxies showed contrasting Tvar responses to insolation. In the simulated results, an increase in summer insolation caused the increase in Tvar, leading to a decrease in summer precipitation. The inconsistency between the model results and proxy data indicates that the summer rainfall in JP, represented by pollen records, cannot be fully interpreted based on the previously proposed insolation and Tvar effects, reflecting the effects of complex climatic forcings and internal feedback. The relationship between insolation and Tvar, as well as summer precipitation variability in JP, should be verified using multiple proxies and models in future studies.
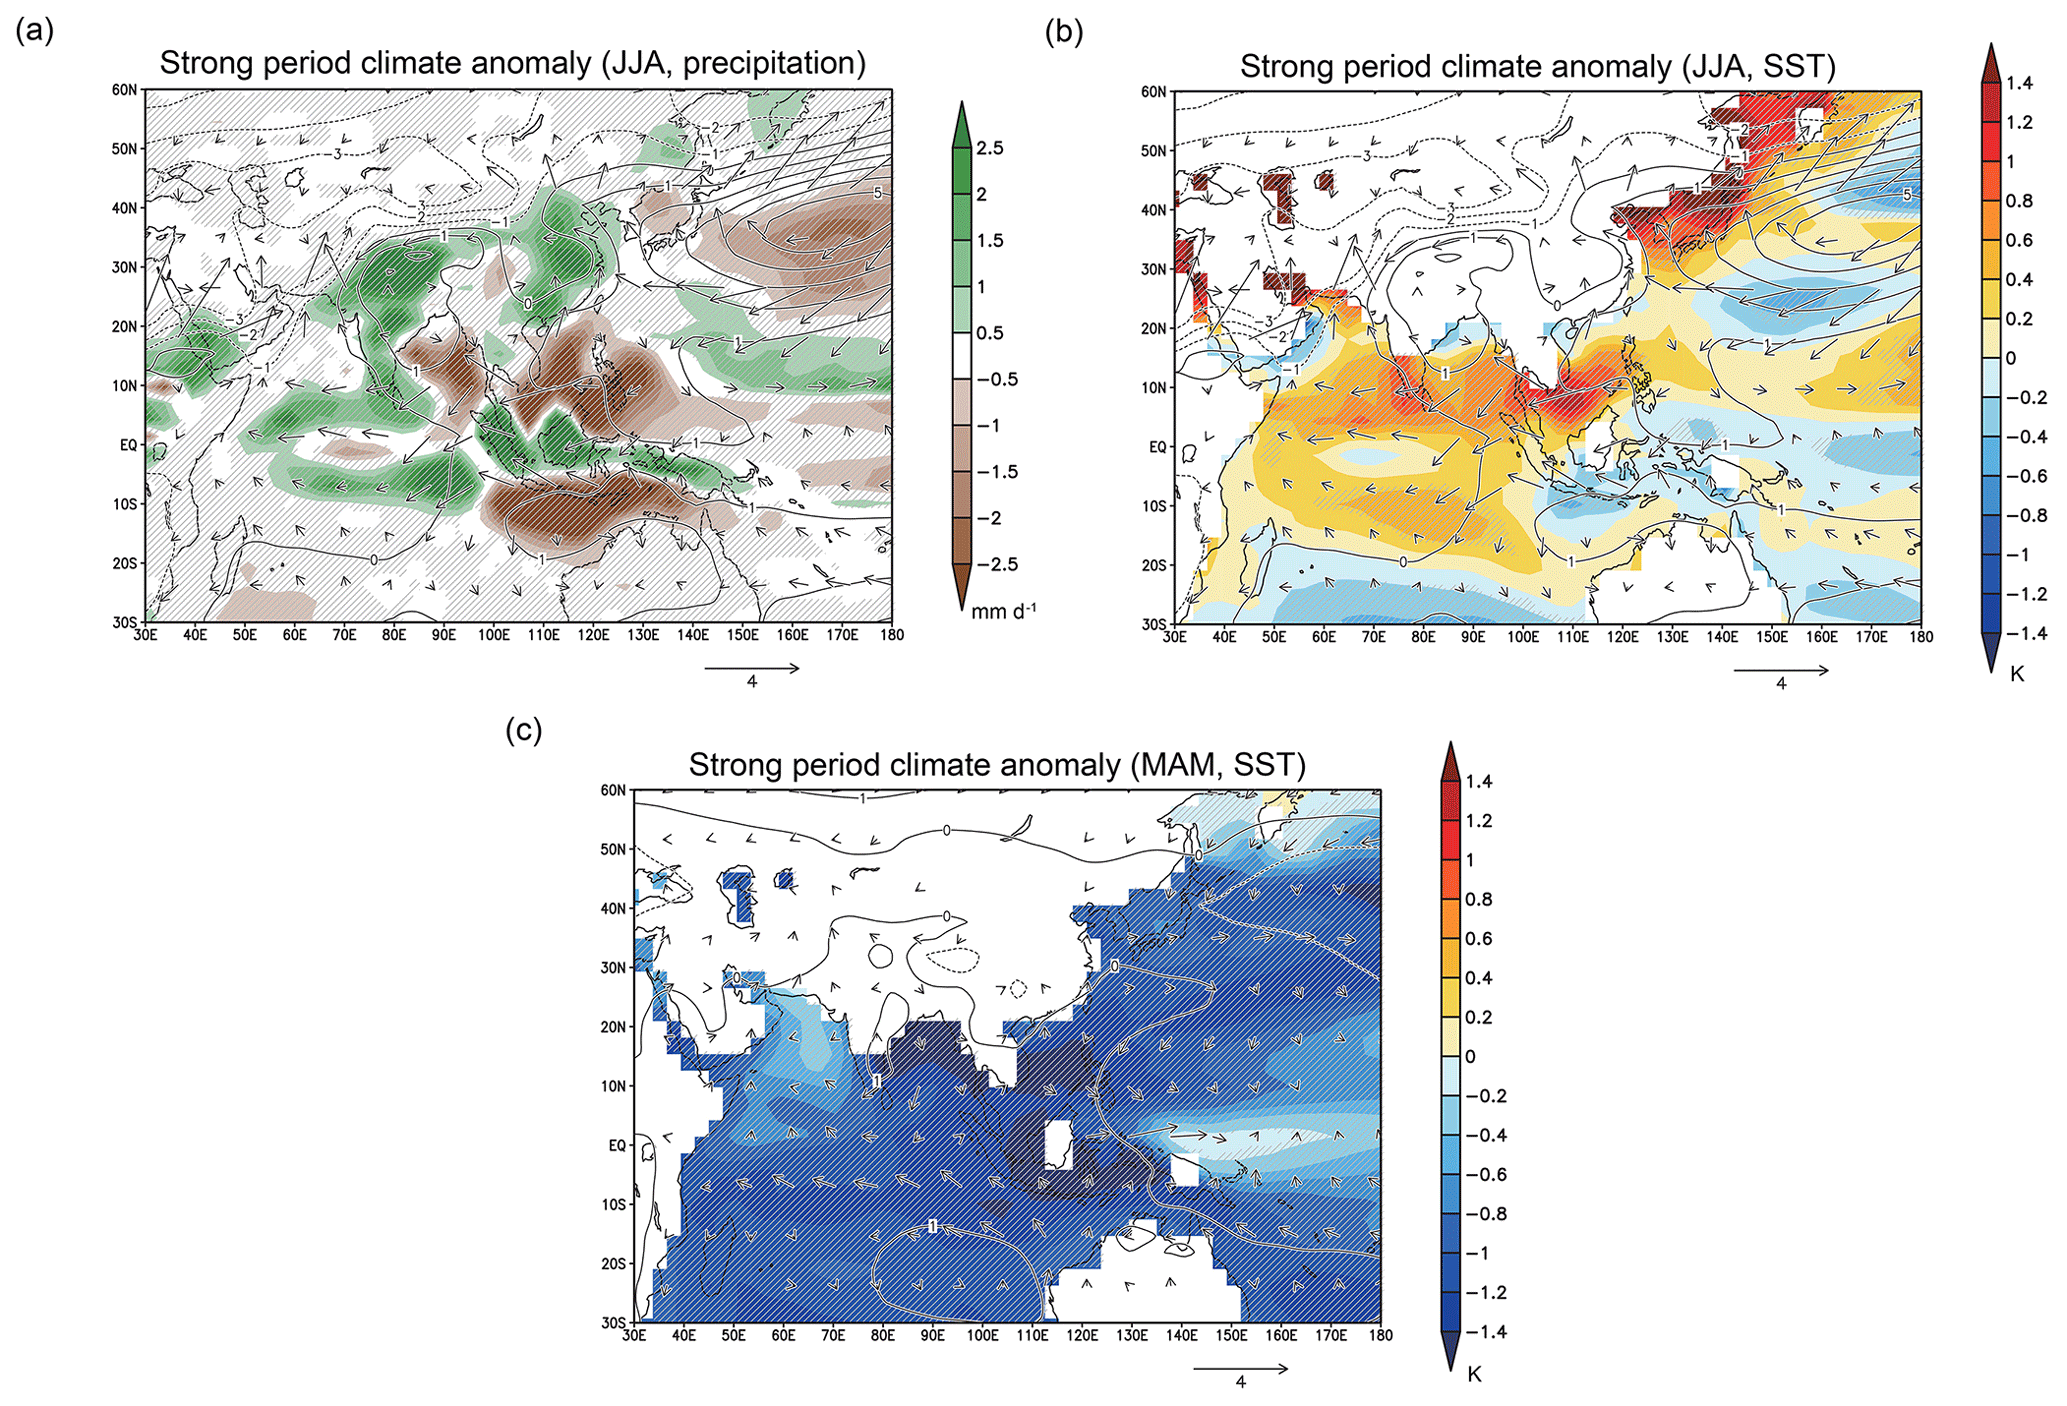
Figure 6(a) Spatial distribution of anomalies in JJA precipitation (shading; mm d−1), sea-level pressure (contours; hectopascals), and surface wind (vectors; m s−1) during strong periods. Solid and dashed lines denote positive and negative anomalies, respectively. Surface wind anomalies below 0.1 m s−1 are masked. The hatched area denotes regions exceeding a 95 % confidence level, based on Student's t test. (b) Spatial distribution of anomalies in JJA sea surface temperature (shading; expressed in Kelvin), sea-level pressure (contours; hectopascals), and surface wind (vectors; m s−1) during strong periods. Solid and dashed lines denote positive and negative anomalies, respectively. Surface wind anomalies below 0.1 m s−1 are masked. The hatched area denotes regions exceeding a 95 % confidence level, based on Student's t test. (c) Spatial distribution of anomalies in spring (March–May; MAM) sea surface temperature (shading; expressed in Kelvin), sea-level pressure (contours; hectopascals), and surface wind (vectors; m s−1) during strong periods. Solid and dashed lines denote positive and negative anomalies, respectively. Surface wind anomalies below 0.1 m s−1 are masked. The hatched area denotes regions exceeding a 95 % confidence level, based on Student's t test. EQ: Equator.
4.1 Mechanisms of variability in southeastern China and the Chinese Loess Plateau in phase with insolation
Figure 6a depicts the composite distribution of summer precipitation anomalies in the SPs, along with anomalies in sea-level pressure (SLP) and winds. For comparison, the simulation results for the PI era (0 ka) are shown in Fig. S1 in the Supplement. Additionally, the global distribution of the anomalies is presented in Fig. S2. An increase in precipitation was observed over China, and the trend was more pronounced in SEC (Fig. 6a). This finding is consistent with the spatial heterogeneity reported in Sun et al. (2015), where insolation forcing had a more significant impact on low-latitude and coastal areas in China. It has been suggested that sub-high variability played an important role in past monsoon variability across East Asia (Dai et al., 2021; Liu et al., 2014; Sun et al., 2015), although the position of the sub-high and its role in EASM rainfall depends on the model. In our results, anomalously high pressure was noticeable over the Philippine Sea, which intensifies southerly winds at its western edge (Figs. 6a and S2a). Therefore, we suggest that under intense solar insolation, active moisture transport resulting from the strengthened southerly wind at the western edge of the sub-high led to increased summer precipitation over China. This effect would have been more significant in SEC than in the CLP. Although our simulation did not include changes in ice volume, incorporating ice sheets would likely cause a further decrease in summer precipitation in the CLP during glacial periods (Sun et al., 2015) as global cooling and a reduced land–sea pressure gradient weaken the EASM circulation (Lyu et al., 2021).
Figure 6b depicts the distribution of sea surface temperature (SST) and surface wind anomalies in SPs. SST increased over almost the entire Indian Ocean, with the exception of the central equatorial region (Figs. 6b and S2b), corresponding to increasing summer precipitation over the Indian Ocean (Fig. 6a). In the modern climate, the sub-high is considered to be formed and maintained through air–sea interaction over the Indo-West Pacific (Xie et al., 2016). The warming of the Indian Ocean excites the Matsuno–Gill response (Gill, 1980; Matsuno, 1966) through tropospheric Kelvin wave propagation, forcing the anomalous anticyclone over the South China Sea and the Philippine Sea, known as the sub-high in summer (Xie et al., 2009). The notable consistency between basin-wide warming of the Indian Ocean and anomalous easterly winds extending from the Indian Ocean to the western North Pacific around the Philippines indicates that the same mechanisms can be applied to increasing EASM rainfall in SPs. Tropospheric Kelvin wave propagation frequently occurs in SPs. Although the enhanced sub-high appears to be inconsistent with the warming of the South China Sea in terms of local air–sea feedback (Fig. 6b), this may be explained by the fact that the effect of the Indian Ocean overwhelms the local SST feedback (Xie et al., 2009).
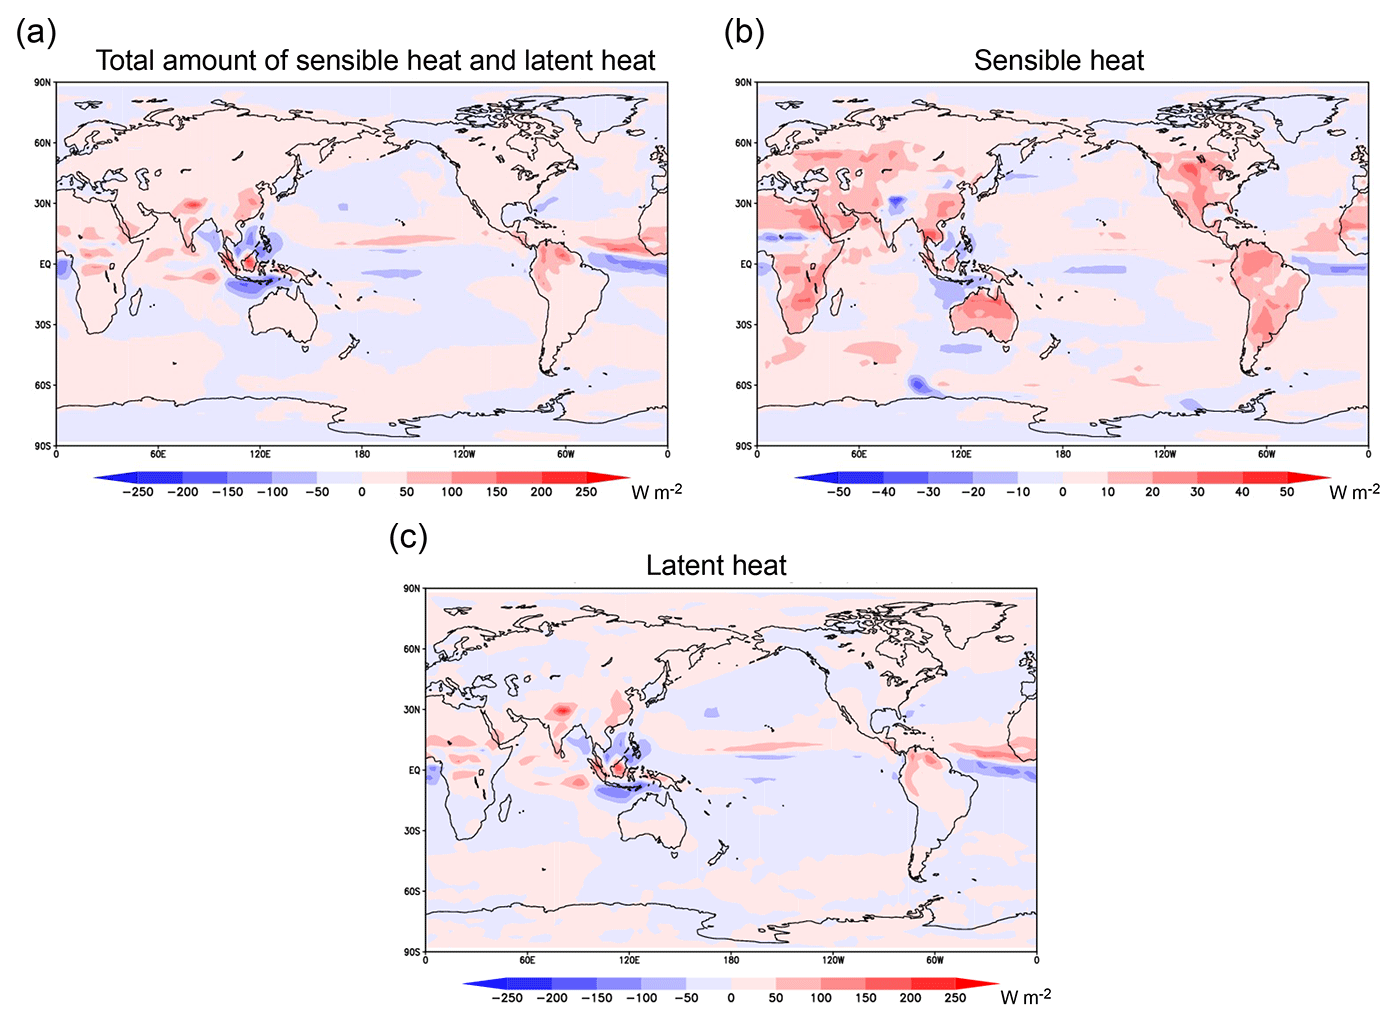
Figure 7Anomaly of JJA vertically integrated diabatic heating. The maps illustrate (a) the total amount of sensible heat and latent heat, (b) sensible heat, and (c) latent heat. All units are given in W m−2.
Xie et al. (2009) assumed that Indian Ocean warming occurs in summers following the waning of El Niño events. However, even in the absence of El Niño–Southern Oscillation (ENSO) variability, the presence of negative SST anomalies in the tropical northwestern Pacific can lead to the formation and maintenance of sub-highs through wind–evaporation–SST (WES) feedback, a mechanism referred to as the Indo-western Pacific Ocean capacitor (IPOC) mode (Xie et al., 2016). The IPOC mode involves not only the Kelvin response to Indian Ocean warming (Xie et al., 2009) but also the Rossby response to convective inactivity in the tropical northwestern Pacific. According to Wang et al. (2000), WES feedback operates as follows: SST cooling over the western North Pacific suppresses in situ convective heating, exciting a westward-propagating Rossby wave that forms an anomalous anticyclone over the Philippine Sea. The intensified northeast trade winds at the eastern edge of the anomalous anticyclone amplify the initial SST cooling via evaporation and wind stirring. Since background trade winds are essential for WES feedback, the contribution of WES feedback is significant from winter to spring, when trade winds prevail in the tropical northwestern Pacific. Thus, the initial disturbances that form the IPOC mode (e.g. a decrease in SST in the tropical northwestern Pacific) are likely to occur in the spring season. To investigate whether WES feedback also occurred in the past, we examined the distribution of SST anomalies in spring (MAM) in the SPs. The SST cooling band extending from southwest to northeast and the in situ anomalous high were identified over the western North Pacific (Figs. 6c and S2c). The anomalous high near the Philippines, located slightly west of the negative-SST region, likely corresponds to the Rossby response to the SST anomaly and intensifies the mean northeast trade winds at the eastern edge of the anomalous high across 10–20° N (Figs. 6c and S2c). Thus, WES feedback may have formed and maintained the sub-high in SPs, increasing monsoon rainfall over SEC and the CLP. The spring climate may reflect the effects of increasing seasonal variations in insolation (e.g. weak winter insolation) rather than the effects of strong summer insolation. This suggests that the EASM can be influenced not only by summer insolation but also by variations in insolation distribution across other seasons. Although the increase observed in SEC and the CLP was attributed to the changes in SST, the causal mechanisms connecting solar-insolation changes and SST anomalies remain unclear in this study, providing an important area for future study.
4.2 Mechanism of anti-phase variability in Japan
The inverse phase between summer insolation and precipitation around JP was found in the model results (Fig. 3). Composite SLP anomalies over the North Pacific region (Fig. 6a) indicate that the salient, anomalous North Pacific High (NPH) – with a maximum around 35° N, 170° E – was pronounced (∼5 hPa) in SPs. The western edge of this high overlaps with JP and reduces summer rainfall (Fig. 6a). In modern climatology, variations in the NPH are often attributed to the thermal contrast in diabatic heating between land and sea (Rodwell and Hoskins, 2001; Miyasaka and Nakamura, 2005). For example, the intensified thermal contrast between the North Pacific Ocean and the North American continent results in stronger northerly winds over the western coast of the North American continent and cools SSTs due to enhanced coastal upwelling. As a result, the NPH may be intensified due to the parasol effect and/or radiative cooling because low-level clouds increase when SST declines (Miyasaka and Nakamura, 2005). In the present study, the anomaly of vertically integrated diabatic heating in SPs was positive over the North American continent and negative over the North Pacific Ocean (Fig. 7a). Notably, significant sensible heating was found over land, contributing to the warming of the North American continent (Fig. 7b). In contrast, a negative anomaly in latent heat was observed over the North Pacific Ocean (Fig. 7c). These features indicate an enhancement of thermal contrast in SPs, consistent with the intensification of the NPH. The tropics, including the Maritime Continent, were characterized by remarkable diabatic-heating anomalies (Fig. 7a), primarily derived from latent heat (Fig. 7c), suggesting reduced convective activity over the South China and Philippine seas. The climate system discussed here may not reflect the actual variability because the model results did not reproduce the temporal variation suggested by proxies. Thus, the impact of additional forcings (ice sheets and greenhouse gases) on precipitation in JP should be analysed in future studies.
The present study aimed to quantitatively assess the effects of insolation changes based on three orbital parameters of EASM variability. The results showed that an increase in Northern Hemisphere insolation strongly intensifies summer precipitation over China. This can be attributed to a climate system similar to the IPOC mode, known in modern climatology. From spring to early summer in SPs, WES feedback via negative SST anomalies in the tropical western North Pacific and the warming of the Indian Ocean in summer sustain the western Pacific subtropical high. The western Pacific subtropical high enhances water vapour transport to the north, subsequently increasing EASM rainfall in SEC and the CLP. In contrast, the model results showed that an increase in insolation suppresses summer precipitation in JP through the intensification of the NPH. The model results align with the proxy records from the SEC region, whereas they are apparently inconsistent with proxy records from the CLP and JP. This suggests that insolation changes must have controlled EASM rainfall in SEC. However, other external forcings, such as changes in ice volume and greenhouse gases, markedly influence EASM variability in the CLP and JP. Numerical experiments considering further external forcings, such as ice sheet volume and greenhouse gas fluctuations, are expected to clarify the actual EASM variability and its complex intrinsic system.
The output from the climate simulations performed in this study (91 global-climate-simulation runs) amounts to several terabytes of data and thus has not been made freely available. Nevertheless, it can be accessed upon request from the corresponding author. The area-averaged precipitation and temperature data used to create the time series and scatter plots are available in the Supplement.
The supplement related to this article is available online at: https://doi.org/10.5194/cp-20-2017-2024-supplement.
TM, MH, HU, and TN designed this study. TM performed the experiments. TM and MH wrote the paper. All the authors discussed the results and commented on the paper.
The contact author has declared that none of the authors has any competing interests.
Publisher's note: Copernicus Publications remains neutral with regard to jurisdictional claims made in the text, published maps, institutional affiliations, or any other geographical representation in this paper. While Copernicus Publications makes every effort to include appropriate place names, the final responsibility lies with the authors.
This research has been supported by the Japan Society for the Promotion of Science (grant no. 21H01197).
This paper was edited by Qiuzhen Yin and reviewed by two anonymous referees.
Abe-Ouchi, A., Saito, F., Kawamura, K., Raymo, M. E., Okuno, J., Takahashi, K., and Blatter, H.: Insolation-driven 100,000-year glacial cycles and hysteresis of ice-sheet volume, Nature, 500, 190–193, https://doi.org/10.1038/nature12374, 2013.
An, Z., Wu, G., Li, J., Sun, Y., Liu, Y., Zhou, W., Cai, Y., Duan, A., Li, L., Mao, J., Cheng, H., Shi, Z., Tan, L., Yan, H., Ao, H., Chang, H., and Feng, J.: Global monsoon dynamics and climate change, Annu. Rev. Earth Planet. Sci., 43, 29–77, https://doi.org/10.1146/annurev-earth-060313-054623, 2015.
Beck, J. W., Zhou, W., Li, C., Wu, Z., White, L., Xian, F., Kong, X., and An, Z.: A 550,000-year record of East Asian monsoon rainfall from 10Be in loess, Science, 360, 877–881, https://doi.org/10.1126/science.aam5825, 2018.
Berger, A. and Loutre, M. F.: Insolation values for the climate of the last 10 million years, Quaternary Sci. Rev., 10, 297–317, https://doi.org/10.1016/0277-3791(91)90033-Q, 1991.
Berger, A. L.: Long-term variations of daily insolation and quaternary climatic changes, J. Atmos. Sci., 35, 2362–2367, https://doi.org/10.1175/1520-0469(1978)035<2362:LTVODI>2.0.CO;2, 1978.
Berger, A. L. and Loutre, M.-F.: Parameters of the Earth's orbit for the last 5 million years in 1 kyr resolution, Pangea [data set], https://doi.org/10.1594/PANGAEA.56040, 1999.
Braconnot, P., Otto-Bliesner, B., Harrison, S., Joussaume, S., Peterchmitt, J.-Y., Abe-Ouchi, A., Crucifix, M., Driesschaert, E., Fichefet, T., Hewitt, C. D., Kageyama, M., Kitoh, A., Laîné, A., Loutre, M.-F., Marti, O., Merkel, U., Ramstein, G., Valdes, P., Weber, S. L., Yu, Y., and Zhao, Y.: Results of PMIP2 coupled simulations of the Mid-Holocene and Last Glacial Maximum – Part 1: Experiments and large-scale features, Clim. Past, 3, 261–277, https://doi.org/10.5194/cp-3-261-2007, 2007a.
Braconnot, P., Otto-Bliesner, B., Harrison, S., Joussaume, S., Peterchmitt, J.-Y., Abe-Ouchi, A., Crucifix, M., Driesschaert, E., Fichefet, T., Hewitt, C. D., Kageyama, M., Kitoh, A., Loutre, M.-F., Marti, O., Merkel, U., Ramstein, G., Valdes, P., Weber, L., Yu, Y., and Zhao, Y.: Results of PMIP2 coupled simulations of the Mid-Holocene and Last Glacial Maximum – Part 2: Feedbacks with emphasis on the location of the ITCZ and mid- and high latitudes heat budget, Clim. Past, 3, 279–296, https://doi.org/10.5194/cp-3-279-2007, 2007b.
Chen, G.-S., Liu, Z., Clemens, S. C., Prell, W. L., and Liu, X.: Modeling the time-dependent response of the Asian summer monsoon to obliquity forcing in a coupled GCM: A PHASEMAP sensitivity experiment, Clim. Dynam., 36, 695–710, https://doi.org/10.1007/s00382-010-0740-3, 2011.
Cheng, H., Edwards, R. L., Sinha, A., Spötl, C., Yi, L., Chen, S., Kelly, M., Kathayat, G., Wang, X., Li, X., Kong, X., Wang, Y., Ning, Y., and Zhang, H.: The Asian monsoon over the past 640,000 years and ice age terminations, Nature, 534, 640–646, https://doi.org/10.1038/nature18591, 2016.
Clemens, S. C., Prell, W. L., and Sun, Y.: Orbital-scale timing and mechanisms driving Late Pleistocene Indo-Asian summer monsoons: Reinterpreting cave speleothem δ18O, Paleoceanogr. Paleoclimatol., 25, PA4207, https://doi.org/10.1029/2010PA001926, 2010.
Clemens, S. C., Holbourn, A., Kubota, Y., Lee, K. E., Liu, Z., Chen, G., Nelson, A., and Fox-Kemper, B.: Precession-band variance missing from East Asian monsoon runoff, Nat. Commun., 9, 3364, https://doi.org/10.1038/s41467-018-05814-0, 2018.
Cubasch, U., Waszkewitz, J., Hegerl, G., and Perlwitz, J.: Regional climate changes as simulated in time-slice experiments, Climatic Change, 31, 273–304, https://doi.org/10.1007/BF01095150, 1995.
Dai, G., Zhang, Z., Otterå, O. H., Langebroek, P. M., Yan, Q., and Zhang, R.: A Modeling Study of the Tripole Pattern of East China Precipitation over the Past 425 ka, Geophys. Res.-Atmos., 126, e2020, https://doi.org/10.1029/2020JD033513, 2021.
Gill, A. E.: Some simple solutions for heat-induced tropical circulation, Q. J. Roy. Meteorol. Soc., 106, 447–462, https://doi.org/10.1002/qj.49710644905, 1980.
Kamae, Y., Yoshida, K., and Ueda, H.: Sensitivity of Pliocene climate simulations in MRI-CGCM2.3 to respective boundary conditions, Clim. Past, 12, 1619–1634, https://doi.org/10.5194/cp-12-1619-2016, 2016.
Kamae, Y., Kawana, T., Oshiro, M., and Ueda, H.: Seasonal modulation of the Asian summer monsoon between the Medieval Warm Period and Little Ice Age: A multi model study, Prog. Earth Planet. Sci., 4, 22, https://doi.org/10.1186/s40645-017-0136-7, 2017.
Kitoh, A.: Climate-change simulations: Future climate projections and paleoclimate modeling, Low Temp. Sci., 65, 77–85, 2007.
Kitoh, A., Motoi, T., and Murakami, S.: El Niño-southern oscillation simulation at 6000 years before present with the MRI-CGCM2.3: Effect of flux adjustment, J. Climate, 20, 2484–2499, https://doi.org/10.1175/JCLI4141.1, 2007.
Kutzbach, J. E.: Monsoon climate of the Early Holocene: Climate experiment with the earth's orbital parameters for 9000 years ago, Science, 214, 59–61, https://doi.org/10.1126/science.214.4516.59, 1981.
Kutzbach, J. E., Liu, X., Liu, Z., and Chen, G.: Simulation of the evolutionary response of global summer monsoons to orbital forcing over the past 280,000 years, Clim. Dynam., 30, 567–579, https://doi.org/10.1007/s00382-007-0308-z, 2008.
Li, X., Liu, X., Qiu, L., An, Z., and Yin, Z.-Y.: Transient simulation of orbital-scale precipitation variation in monsoonal East Asia and arid central Asia during the last 150 ka, J. Geophys. Res., 118, 7481–7488, https://doi.org/10.1002/jgrd.50611, 2013.
Lisiecki, L. E. and Raymo, M. E.: A Pliocene-Pleistocene stack of 57 globally distributed benthic δ18O records, Paleoceanogr. Paleoclimatol., 20, PA1003, https://doi.org/10.1029/2004PA001071, 2005.
Liu, G., Li, X., Chiang, H. W., Cheng, H., Yuan, S., Chawchai, S., He, S., Lu, Y., Aung, L. T., Maung, P. M., Tun, W. N., Oo, K. M., and Wang, X.: On the glacial-interglacial variability of the Asian monsoon in speleothem δ18O records, Sci. Adv., 6, eaay8189, https://doi.org/10.1126/sciadv.aay8189, 2020.
Liu, X., Liu, J., Chen, S., Chen, J., Zhang, X., Yan, J., and Chen, F.: New insights on Chinese cave δ18O records and their paleoclimatic significance, Earth Sci. Rev., 207, 103216, https://doi.org/10.1016/j.earscirev.2020.103216, 2020.
Liu, Z., Wen, X., Brady, E. C., Otto-Bliesner, B., Yu, G., Lu, H., Cheng, H., Wang, Y., Zheng, W., Ding, Y., Edwards, R. L., Cheng, J., Liu, W., and Yang, H.: Chinese cave records and the east Asia summer monsoon, Quaternary Sci. Rev., 83, 115–128, https://doi.org/10.1016/j.quascirev.2013.10.021, 2014.
Lyu, A. Q., Yin, Q. Z., Crucifix, M., and Sun, Y. B.: Diverse regional sensitivity of summer precipitation in East Asia to ice volume, CO2 and astronomical forcing, Geophys. Res. Lett., 48, GL092005, e2020, https://doi.org/10.1029/2020GL092005, 2021.
Matsuno, T.: Quasi-geostrophic motions in the equatorial area, J. Meteorol. Soc. Jpn., 44, 25–43, https://doi.org/10.2151/jmsj1965.44.1_25, 1966.
Miyasaka, T. and Nakamura, H.: Structure and formation mechanisms of the northern hemisphere summertime subtropical highs, J. Climate, 18, 5046–5065, https://doi.org/10.1175/JCLI3599.1, 2005.
Nakagawa, T., Okuda, M., Yonenobu, H., Miyoshi, N., Fujiki, T., Gotanda, K., Tarasov, P. E., Morita, Y., Takemura, K., and Horie, S.: Regulation of the monsoon climate by two different orbital rhythms and forcing mechanisms, Geology, 36, 491–494, https://doi.org/10.1130/G24586A.1, 2008.
Nie, J., Garzione, C., Su, Q., Liu, Q., Zhang, R., Heslop, D., Necula, C., Zhang, S., Song, Y., and Luo, Z.: Dominant 100,000-year precipitation cyclicity in a Late Miocene lake from northeast Tibet, Sci. Adv., 3, e1600762, https://doi.org/10.1126/sciadv.1600762, 2017.
Rodwell, M. J. and Hoskins, B. J.: Subtropical anticyclones and summer monsoons, J. Climate, 14, 3192–3211, https://doi.org/10.1175/1520-0442(2001)014<3192:SAASM>2.0.CO;2, 2001.
Sato, N., Sellers, P. J., Randall, D. A., Schneider, E. K., Shukla, J., Kinter, J. L., Hou, Y.-Y., and Albertazzi, E.: Effects of implementing the simple biosphere model in a general circulation model, J. Atmos. Sci., 46, 2757–2782, 1989.
Schneider, S. H., Root, T. L., and Mastrandrea, M. D.: Encyclopedia of climate and weather, Oxford University Press, https://doi.org/10.1093/acref/9780199765324.001.0001, 2011.
Sellers, P. J., Mintz, Y., Sud, Y. C., and Dalcher, A.: A simple biosphere model (SiB) for use within general circulation models, J. Atmos. Sci., 43, 505–531, 1986.
Shi, Z. G., Liu, X. D., Sun, Y. B., An, Z. S., Liu, Z., and Kutzbach, J.: Distinct responses of East Asian summer and winter monsoons to astronomical forcing, Clim. Past, 7, 1363–1370, https://doi.org/10.5194/cp-7-1363-2011, 2011.
Shibata, K., Yoshimura, H., Ohizumi, M., Hosaka, M., and Sugi, M.: A simulation of troposphere, stratosphere and mesosphere with an MRI/JMA98 GCM, Pap. Meteorol. Geophys., 50, 15–53, https://doi.org/10.2467/mripapers.50.15, 1999.
Suarez, M. J. and Held, I. M.: Modelling climatic response to orbital parameter variations, Nature, 263, 46–47, https://doi.org/10.1038/263046a0, 1976.
Sun, Y., Chen, J., Clemens, S. C., Liu, Q., Ji, J., and Tada, R.: East Asian monsoon variability over the last seven glacial cycles recorded by a loess sequence from the northwestern Chinese Loess Plateau, Geochem. Geophy. Geosy., 7, Q12Q02, https://doi.org/10.1029/2006GC001287, 2006.
Sun, Y., Kutzbach, J., An, Z., Clemens, S., Liu, Z., Liu, W., Liu, X., Shi, Z., Zheng, W., Liang, L., Yan, Y., and Li, Y.: Astronomical and glacial forcing of East Asian summer monsoon variability, Quaternary Sci. Rev., 115, 132–142, https://doi.org/10.1016/j.quascirev.2015.03.009, 2015.
Sun, Y., Ramstein, G., Li, L. Z. X., Contoux, C., Tan, N., and Zhou, T. J.: Quantifying East Asian summer monsoon dynamics in the ECP4.5 scenario with reference to the mid-Piacenzian warm period, Geophys. Res. Lett., 45, 12523–12533, 2018.
Sun, Y., Yin, Q., Crucifix, M., Clemens, S. C., Araya-Melo, P., Liu, W., Qiang, X., Liu, Q., Zhao, H., Liang, L., Chen, H., Li, Y., Zhang, L., Dong, G., Li, M., Zhou, W., Berger, A., and An, Z.: Diverse manifestations of the mid-Pleistocene climate transition, Nat. Commun., 10, 352, https://doi.org/10.1038/s41467-018-08257-9, 2019.
Sun, Y., Wu, H., Kageyama, M., Ramstein, G., Li, L. Z. X., Tan, N., Lin, Y. T., Liu, B., Zheng, W. P., Zhang, W. C., Zou, L. W., and Zhou, T. J.: The contrasting effects of thermodynamic and dynamic processes on East Asian summer monsoon precipitation during the Last Glacial Maximum: a data-model comparison, Clim. Dynam., 56, 1303–1316, 2021.
Sun, Y., Wu, H., Ramstein, G., Liu, B., Zhao, Y., Li, L. Z. X., Yuan, X. Y., Zhang, W. C., Li, L. J., Zou, L. W., and , T. J.: Revisiting the Physical Mechanisms of East Asian Summer Monsoon Precipitation Changes During the Mid-Holocene: A Data–model Comparison, Clim. Dynam., 60, 1009–1022, https://doi.org/10.1007/s00382-022-06359-1, 2023.
Thomas, E. K., Clemens, S. C., Sun, Y., Prell, W. L., Huang, Y., Gao, L., Loomis, S., Chen, G., and Liu, Z.: Heterodynes dominate precipitation isotopes in the East Asian monsoon region, reflecting interaction of multiple climate factors, Earth Planet. Sc. Lett., 455, 196–206, https://doi.org/10.1016/j.epsl.2016.09.044, 2016.
Timmermann, A., Lorenz, S. J., An, S.-I., Clement, A., and Xie, S.-P.: The effect of orbital forcing on the mean climate and variability of the tropical Pacific, J. Climate, 20, 4147–4159, https://doi.org/10.1175/JCLI4240.1, 2007.
Ueda, H., Iwai, A., Kuwako, K., and Hori, M. E.: Impact of anthropogenic forcing on the Asian summer monsoon as simulated by eight GCMs, Geophys. Res. Lett., 33, L06703, https://doi.org/10.1029/2005GL025336, 2006.
Ueda, H., Kuroki, H., Ohba, M., and Kamae, Y.: Seasonally asymmetric transition of the Asian monsoon in response to ice age boundary conditions, Clim. Dynam., 37, 2167–2179, https://doi.org/10.1007/s00382-010-0975-z, 2011.
Wang, B., Wu, R., and Fu, X.: Pacific-East Asian teleconnection: How Does ENSO Affect East Asian climate?, J. Climate, 13, 1517–1536, https://doi.org/10.1175/1520-0442(2000)013<1517:PEATHD>2.0.CO;2, 2000.
Wang, L. and Chen, W.: An Intensity Index for the East Asian Winter Monsoon, J. Climate, 27, 2361–2374, https://doi.org/10.1175/JCLI-D-13-00086.1, 2014.
Wang, P. X., Wang, B., Cheng, H., Fasullo, J., Guo, Z., Kiefer, T., and Liu, Z.: The global monsoon across time scales: Mechanisms and outstanding issues, Earth Sci. Rev., 174, 84–121, https://doi.org/10.1016/j.earscirev.2017.07.006, 2017.
Wang, Y., Cheng, H., Edwards, R. L., Kong, X., Shao, X., Chen, S., Wu, J., Jiang, X., Wang, X., and An, Z.: Millennial- and orbital-scale changes in the East Asian monsoon over the past 224,000 years, Nature, 451, 1090–1093, https://doi.org/10.1038/nature06692, 2008.
Weber, S. L. and Tuenter, E.: The impact of varying ice sheets and greenhouse gases on the intensity and timing of boreal summer monsoons, Quaternary Sci. Rev., 30, 469–479, https://doi.org/10.1016/j.quascirev.2010.12.009, 2011.
Wen, X., Liu, Z., Wang, S., Cheng, J., and Zhu, J.: Correlation and anti-correlation of the East Asian summer and winter monsoons during the last 21,000 years, Nat. Commun., 7, 11999, https://doi.org/10.1038/ncomms11999, 2016.
Xie, S.-P., Kosaka, Y., Du, Y., Hu, K., Chowdary, J. S., and Huang, G.: Indo-western Pacific Ocean capacitor and coherent climate anomalies in post-ENSO summer: A review, Adv. Atmos. Sci., 33, 411–432, https://doi.org/10.1007/s00376-015-5192-6, 2016.
Xie, S.-P., Hu, K., Hafner, J., Tokinaga, H., Du, Y., Huang, G., and Sampe, T.: Indian Ocean capacitor effect on Indo-Western pacific climate during the summer following El Niño, J. Climate, 22, 730–747, https://doi.org/10.1175/2008JCLI2544.1, 2009.
Yihui, D. and Chan, J. C. L.: the East Asian summer monsoon: An overview, Meteorol. Atmos. Phys., 89, 117–142, https://doi.org/10.1007/s00703-005-0125-z, 2005.
Qiuzhen Yin, Berger, A., Driesschaert, E., Goosse, H., Loutre, M. F., and Crucifix, M.: The Eurasian ice sheet reinforces the East Asian summer monsoon during the interglacial 500 000 years ago, Clim. Past, 4, 79–90, https://doi.org/10.5194/cp-4-79-2008, 2008.
Yin, Q. Z. and Berger, A.: Individual contribution of insolation and CO2 to the interglacial climates of the past 800,000 years, Clim. Dynam., 38, 709–724, https://doi.org/10.1007/S00382-011-1013-5, 2012.
Yin, Q. Z., Berger, A., and Crucifix, M.: Individual and combined effects of ice sheets and precession on MIS-13 climate, Clim. Past, 5, 229–243, https://doi.org/10.5194/cp-5-229-2009, 2009.
Yin, Q. Z., Singh, U. K., Berger, A., Guo, Z. T., and Crucifix, M.: Relative impact of insolation and the Indo-Pacific warm pool surface temperature on the East Asia summer monsoon during the MIS-13 interglacial, Clim. Past, 10, 1645–1657, https://doi.org/10.5194/cp-10-1645-2014, 2014.
Yukimoto, S., Noda, A., Kitoh, A., Hosaka, M., Yoshimura, H., Uchiyama, T., Shibata, K., Arakawa, O., and Kusunoki, S.: Present-Day Climate and Climate Sensitivity in the Meteorological Research Institute Coupled GCM version 2.3 (MRI-CGCM2.3), J. Meteorol. Soc. Jpn., 84, 333–363, https://doi.org/10.2151/jmsj.84.333, 2006.
Zhang, H., Brahim, Y. A., Li, H., Zhao, J., Kathayat, G., Tian, Y., Baker, J., Wang, J., Zhang, F., Ning, Y., Edwards, R. L., and Cheng, H.: The Asian summer monsoon: Teleconnections and forcing mechanisms – A review from Chinese speleothem δ18O records, Quaternary, 2, 26, https://doi.org/10.3390/quat2030026, 2019.
Zhao, D., Wan, S., Lu, Z., Zhai, L., Feng, X., Shi, X., and Li, A.: Response of heterogeneous rainfall variability in East Asia to Hadley circulation reorganisation during the late quaternary, Quaternary Sci. Rev., 247, 106562, https://doi.org/10.1016/j.quascirev.2020.106562, 2020.
- Abstract
- Introduction
- Model and experimental design
- Simulated temporal climate variability over the last 450 kyr
- Possible climate dynamics responsible for EASM variability
- Conclusions
- Data availability
- Author contributions
- Competing interests
- Disclaimer
- Financial support
- Review statement
- References
- Supplement