the Creative Commons Attribution 4.0 License.
the Creative Commons Attribution 4.0 License.
 | 25 Jul 2024
Dynamic interaction between lakes, climate, and vegetation across northern Africa during the mid-Holocene
Nora Farina Specht
Martin Claussen
Thomas Kleinen
During the early Holocene to mid-Holocene, about 11 500 to 5500 years ago, lakes expanded across the Sahel and Sahara in response to enhanced summer monsoon precipitation. To investigate the effect of these lakes on the West African summer monsoon, previous simulation studies prescribed mid-Holocene lakes from reconstructions. By prescribing mid-Holocene lakes, however, the terrestrial water balance is inconsistent with the size of the lakes. In order to close the terrestrial water cycle, we construct a dynamic endorheic lake (DEL) model and implement it into the atmosphere–land model ICON-JSBACH4. For the first time, this allows us to investigate the dynamic interaction between climate, lakes, and vegetation across northern Africa. Additionally, we investigate the effect of lake depth changes on mid-Holocene precipitation, a neglected aspect in previous simulation studies.
A pre-industrial control simulation shows that the DEL model realistically simulates the lake extent across northern Africa. Only in the Ahnet and Chotts basins is the lake area slightly overestimated, which is likely related to the coarse resolution of the simulations. The mid-Holocene simulations reveal that both the lake expansion and the vegetation expansion cause a precipitation increase over northern Africa. The sum of these individual contributions to the precipitation is, however, larger than the combined effect that is generated when lake and vegetation dynamics interact. Thus, the lake–vegetation interaction causes a relative drying response across the entire Sahel. The main reason for this drying response is that the simulated vegetation expansion cools the land surface more strongly than the lake expansion, which is dominated by the expansion of Lake Chad. Accordingly, the surface temperature increases over the region of Lake Chad and causes local changes in the meridional surface-temperature gradient. These changes in the meridional surface-temperature gradient are associated with reduced inland moisture transport from the tropical Atlantic into the Sahel, which causes a drying response in the Sahel. An idealized mid-Holocene experiment shows that a similar drying response is induced when the depth of Lake Chad is decreased by about 1–5 m, without changing the horizontal lake area. By reducing the depth of Lake Chad, the heat storage capacity of the lake decreases, and the lake warms faster during the summer months. Thus, in the ICON-JSBACH4 model, the lake depth significantly influences the simulated surface temperature and the simulated meridional surface-temperature gradient between the simulated lakes and vegetation, thereby affecting mid-Holocene precipitation over northern Africa.
- Article
(6013 KB) - Full-text XML
- BibTeX
- EndNote


Climate and environment reconstructions from mid-Holocene sediments show that about 11 500 to 5500 years ago, increased monsoon precipitation over northern Africa caused an expansion of vegetation and lakes across the present-day Sahara (Lézine, 2017; Holmes and Hoelzmann, 2017; Hély and Lézine, 2014; Hoelzmann et al., 1998). This “green Sahara” was characterized by a spatially heterogeneous vegetation distribution, ranging from humid-forest taxa to wooded-grassland taxa (e.g. Lézine, 2017; Hély and Lézine, 2014). Additionally, so-called megalakes that covered an area of more than 25 000 km2, such as Megalake Chad (Quade et al., 2018; Hoelzmann et al., 1998; Drake et al., 2022) and Megalake Timbuktu in the Niger Inner Delta (Drake et al., 2022), likely existed in the Sahel. In the Sahara, several smaller yet still substantially large lakes primarily formed in regions where the topographic elevation was close to the groundwater level (Holmes and Hoelzmann, 2017; Lézine et al., 2011a; Drake et al., 2022), such as in the Darfur catchment (∼ 210 km2 lake area; Pachur and Hoelzmann, 1991), Fezzan catchment (∼ 5330 km2 lake area; Drake et al., 2018), Chotts catchment ( > 620 km2 lake area; Swezey et al., 1999; Coque, 1962; Drake et al., 2022), and Ahnet catchment (Drake et al., 2022). However, the mid-Holocene lake and vegetation reconstructions that are derived from sediment records are spatially sparse and often temporally discontinuous (Lézine et al., 2011b).
Therefore, the mid-Holocene reconstructions provide only a fragmentary picture of the landscape across Northern Africa. Particularly, the existence of mid-Holocene megalakes across northern Africa (Quade et al., 2018; Drake et al., 2022) and the extent of lakes and wetlands across the western Sahara differ strongly between individual reconstruction studies (Coe, 1997; Hoelzmann et al., 1998; Stacke, 2011; Chen et al., 2021; Enzel et al., 2017). Accordingly, the prescribed lake and wetland reconstructions used to investigate the influence of mid-Holocene lakes and wetlands on the climate across Northern Africa differ between individual simulation studies (Li et al., 2023; Specht et al., 2022; Chandan and Peltier, 2020; Krinner et al., 2012; Broström et al., 1998; Coe and Bonan, 1997).
Mid-Holocene simulation studies have shown that reconstructed mid-Holocene lakes generally cause a precipitation increase over northern Africa. But results differ depending on whether this precipitation increase is only localized (Coe and Bonan, 1997; Broström et al., 1998; Chandan and Peltier, 2020) or whether the lakes cause an area-wide precipitation increase across the Sahel and Sahara (Krinner et al., 2012; Specht et al., 2022; Li et al., 2023). These differences regarding the precipitation increase might be related to whether vegetation feedback to the lake extent is considered (Krinner et al., 2012; Specht et al., 2022) or whether static vegetation is prescribed (Coe and Bonan, 1997; Broström et al., 1998; Chandan and Peltier, 2020). For example, a simulation study by Krinner et al. (2012) shows that a reconstructed “small” lake extent across northern Africa induces a northward extension of the African rain belt by about 1.5° during the mid-Holocene when a dynamic vegetation model is used (Krinner et al., 2012). In contrast, the same lake extent causes only a marginal precipitation increase over the Sahel and Sahara in simulation studies where static mid-Holocene vegetation is prescribed (Broström et al., 1998). Aside from differences in vegetation treatment, previous simulation studies have all prescribed reconstructions of mid-Holocene lake extents across the Sahel and Sahara to investigate their effects on the mid-Holocene climate (Li et al., 2023; Specht et al., 2022; Chandan and Peltier, 2020; Krinner et al., 2012; Broström et al., 1998; Coe and Bonan, 1997).
As lakes are prescribed from reconstructions, however, the simulated terrestrial water cycle is not closed. For example, lake reconstructions prescribed in previous simulation studies might, on average, evaporate more water to the atmosphere than is supplied to the lakes through discharge from precipitation within the corresponding catchments. Therefore, it remains unclear whether the extent of reconstructed lakes prescribed in previous simulation studies would be sustained under the simulated mid-Holocene climate, particularly considering that these lake reconstructions are subject to large uncertainties (Li et al., 2023; Specht et al., 2022; Chandan and Peltier, 2020; Krinner et al., 2012; Broström et al., 1998; Coe and Bonan, 1997).
In this study, we close the terrestrial water cycle across northern Africa by constructing a dynamic lake model and implementing it into the land component (JSBACH4) of the ICON Earth System Model (ICON-ESM). This allows us to simulate the growth and shrinkage of Sahelian and Saharan lakes with regard to their interaction with the climate and vegetation across northern Africa under both present-day and mid-Holocene climate conditions. Additionally, for the first time, it enables us to investigate how the dynamic interaction between the atmosphere, lakes, and vegetation affects the mid-Holocene climate across northern Africa.
In Sect. 2, we describe the concept of the dynamic lake model and the structure of the present-day and mid-Holocene simulations. In Sect. 3, we evaluate the simulated present-day lake extent by comparing it with observational data (Messager et al., 2016). We compare the simulated mid-Holocene precipitation increase and the lake and vegetation extents with mid-Holocene reconstruction data. Additionally, we analyse the individual and synergistic effects of the mid-Holocene lake and vegetation extents on the climate across northern Africa and examine how changes in lake depth influence the mid-Holocene climate across northern Africa. Finally, we discuss our results in relation to previous studies in the Conclusions section (Sect. 4).
To investigate the dynamic interaction between climate, lakes, and vegetation during the mid-Holocene, we conduct a pre-industrial control simulation and a set of mid-Holocene experiments. For the simulations, we use the atmosphere model ICON-A (Giorgetta et al., 2018) and the land model JSBACH4 (Schneck et al., 2022; Reick et al., 2021) at a horizontal resolution of ∼ 160 km with 47 vertical atmospheric hybrid-sigma levels. The atmosphere–land model is forced with climatological orbital parameters corresponding to 0 kyr BP (1850) and 6 kyr BP (Berger, 1978) and greenhouse gas (GHG) concentrations (Fortunat Joos, personal communication, 2016; see Bader et al., 2020; Brovkin et al., 2019) for the pre-industrial (pi) and mid-Holocene (mH) simulations, respectively. The pre-industrial (Wieners et al., 2019a) and mid-Holocene (Jungclaus et al., 2019) sea-surface temperatures (SST) and sea-ice concentrations (SICs) are prescribed from Coupled Model Intercomparison Project 6 (CMIP6) simulations conducted with the Max Planck Institute Earth System Model (MPI-ESM).
Like most Earth system models (Richter and Tokinaga, 2020), the MPI-ESM simulates an unrealistically warm SST (> 5 K) in the eastern tropical Atlantic (Jungclaus et al., 2013). This promotes excessive precipitation over the Guinea coast (Zhao et al., 2007) and causes the West African monsoon to be positioned too far south during the Northern Hemisphere summer. To simulate a more realistic latitudinal position of the West African summer monsoon, we subtract a monthly climatology of tropical SST biases from the pre-industrial and mid-Holocene MPI-ESM CMIP6 SSTs. The tropical SST biases are derived from the differences between a historical MPI-ESM CMIP6 simulation (Wieners et al., 2019b) and observation-based SST data from the second phase of the Atmospheric Model Intercomparison Project (AMIP II) (Durack et al., 2022). Finally, the tropical SST biases are smoothed at the 30° N and 30° S boundaries to avoid artificial temperature edges. We only correct the SSTs from the tropical regions as we assume the influence of SST biases from higher latitudes to be comparably small.
Furthermore, all simulations are run with a dynamic background-albedo scheme as described by Specht et al. (2022). The dynamic background-albedo scheme represents changes in the surface albedo due to litter production from vegetation. Vamborg et al. (2011) show that these background-albedo changes substantially increase mid-Holocene precipitation over northern Africa. This dynamic background-albedo scheme is only applied over northern Africa.
With this experiment setup, we conduct a pre-industrial equilibrium simulation with dynamic vegetation and dynamic lakes (pidVdL simulation). This pre-industrial simulation is run for 550 years. The last 150 years of the simulation are used as the averaging period. The average lake extent of the pidVdL simulation is compared to an observation-based lake map from the HydroLAKES data set (Messager et al., 2016) to evaluate the accuracy of the dynamic endorheic lake (DEL) model in parameterizing the Sahelian and Saharan endorheic lakes.
In addition, a set of mid-Holocene simulations are conducted to investigate the individual and synergistic effects of vegetation and lake feedback across northern Africa. In these mid-Holocene simulations, the vegetation and lakes are either statically prescribed using boundary conditions derived from the 150-year averages of the pidVdL simulation or dynamically simulated using the interactive vegetation and lake model. The simulations are as follows:
-
The pidVdL simulation is a pre-industrial simulation with dynamic vegetation and dynamic lakes.
-
The mHdVdL simulation is a mid-Holocene simulation with dynamic vegetation and dynamic lakes.
-
The mHdV simulation is a mid-Holocene simulation with dynamic vegetation and prescribed pre-industrial lakes from the pidVdL simulation.
-
The mHdL simulation is a mid-Holocene simulation with prescribed pre-industrial vegetation from the pidVdL simulation and dynamic lakes.
-
The mH simulation is a mid-Holocene simulation with prescribed pre-industrial vegetation and lakes from the pidVdL simulation.
The individual mid-Holocene simulations are run for 500–550 years, and the last 150–200 years of the simulations are used as the averaging period (Fig. A1). Because the variability in monsoon precipitation in the Sahel is high (see Sect. 3.2), an evaluation period of 150 to 200 years is used.
The individual and synergistic effects of the dynamic lakes and dynamic vegetation on the climate variables, e.g. the precipitation over northern Africa, are investigated by applying the following factor analysis:
where mHdVdL−mH is the net response due to the influence of both the dynamic lakes and vegetation. Moreover, δveg and δlake represent the linear (or pure) response to dynamic vegetation and dynamic lakes, respectively. Finally, δsyn is the non-linear response caused by the synergetic effects of dynamic vegetation and dynamic lakes.
Finally, we consider that the simulated dynamic lakes change not only in extent but also in depth. Previous simulation studies have exclusively focused on climate effects caused by changes in lake extent, while climate effects resulting from changes in lake depth have been neglected (Broström et al., 1998; Carrington et al., 2001; Krinner et al., 2012; Chandan and Peltier, 2020; Specht et al., 2022). Therefore, we conduct an additional mid-Holocene simulation using prescribed pre-industrial lake and vegetation extents and a constant 10 m lake depth, as used by Specht et al. (2022), to investigate the effects of the lake depth changes on the mid-Holocene climate across northern Africa:
-
The mHL10 simulation is a mid-Holocene simulation with prescribed pre-industrial vegetation and prescribed pre-industrial lakes with a constant 10 m lake depth.
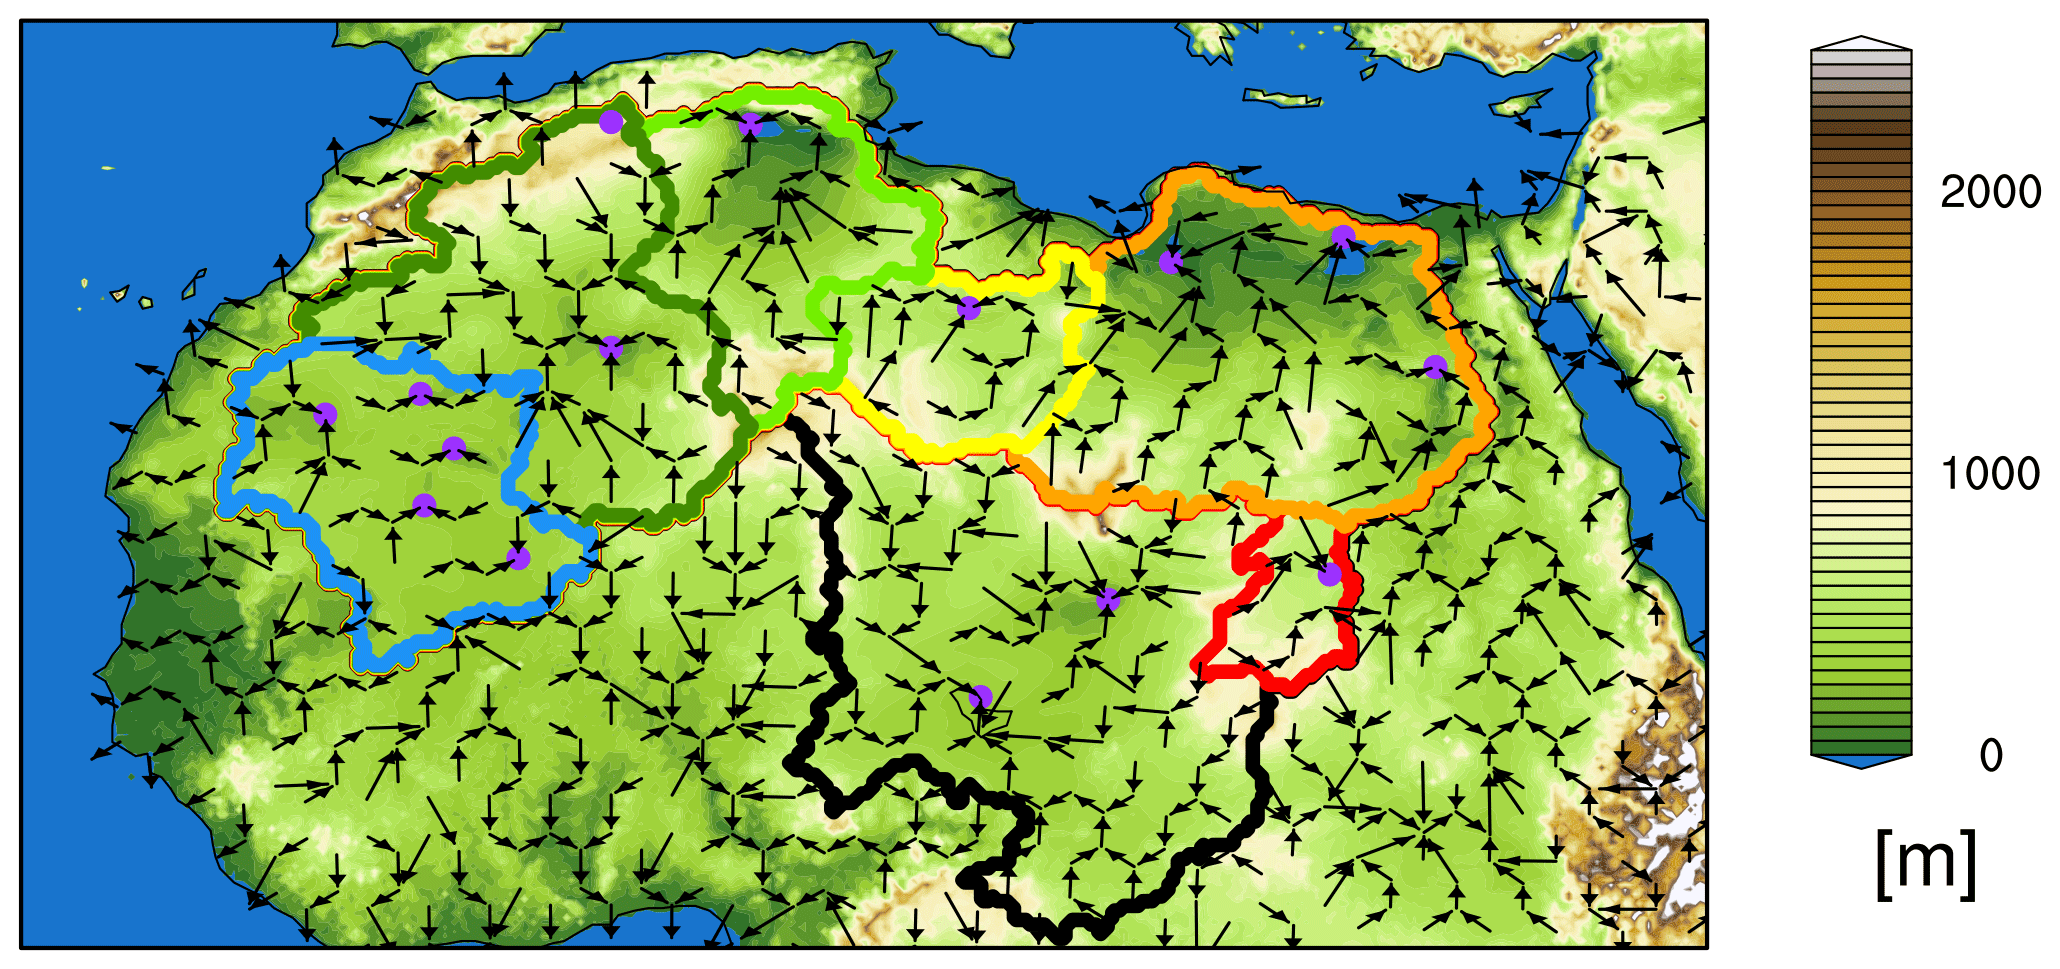
Figure 1River flow directions (arrows) used as boundary conditions to simulate the downslope water transport within each endorheic catchment (coloured outlines) to the internal drainage points (purple dots). The digital elevation model represents the topography in the background. The coloured outlines denote the Chad catchment (black), Darfur catchment (red), Taoudenni catchment (blue), Ahnet catchment (dark green), Chotts catchment (light green), Fezzan catchment (yellow), and a northeastern African catchment (orange). Please note that these endorheic catchments were generated in a way that suits the resolution of the model simulations. For finer geographical resolution, the marked region can be split into smaller sub-catchments.
In all simulations, the lake is represented as a pure mixed layer of a given depth, and the lake extent and lake depth only vary within the endorheic catchments across northern Africa (coloured outlines in Fig. 1). In the results, we will show that understanding the effects of lake depth changes, particularly regarding Lake Chad, is essential for explaining the simulated synergistic effects across northern Africa seen in the mid-Holocene experiments.
The effect of reducing the depth of Lake Chad by 1–5 m from a standard model depth to the actual simulated depth of the pre-industrial Lake Chad is given by
In the analysis, some changes in δsyn and δdepth are only shown as time averages of the rain season, which is from June to September (JJAS). Since most of the annual precipitation falls over northern Africa during JJAS, the atmospheric response to dynamic lakes and vegetation that cause precipitation changes over northern Africa becomes most obvious in this season.
2.1 Dynamic endorheic lake model concept
The Sahara and Sahel mainly consist of endorheic catchments, which are catchments without an outlet to external waters, such as rivers or the ocean (coloured outlines in Fig. 1). Within the endorheic catchments, surface runoff and sub-surface drainage flow downslope into internal orographic depressions, where lakes expand and shrink depending on the terrestrial water budget of the corresponding catchment (symbolized by the purple dots in Fig. 1). This concept of endorheic catchments is used in our study to simulate the dynamic lake extent across northern Africa. In the following, we describe the technical concept of the dynamic endorheic lake model (DEL model) and how it is integrated into the hydrological discharge model (HD model; Hagemann and Duemenil, 1998; Hagemann and Dümenil, 1997; Hagemann and Gates, 2001), which is part of JSBACH4 (Reick et al., 2021), the land component of the ICON Earth System Model (Jungclaus et al., 2022).
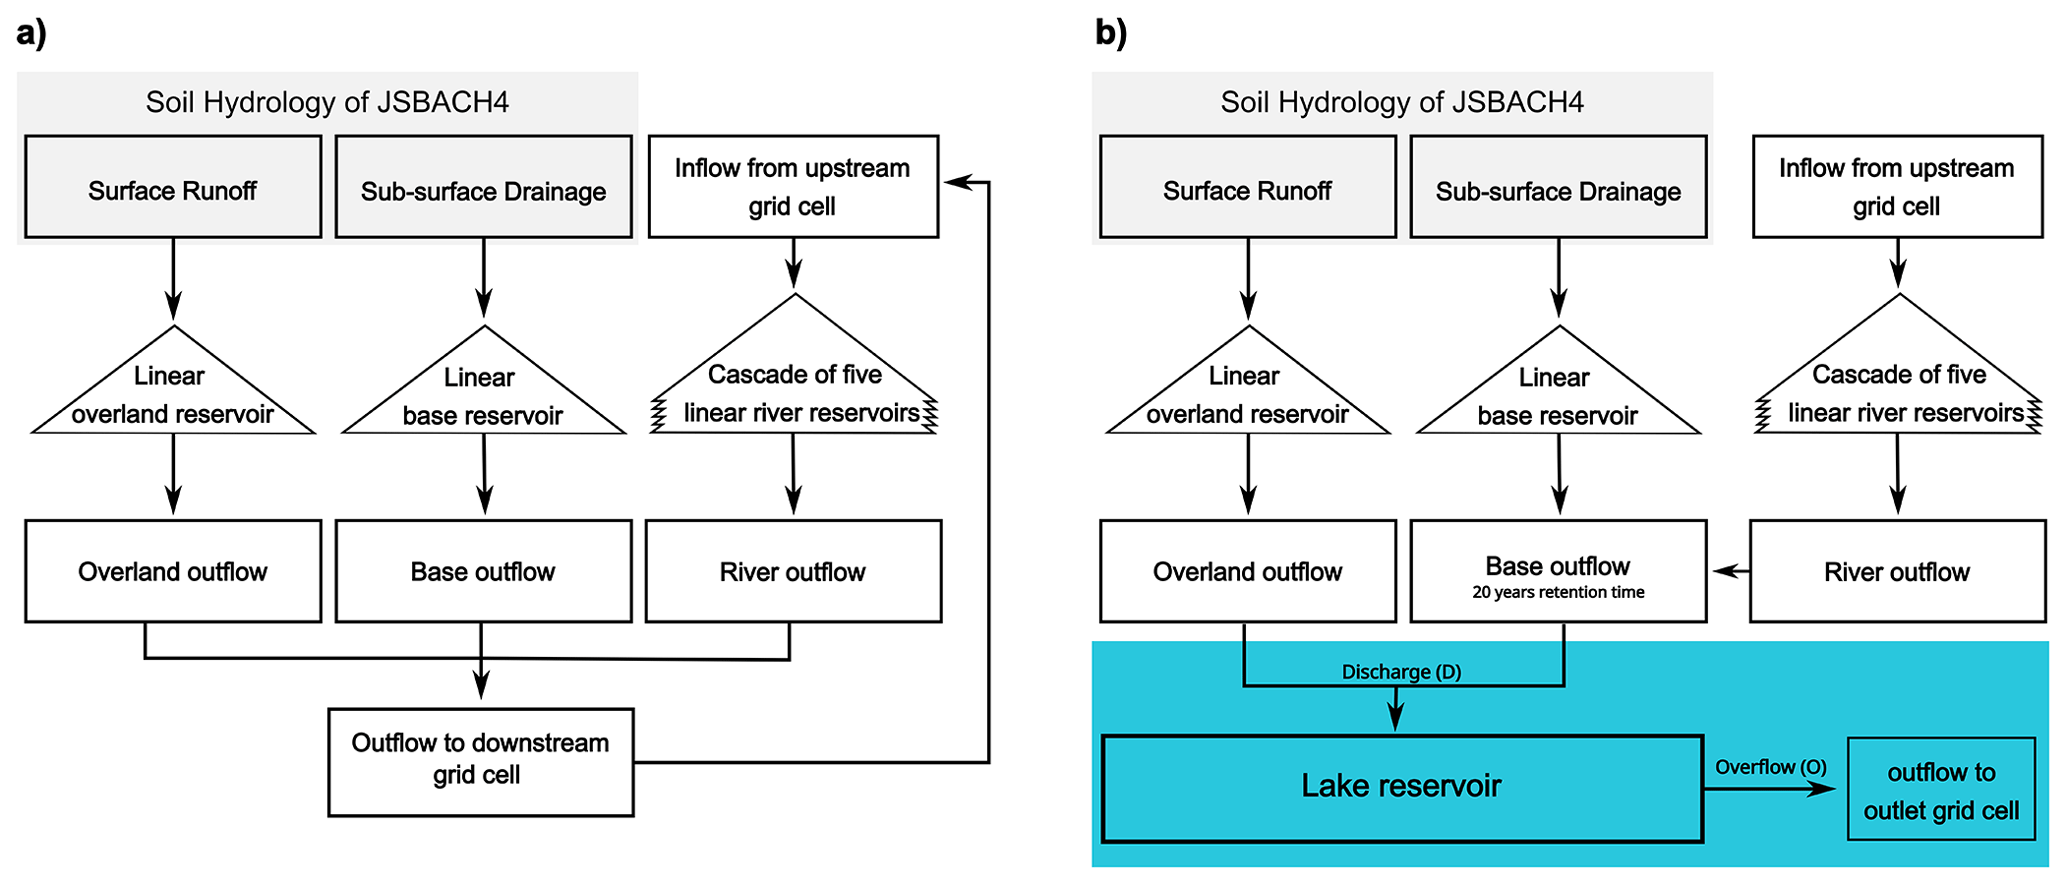
Figure 2Panel (a) shows the standard structure of the HD model (adapted from Hagemann and Duemenil, 1998). The input from soil hydrology is shaded in grey. Panel (b) shows the structure of the HD model at the internal drainage point and the embedded endorheic-lake reservoir with its inflow from and outflow to the HD model (blue box).
The HD model is a river-routing model that runs on the same resolution as the land component, JSBACH4, which is ∼ 160 km for this study. The HD model includes an overland flow, base flow, and river flow (Fig. 2a). These flows are calculated based on the linear reservoir concept, which assumes a time-constant retention time k of water in a reservoir and, thus, a linear relationship between the reservoir water storage S(t) and the water outflow Q(t) from that reservoir (e.g. Kang et al., 1998), which is expressed as
The retention time (k < 1 d) for the overland flow and the river flow of the HD model is derived from the local slope of the orography, while the retention time for the slower base flow is set to a constant value of 300 d.
The water inflow to the HD model is given by the surface runoff for the overland reservoir and by the sub-surface drainage for the base reservoir (Fig. 2a). The k-dependent outflow from the overland and base reservoir is transported to the river reservoir of the neighbouring downstream grid cell (Fig. 2a). The river reservoir is a cascade of five linear sub-reservoirs that all have the same retention time (Fig. 2a). After the water has passed through the linear river reservoir cascade, the outflow from this reservoir is transported further downstream to the river reservoir of the next neighbouring grid cell. In this way, the discharge water flows downslope until it reaches either an internal drainage grid cell (purple dots in Fig. 1) or a coastal grid cell.
At the internal drainage grid cells, discharge water enters the local lake reservoir of the DEL model (Fig. 2b). Remote sensing studies show that, in the Sahel and Sahara, most of the discharge water is transported to the groundwater reservoir below the internal depressions via a sub-surface flow. For example, in the Chad catchment, about ∼ 70 % of the seasonal discharge contributes to the sub-surface groundwater reservoir (and soil moisture) and less than 30 % of the seasonal discharge directly flows into the surface storage of the Lake Chad (Pham-Duc et al., 2020). The Quaternary groundwater aquifer and the above-surface storage of Lake Chad exchange water on a much longer timescale. A time period of about 20–40 years is needed to completely replace the water volume of Lake Chad (from before the Sahelian drought in the 1970s) with water from the Quaternary groundwater aquifer (Bouchez et al., 2016). In the HD model, such a groundwater reservoir is missing. First simulations showed that unrealistically high inter-annual fluctuations in the lake extent occur when the discharge from the (surface) river reservoir is added directly to the lake reservoir. To avoid these unrealistically high fluctuations, the outflow from the river reservoir is added to the base reservoir at the internal drainage grid cells, and the retention time of this base reservoir is set to 20 years (Fig. 2b). This 20-year period is taken from an estimate of the residence time of water in the Quaternary groundwater aquifer before it enters Lake Chad (Bouchez et al., 2016). We use this 20-year residence time as a rough approximation for all internal drainage grid cells within the Saharan endorheic catchments (see Sect. 2.2).
The lake water volume change, ΔVlake, of the DEL model is described by the following equation:
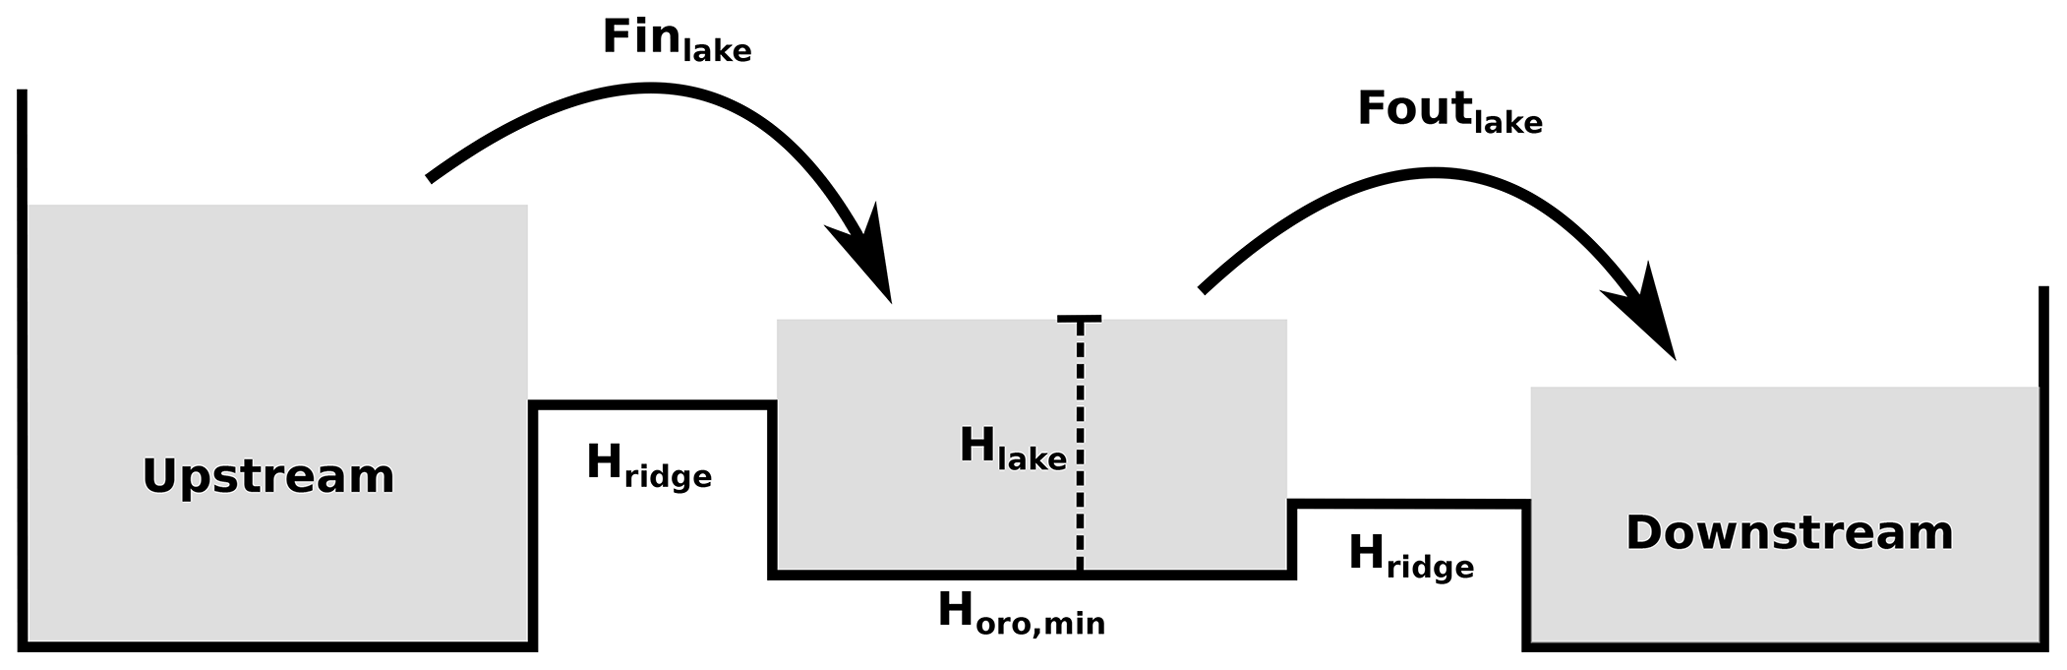
Here, D represents the discharge water at the internal drainage grid cell given by the HD model (Fig. 2b). O represents the lake water outflow that is returned to the HD model at the outlet point of the respective basin (Fig. 2b). This overflow only occurs when the lake level exceeds the outlet height of the lake basin – that is, when the maximum basin volume, Vlake,max, within a grid cell is exceeded (which did not happen in our simulations). Moreover, flake represents the lake fraction of the grid cell that directly interacts with the atmosphere through precipitation P and evaporation Elake. The evaporation over the lake surface is assumed to be equal to the potential evaporation, which depends on the surface temperature and surface roughness of the lake. Foutlake and Finlake describe the lateral lake water flow between neighbouring grid cells of the same lake basin as a lake grows or shrinks. This lateral lake water flow compensates for lake-level differences between grid cells of the same lake basin or sub-basin.
The lateral lake water flow between neighbouring grid cells depends on the absolute lake-level height Hdyn of each grid cell, which is the sum of the orographic minimum elevation (or bottom point) of a grid cell Horo,min and the lake level Hlake above this bottom point and is expressed as
While Horo,min is determined by fixed boundary conditions, Hlake is derived using a lookup table that describes the lake's volume–area–height relation for each grid cell at 1 % lake fraction intervals (see Sect. 2.3). The lake level and lake area for a given lake volume are derived using linear interpolation between the intervals in this lookup table. The lookup table uses 1 % lake fraction intervals to ensure that lake fraction errors do not exceed 1 % for a given lake volume per ICON grid cell.
To accurately represent the lake water flow between neighbouring grid cells with regard to the basin and sub-basin orography, the maximum ridge elevation between each grid cell and its three neighbouring lake grid cells (Horo,ridge) is required (see Sect. 2.3). Horo,ridge allows for the representation of several sub-basins, such as the Chad Basin, and the Bodélé Depression in the Chad catchment. For example, lake water flows from present-day Lake Chad into the northern Bodélé Depression only when the lake level of Lake Chad exceeds Horo,ridge.
Based on Hdyn and Horo,ridge, the dynamic flow directions and the flow velocity between grid cells of the same basin are determined. The dynamic flow directions and the corresponding flow velocity depend on the absolute lake-level differences (ΔHdyn) between two neighbouring lake grid cells, given by
where Hdyn(up) represents the dynamic lake level of the upstream grid cell and Hdyn(down) represents the dynamic lake level of the downstream grid cell. ΔHdyn is recalculated at each time step.
The flow velocity is calculated using the Manning–Strickler equation, which describes an open-channel flow (Strickler, 1981):
where vlake is the flow velocity between two neighbouring grid cells. Moreover, kst () is the roughness coefficient according to Strickler, which measures the wall roughness of the channel flow (pages 10–12 in Strickler (1981)), and kst is set to a constant value of 100, indicating a fast flow over smooth concrete. By choosing this high value, we assume that lake-level differences between neighbouring grid cells are equalized on a short timescale. Furthermore, Δx is the distance between the centre points of two neighbouring grid cells.
The lateral lake flow, Flake, represents the lake water inflow, Finlake, to the downstream grid cell and the lake water outflow, Foutlake, from the upstream grid cell, as described in Eq. (4). It is expressed as
where Vlake is the lake water volume of the upstream grid cell and Δt is the integration time step of the model.
Finally, by default in JSBACH4, lakes are represented as a mixed layer with a constant depth of 10 m. The simulated lakes of the DEL model, in contrast, are represented as a mixed layer with a dynamic lake depth. This dynamic lake depth corresponds to the simulated lake level, Hlake, at the current time step, where a minimum depth of 1 m is applied. The dynamic lake depth affects the energy storage of the lakes and, thus, their surface temperature.
2.2 Boundary conditions for the HD model
The HD model requires flow directions and reservoir retention times as input boundary conditions in order to simulate the downslope transport of discharge water to internal drainage grid cells or ocean grid cells. The flow directions and reservoir retention times for the HD model are generated using version 1.3 of the MPI-DynamicHD model (Riddick et al., 2018). The MPI-DynamicHD model requires a 10′ (minutes of arc) orography data and the location of the internal drainage grid cells to be flagged on a 10′ grid as input data. These input data are derived from a 30′′ (seconds of arc) digital elevation model (DEM) and outlines of endorheic catchments from the HydroSHEDS (Hydrological data and maps based on SHuttle Elevation Derivatives at multiple Scales) data set, which are regridded to a 10′ resolution (Lehner and Grill, 2013).
The internal drainage grid cells are here defined as bottom points of a lake basin or lake sub-basin. To derive these internal drainage grid cells at a 10′ resolution, the 10′ orography data and the ICON grid at a ∼ 160 km horizontal resolution are used as input data. In a first step, the 10′ orography data are used to find local minima within a 9 × 9 grid cell box. The local minimum with the lowest elevation within the region of each coarser ICON grid cell is selected and flagged as a potential internal drainage grid cell. Subsequently, the basins of these flagged local minima are flooded, starting with the local minimum with the lowest elevation. The orography around the local minimum is flooded until one of the following conditions is met: (1) the boundaries of the corresponding endorheic catchment are reached, (2) the next downstream lake basin is reached, or (3) the flooding height falls below the elevation of the current local minimum.
After all local minima and their basins are flooded, only the largest basin and all smaller downstream basins within each endorheic catchment are selected. Additionally, the flooded basin of a local minimum must cover at least 20 % the area of an ICON grid cell. Since large basins might contain several sub-basins, all local minima within a basin that cover an area as large as that of one ICON grid cell are considered. The abovementioned minimum basin and sub-basin areas are set in a way that ensures the MPI-DynamicHD model generates reasonable flow directions at the coarse R2B4 ICON resolution (∼ 160 km; black arrows in Fig. 1).
After processing the flow directions and retention times with the MPI-DynamicHD model, the retention times of the base flow reservoirs in the internal drainage grid cells are set to 20 years, as mentioned in Sect. 2.1. This reduces unrealistically high fluctuations in the simulated lake discharge water inflow, making the lake size less sensitive to inter-annual precipitation variability.
2.3 Boundary conditions for the DEL model
The DEL model requires a set of boundary conditions to simulate the growth and shrinkage of endorheic lakes across northern Africa. To simulate the lake extent and lake height, a lake height–area–volume lookup table for each grid cell (Hlake and flake) is needed. To simulate the water flow between neighbouring lake grid cells, the minimum geographic height of each grid cell (Horo,min) and the minimum ridge height of the three neighbouring grid cells (Horo,ridge) are also needed. To simulate the overflow of the lakes in the case where the whole lake basin is flooded, the maximum lake volume (Vlake,max) and the lake basin outlet point are required. All these boundary conditions are derived from a 30′′ digital elevation model (DEM) and outlines of endorheic catchments from the HydroSHEDS data set, which are regridded to a 10′ resolution (Lehner and Grill, 2013).
The minimum geographic height (Horo,min) for each grid cell is determined by identifying the minimum elevation of the 10′ orography within each coarse-resolution ICON grid cell. The lake height–area–volume lookup table is derived by gradually flooding the 10′ orography within the boundaries of each ICON grid cell individually. The minimum ridge height of the three neighbouring grid cells (Horo,ridge) is determined by flooding the 10′ orography, starting at the point of minimum elevation of the current ICON grid cell and ending at the point of minimum elevation of the neighbouring ICON grid cell. The maximum elevation point of this flooding process is set as the minimum ridge height for the corresponding neighbouring grid cell.
The maximum lake volume (Vlake,max) and the lake basin outlet points used to simulate the overflow of a lake basin are derived based on the internal drainage grid cells and the 10′ orography described in Sect. 2.2. The outlet point of each lake basin is determined by flooding the 10′ orography, starting from the internal drainage grid cells. The 10′ orography is flooded until the first ICON grid cell that lies outside the lake basin is reached. This ICON grid cell is set as an outlet grid cell. The maximum lake volume for each grid cell is calculated from the difference between the outlet height and the 10′ orography.
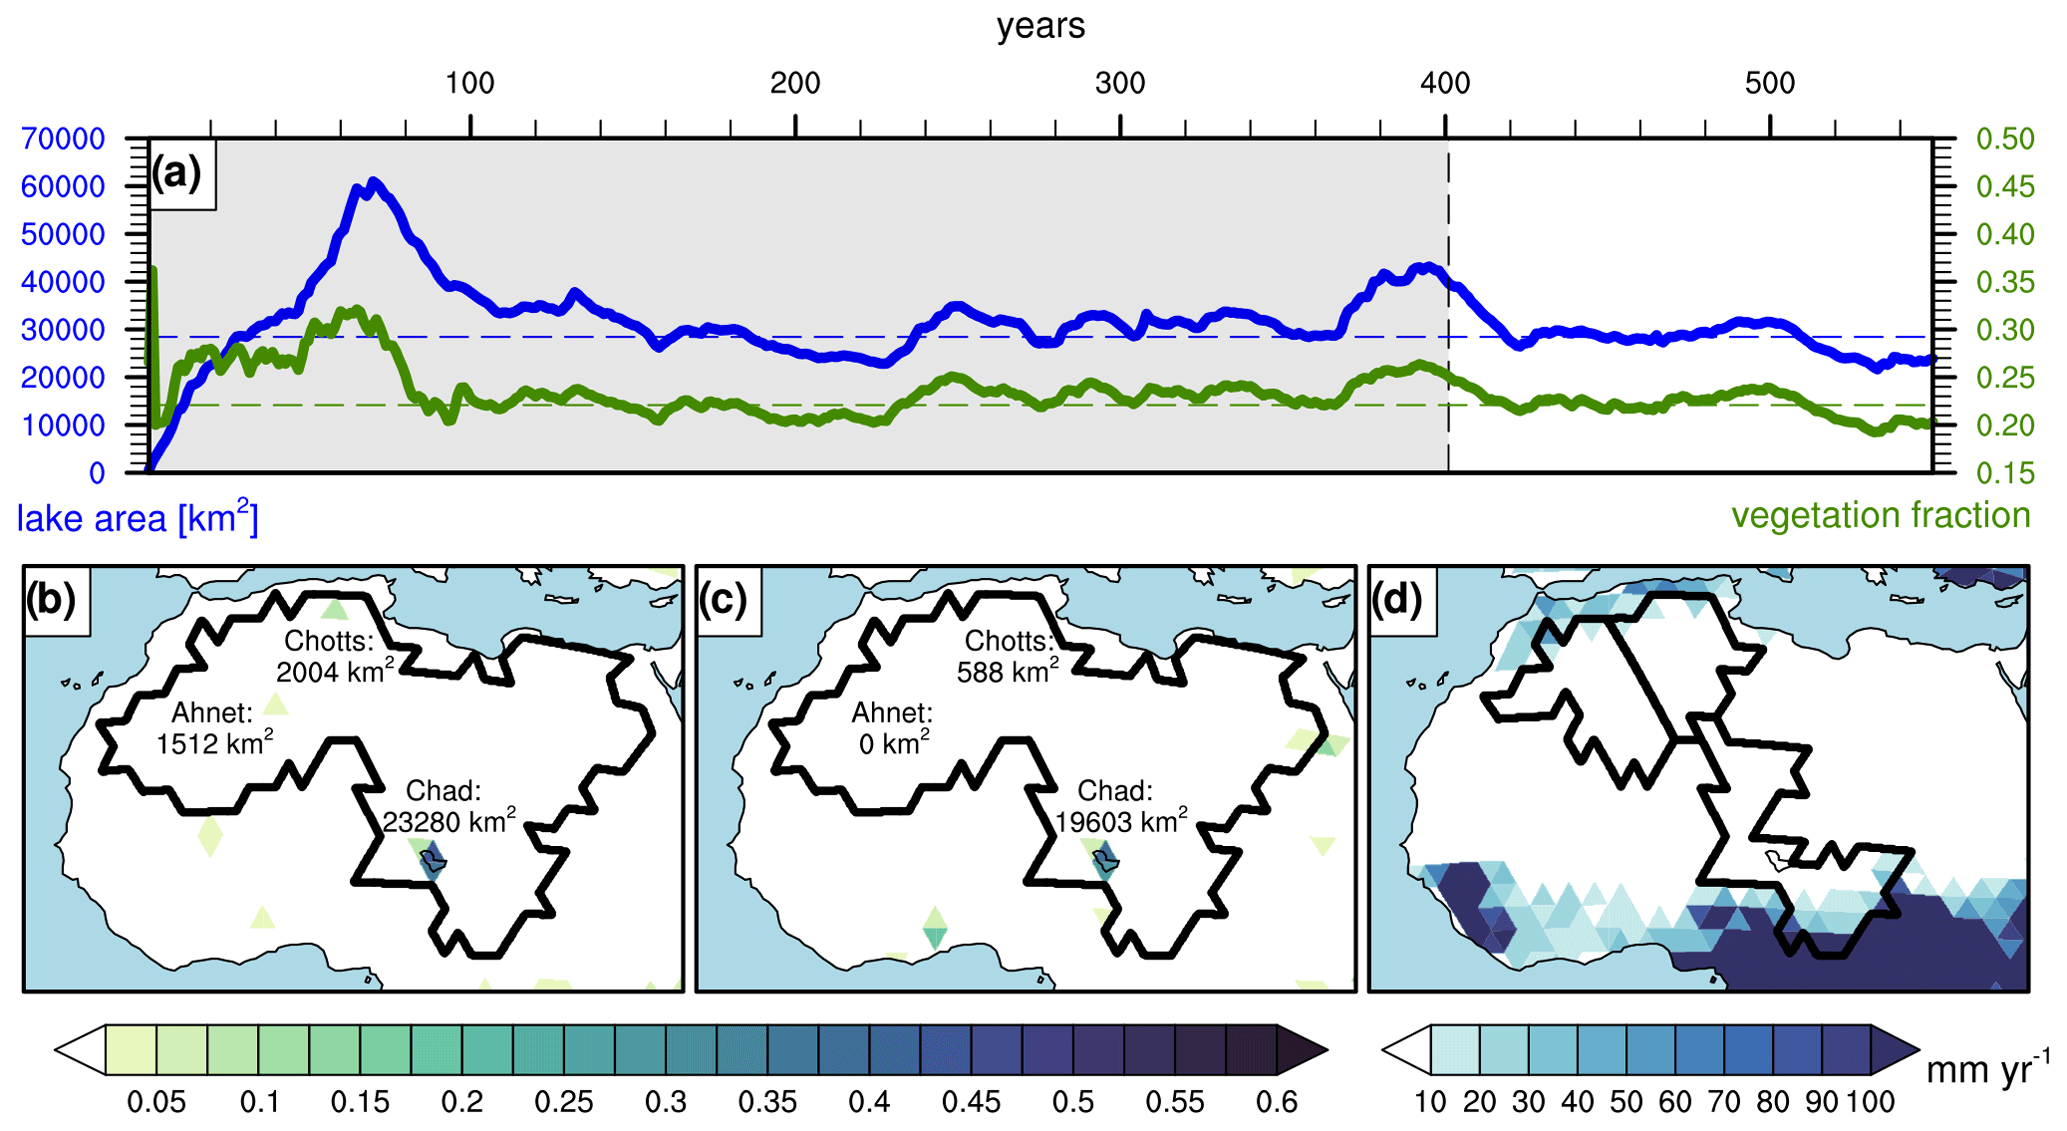
Figure 4Panel (a) shows the simulated pre-industrial time series of the lake area within the endorheic catchments across northern Africa (blue line) and the vegetation cover averaged across northern Africa (green line) (10–35° N, 20° W–35° E). The dashed blue and green lines represent the mean lake area and mean vegetation cover averaged over the last 150 years. The lower panels show (b) the simulated pre-industrial lake cover fraction averaged over the last 150 years of the pidVdL simulation, (c) the observation-based pre-industrial lake cover fraction derived from the HydroLAKES data (Messager et al., 2016), and (d) the simulated pre-industrial runoff and drainage averaged over the last 150 years of the pidVdL simulation, respectively. The black boundaries in panels (b) and (c) outline the endorheic catchment region, where the lake extent is simulated dynamically. The black boundaries in panel (d) indicate the boundaries of the Ahnet, Chotts, and southern Chad catchments.
The pidVdL simulation is run for 550 years (Fig. 4a). To derive a robust result, the last 150 years (white section in Fig. 4a) are used as the evaluation period.
The simulated surface area of Lake Chad from the pidVdL simulation is about 3677 km2 (∼ 18.8 %) larger than the observation-based surface area of Lake Chad from the HydroLAKES data set (Fig. 4b and c). A surface deviation of 18.8 % is relatively small since Lake Chad is characterized by a wide and shallow basin. Accordingly, small changes in the water budget can lead to comparatively large changes in the surface extent. For example, a drought in the 1970s and 1980s reduced the surface area of Lake Chad by about 90 % (e.g. Olivry et al., 1996) – from about 20 000 km2 (1950–1972) to less than 2000 km2 (1980s) (e.g. Pham-Duc et al., 2020; Bouchez et al., 2016). Considering these large changes in the surface extent, we conclude that the HD–DEL model properly simulates the pre-industrial equilibrium state of Lake Chad.
The simulated surface areas of the Ahnet and Chotts lakes from the pidVdL simulation are overestimated by about 1512 km2 (currently a dry basin) and 1416 km2 (∼ 340,8 %), respectively, in comparison to the HydroLAKES data (Fig. 4b and c). Both lakes receive most of their water inflow through runoff and drainage from the Atlas Mountains in the northwestern region of Africa (Fig. 4d). The overestimated water inflow from the Atlas Mountains is likely due to the coarse resolution of the ICON-JSBACH4 model, which causes an inaccurate representation of the catchment's watershed as well as an inaccurate representation of the small-scale heterogeneous precipitation from orographic updrafts.
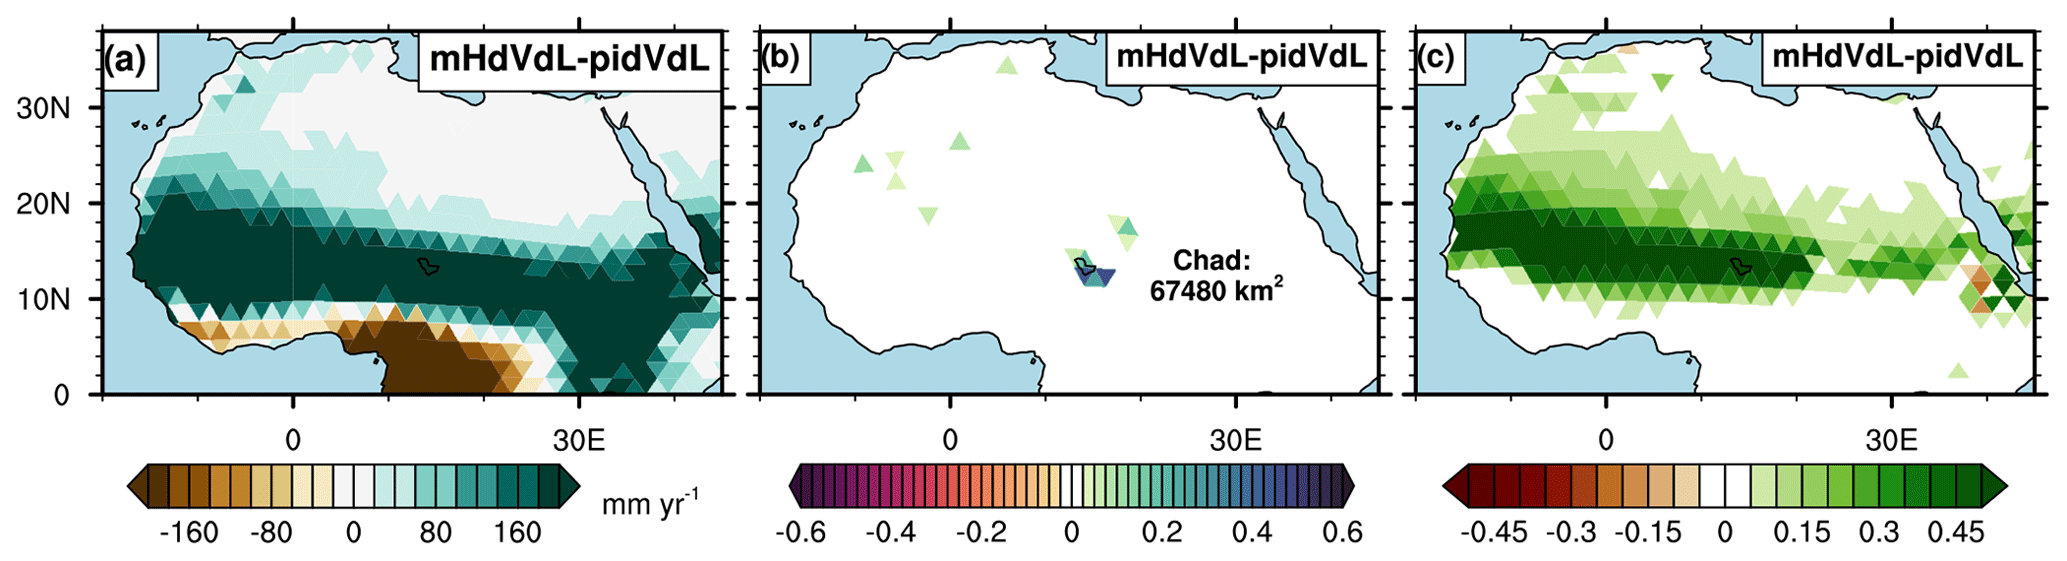
Figure 5Simulated changes in mid-Holocene (a) annual precipitation (mm yr−1), (b) lake fraction, and (c) vegetation cover compared to the pre-industrial simulation (mHdVdL−pidVdL). The lake and vegetation cover fractions describe the cover fraction within each grid cell and are, therefore, unitless.
Other simulated lakes from the pidVdL simulation that are surrounded by flatter terrain are in better agreement with the HydroLAKES data (Fig. 4b and c). This includes lakes in the northwestern Sahara, whose surface extent is less than 2.5 % of that of an ICON grid cell (Fig. 4b). Similarly, simulated lakes bordering mountains that induce less orographic-forced precipitation are in better agreement with the HydroLAKES data. For example, Lake Chad mainly receives its discharge water from the southern part of the catchment, rather than from the Ahaggar and Tibesti mountains in the north (Fig. 5d). Satellite observations show that > 90 % of the discharge water received by Lake Chad is provided by the Chari–Logone river system in the southern part of the catchment (E.g. Pham-Duc et al., 2020).
Thus, the HD–DEL model accurately simulates the pre-industrial surface extent of Saharan lakes, such as Lake Chad; however, this is not the case for lakes adjacent to mountains that receive most of their discharge water from orographic-forced precipitation.
3.1 Mid-Holocene precipitation, lake, and vegetation changes
Comparison between the mHdVdL and pidVdL simulations shows that the prescribed mid-Holocene forcing (orbital, GHG, SST, and SIC forcing) combined with the simulated mid-Holocene lakes and vegetation extent cause a dipole-like “wet-north–dry-south” precipitation response around 10° N (Fig. 5a). This dipole-like precipitation change is associated with a northward shift in the West African summer monsoon rain belt. In addition to the mid-Holocene precipitation increase over the Sahel and western Sahara, Lake Chad expands at its southern boundary, and the overflow of the Chad Basin into the Bodélé Depression leads to further lake expansion northeast of Lake Chad (Fig. 5b). Additionally, some smaller lakes form in the western Sahara (Fig. 5b). The vegetation cover mainly increases across the Sahel (12–18° N) and the western Sahara, corresponding to the pattern of the precipitation increase over northern Africa (Fig. 5a and c).
The simulated mid-Holocene lake and vegetation extents shown in Fig. 5 also occur when starting the mHdVdL simulation with different initial conditions. A mid-Holocene simulation similar to the mHdVdL simulation but initiated with completely filled lake basins and a vegetation cover of 100 % over northern Africa (mHdVdLmax) reaches a similar equilibrium state (Fig. A1a and d). These results suggest that the simulated mid-Holocene lake extent and vegetation extents in the ICON-JSBACH4 model are independent of the prescribed initial conditions.
The ICON-JSBACH4 model underestimates the mid-Holocene precipitation increase and, thus, the expansion of lakes and vegetation over northern Africa (Fig. 5). The simulated precipitation in the central Sahara increases by up to 100–200 mm yr−1 (Fig. 5a; 18–35° N), whereas reconstructions suggest an increase of about 200–600 mm yr−1 in this region (Brierley et al., 2020; Braconnot et al., 2012; Bartlein et al., 2011) or an even greater precipitation increase of about 500–1500 mm yr−1 (Hély and Lézine, 2014; Tierney et al., 2017; Sha et al., 2019). The simulated lake extent is also substantially smaller than what sediment reconstructions suggest. For, example, the simulated Lake Chad expands to an area of 67 480 km2 (Fig. 5b), whereas reconstructions estimate an area of about 350 000 km2 (Hoelzmann et al., 1998; Quade et al., 2018; Drake et al., 2022). Similar to the lake extent, the simulated extent of Sahelian–Saharan vegetation is also underestimated (Fig. 5c) in comparison to reconstructions (Hély and Lézine, 2014; Lézine, 2017; Hoelzmann et al., 1998) and climate models that produce a more humid climate across northern Africa (e.g. Dallmeyer et al., 2021).
This dry bias across northern Africa is a known issue of the ICON-JSBACH4 model (Schneck et al., 2022) and certain other state-of-the-art climate models (Brierley et al., 2020; Braconnot et al., 2012). Obviously, the presence of dynamic lakes in the ICON-JSBACH4 model does not mitigate the dry bias of the model. In the following, we analyse the extent to which dynamic lakes contribute to a greener Sahara and examine the individual and synergistic contributions of dynamic lakes and dynamic vegetation to the mid-Holocene precipitation increase.
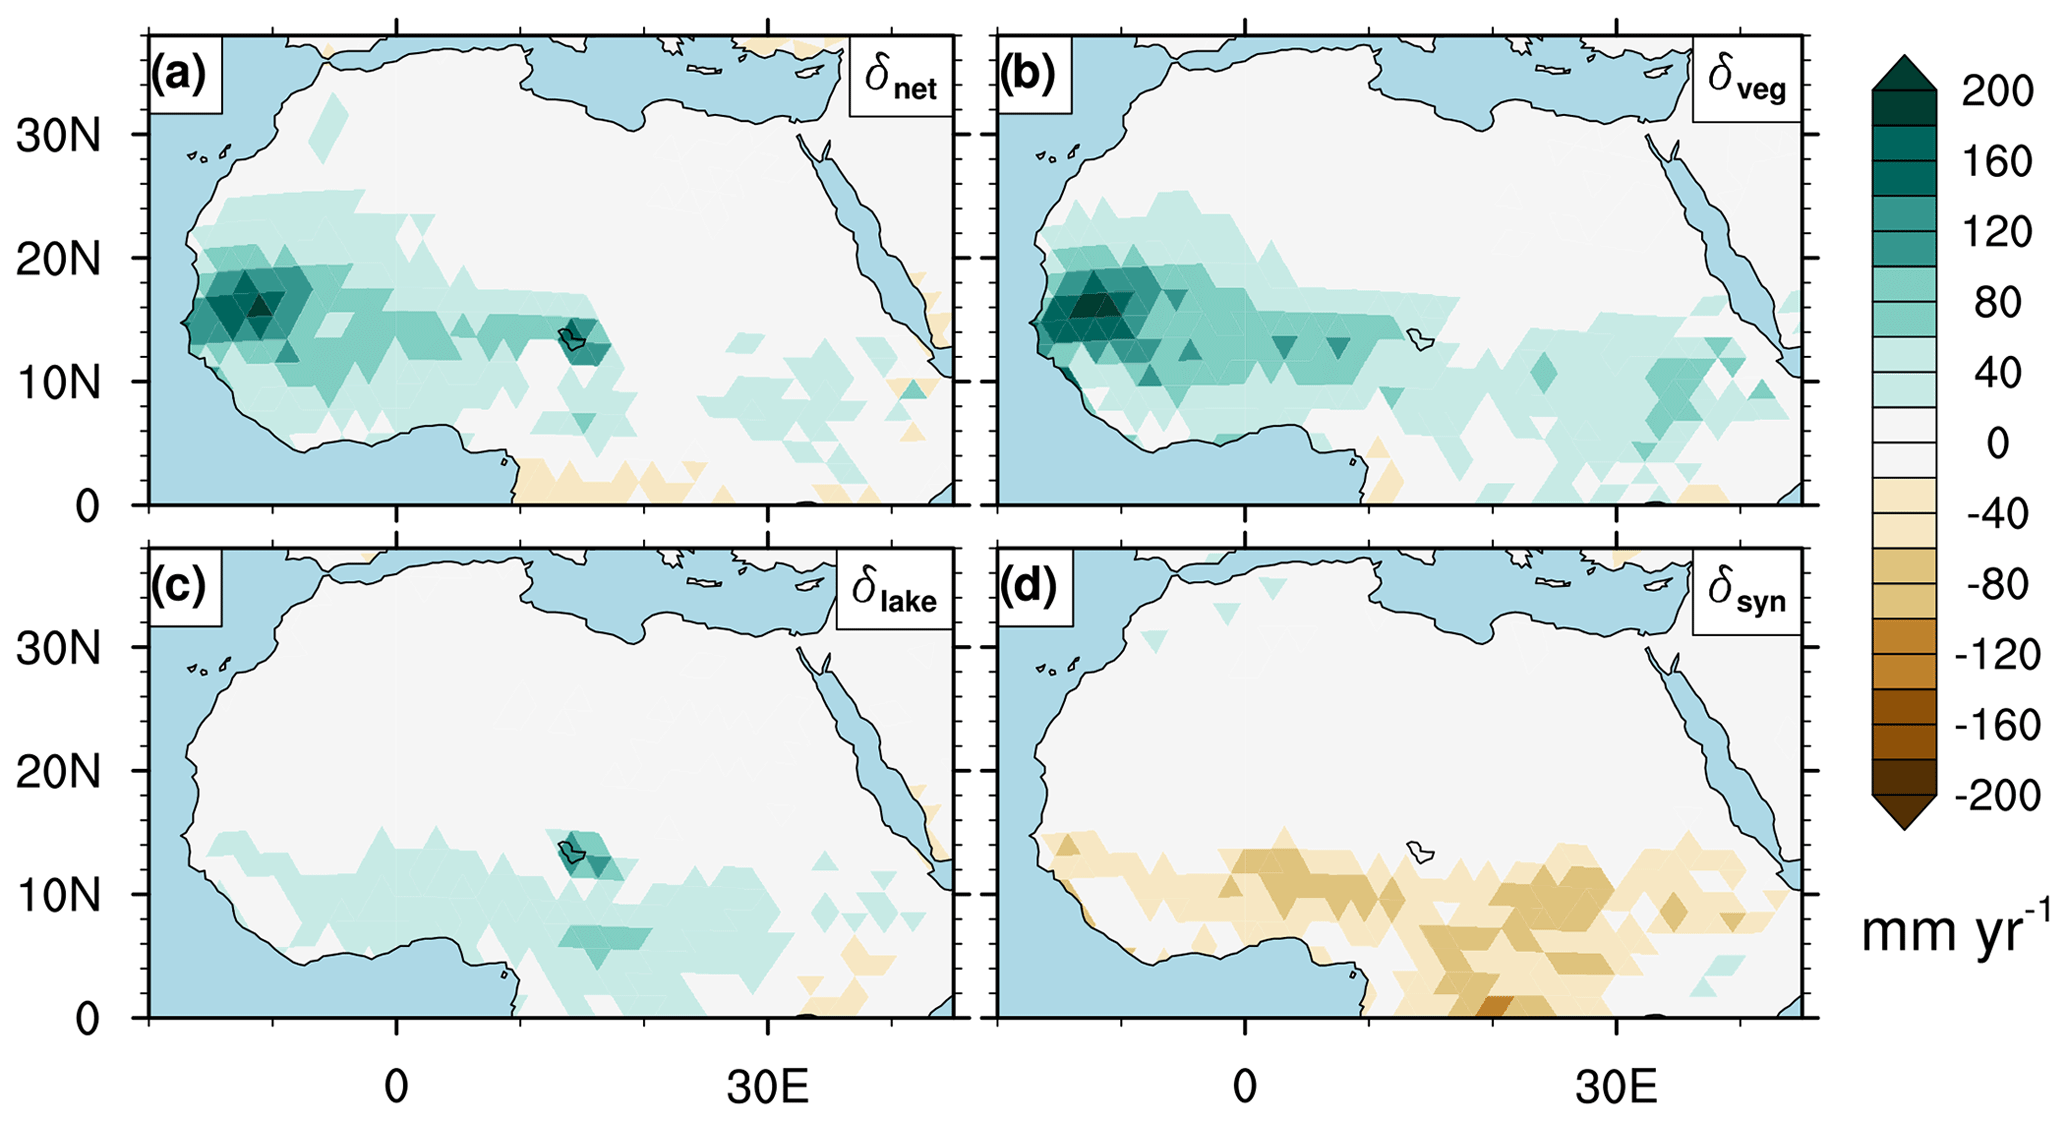
Figure 6Simulated changes in annual mean mid-Holocene precipitation caused by (a) dynamic lakes and dynamic vegetation together (), (b) dynamic vegetation alone (), (c) dynamic lakes alone (), and (d) vegetation–lake synergies (). The mid-Holocene net precipitation changes () decompose as δnet = δdV + δdL + δsyn. The continuous colour shading indicates the significant changes in precipitation according to a two-sided bootstrapping test at significance levels of 0.05 and 0.95.
3.2 Mid-Holocene precipitation response to dynamic lakes and dynamic vegetation
The simulated mid-Holocene expansion of dynamic lakes and dynamic vegetation causes a northward shift in the West African summer monsoon, resulting in a precipitation decrease south of 5° N and a precipitation increase north of 5° N (Fig. 6a). The precipitation increase is strongest over Megalake Chad, the western Sahel, and the Sahara (Fig. 6a). These are also the regions where the simulated mid-Holocene lake expansion (Fig. 5b) and vegetation expansion (Fig. 5c) are most pronounced. The precipitation increase caused solely by the simulated mid-Holocene expansion of dynamic lakes and dynamic vegetation (mHdVdL − mH; Fig. 6a) is small compared to the precipitation increase caused by orbital forcing combined with the dynamics of lake and vegetation (mHdVdL − pidVdL; Fig. 5a). Specifically, it accounts for about 15.4 % (50.6 mm yr−1) in the Sahel (12–18° N, 20° E–35° W) and 32.4 % (11.5 mm yr−1) in the Sahara (18–35° N, 20° E–35° W) (Table A1). Even though the precipitation changes caused by dynamic lakes and vegetation are small compared to the total mid-Holocene precipitation increase (Fig. 5a), they are still significant (Fig. 6).
Dynamic vegetation alone causes a local precipitation increase in regions where vegetation expands across northern Africa (Figs. 5c and 6b). This precipitation increase is caused by enhanced local moisture recycling and a decrease in surface albedo (e.g. Rachmayani et al., 2015). In contrast, Megalake Chad enhances precipitation not only locally over its water surface but also in the region south of the megalake, around 5° N (Figs. 5b and 6c). This precipitation increase is associated with winds that blow from the cool lake towards its warmer surrounding areas. To the south of Megalake Chad, the moist lake winds converge with moist westerly monsoon winds. Because of this moisture convergence to the south of Megalake Chad, moist convection and convective precipitation are enhanced. This, in turn, leads to an increase in the westerly monsoon winds.
A factor analysis shows that precipitation increases from dynamic vegetation alone and dynamic lakes alone (Fig. 6b and c) are, on the whole, greater than the precipitation increase from dynamic lakes and vegetation together (Fig. 6a). Accordingly, the synergistic effect of lakes and vegetation causes a drying response across the entire Sahel (Fig. 6d). Results show that the dynamic vegetation expansion alone causes a greater precipitation increase over the Sahel (Fig. 6b), and the dynamic lake expansion alone causes a greater precipitation increase to the south of Chad Lake (Fig. 6c) compared to the precipitation changes induced by dynamic lakes and dynamic vegetation together (Fig. 6a). These results raise the question of what causes the synergistic effect that leads to a drying response across the Sahel.
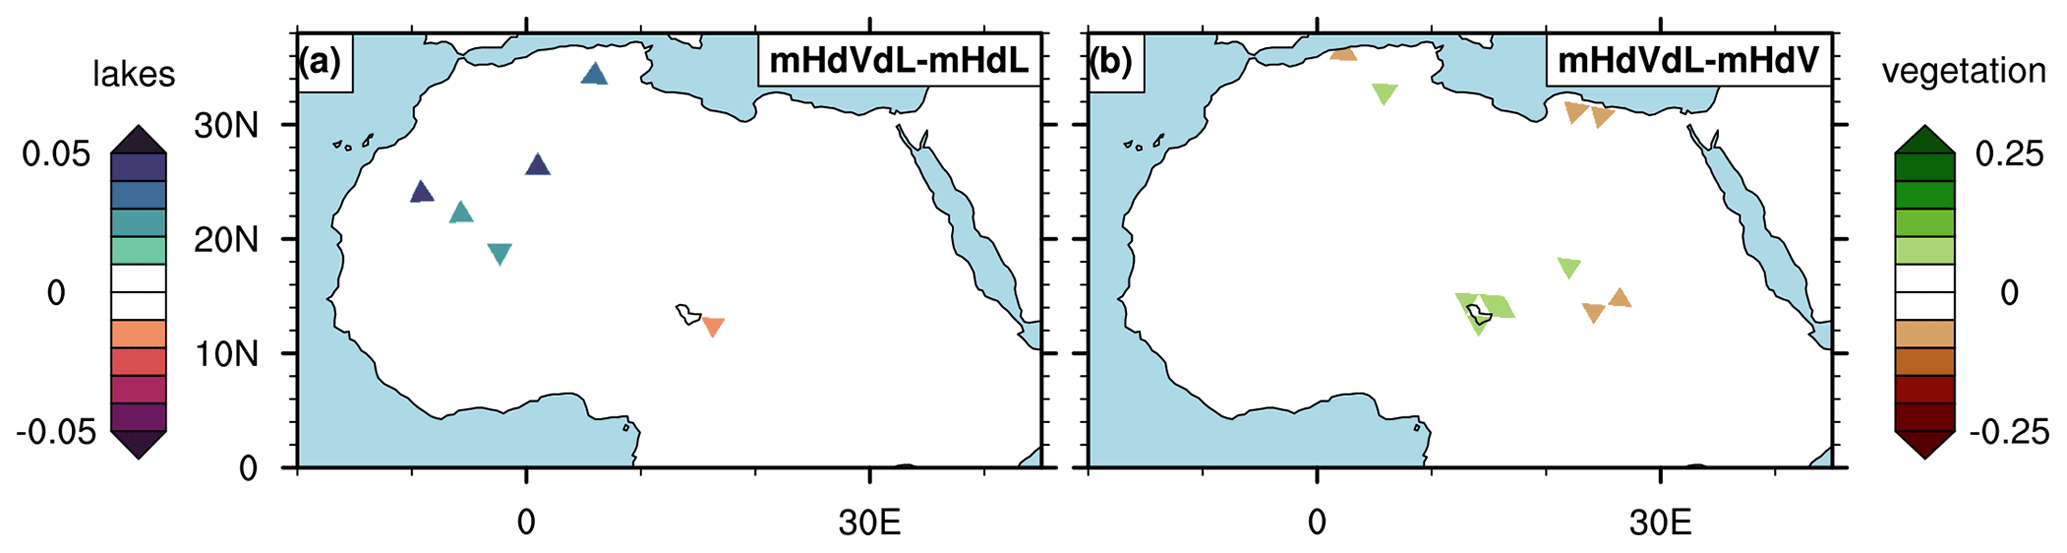
Figure 7(a) Simulated lake extent changes due to the mid-Holocene vegetation cover extent (mHdVdL−mHdL) and (b) simulated vegetation cover changes due to the mid-Holocene lake extent (mHdVdL−mHdV).
The simulated drying response associated with the synergy between the lake and vegetation feedbacks must come from factors other than the competition for areal extent between lakes and vegetation. In fact, comparisons between individual mid-Holocene simulations reveal a weak yet predominantly positive feedback between the areal extent of lakes and that of vegetation. For example, the simulated lake extent enhances local precipitation over Lake Chad (Fig. 6a and b), which results in a small expansion of vegetation in the vicinity of Lake Chad (Fig. 7b). Similarly, the simulated mid-Holocene vegetation extent enhances rainfall in the western Sahara (Fig. 6a and c), which increases the lake extent in this region (Fig. 7a). Only the extent of Megalake Chad slightly decreases (Fig. 7a), which is related to the reduced rainfall to the south of Megalake Chad within the Chad catchment (Fig. 6a and c). The differences in lake and vegetation extents between the individual mid-Holocene simulations are small (Fig. 7) compared to the overall changes in mid-Holocene lake and vegetation extents (Fig. 5b and c; please note the difference in scaling). Thus, the predominately positive feedback between the lake and vegetation extents seems to have only a small influence on mid-Holocene precipitation; therefore, other factors must cause the drying response across the Sahel.
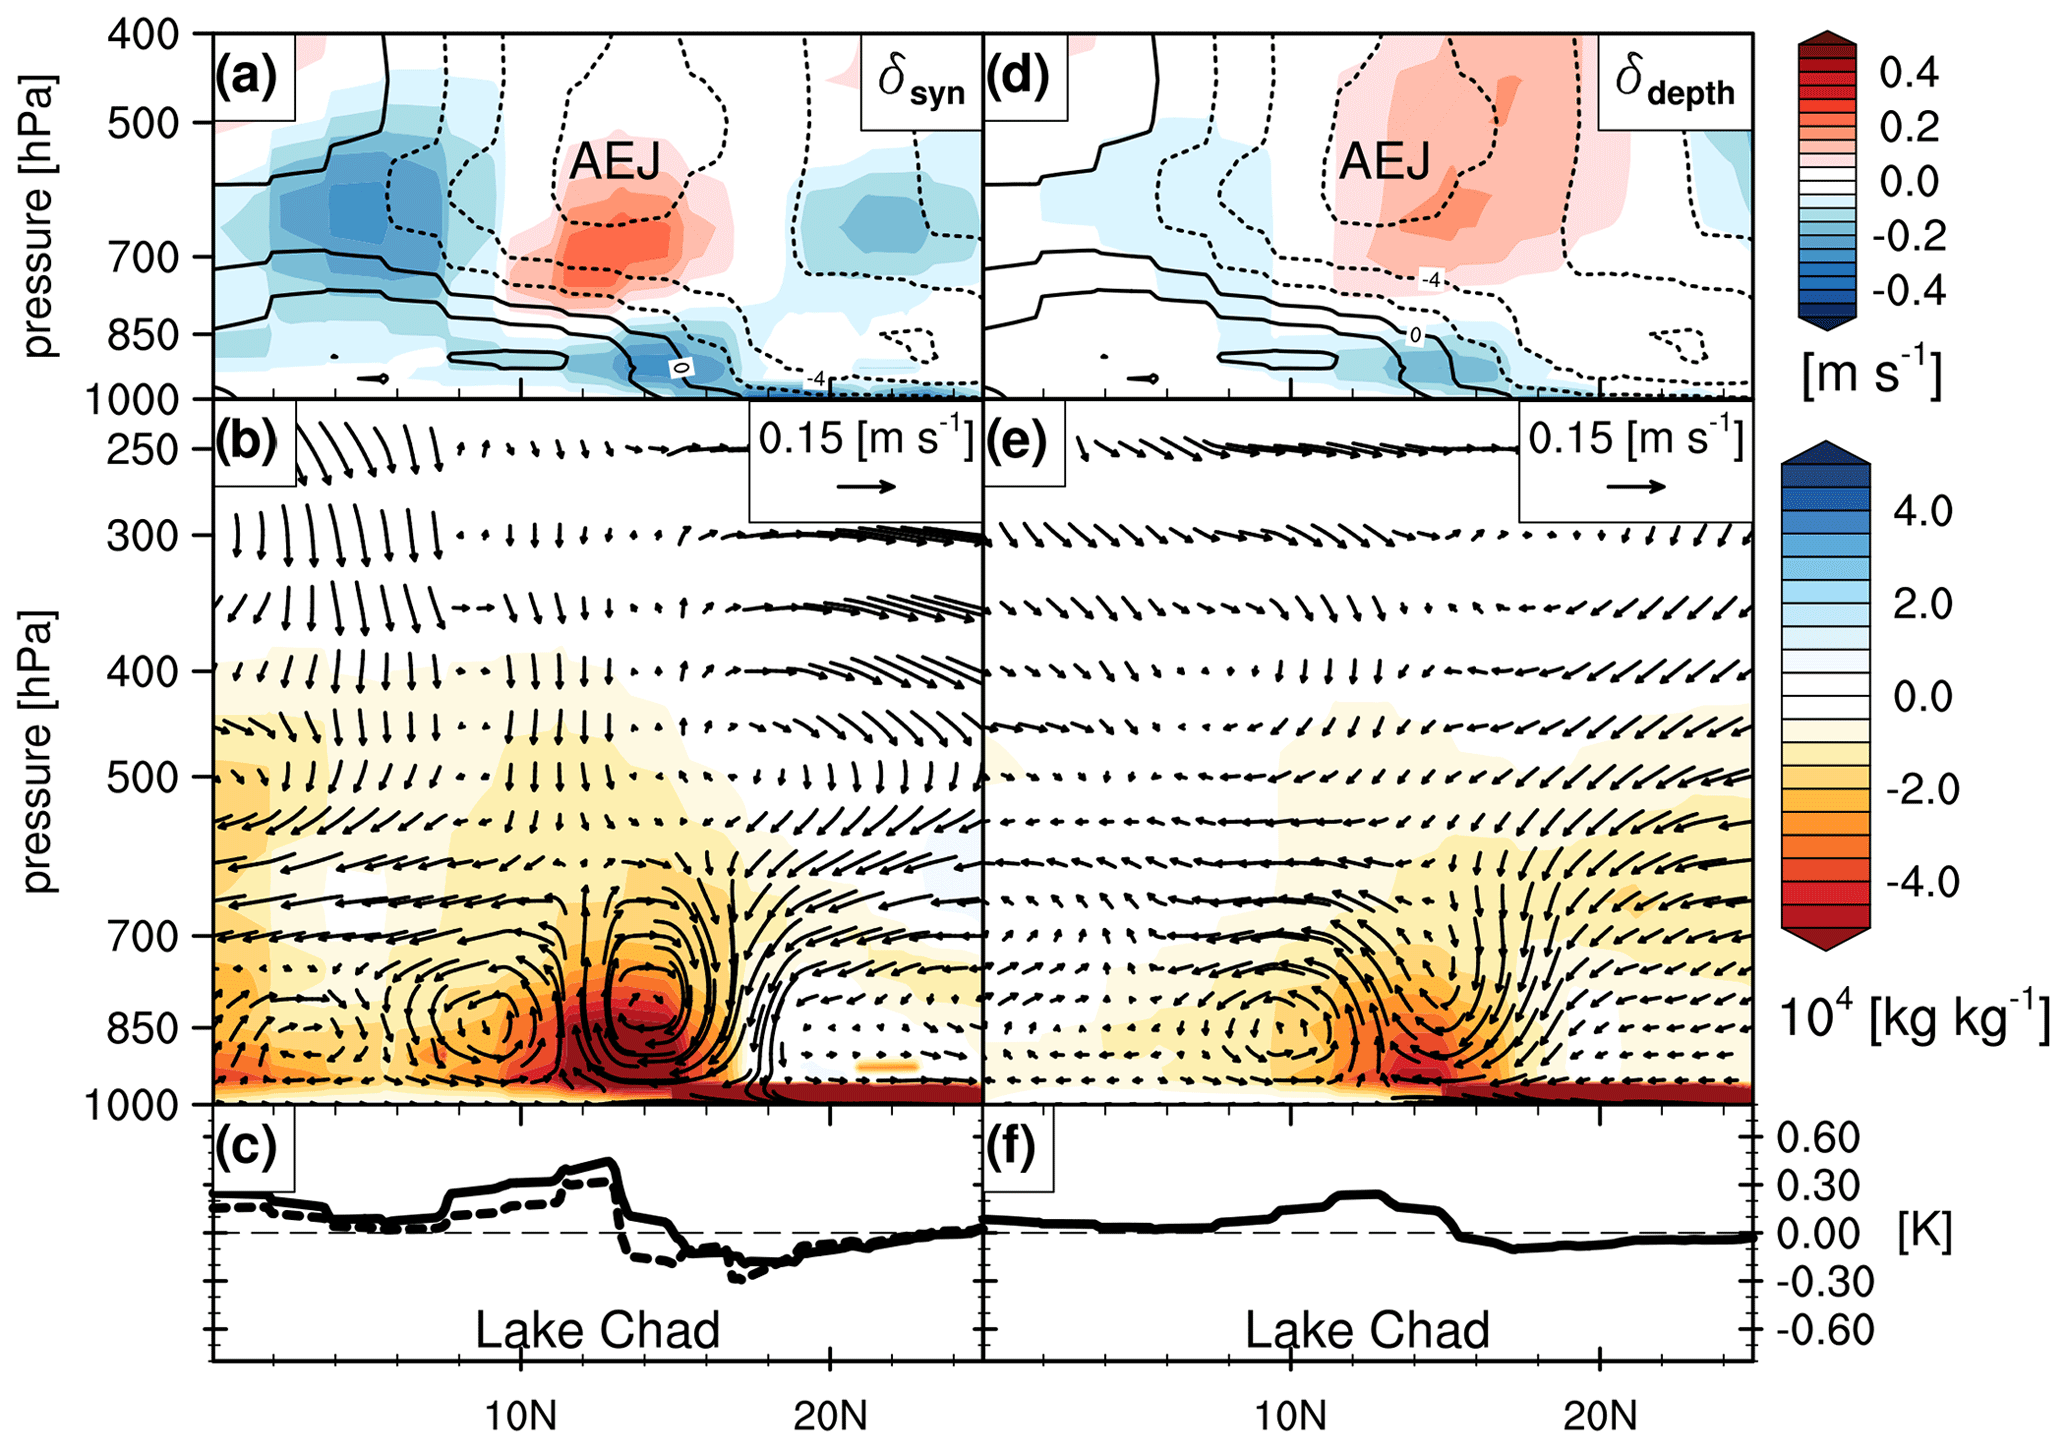
Figure 8Simulated mid-Holocene circulation response (a–c) to the synergistic effect of interacting dynamic lakes and vegetation (; see Eq. 1c) and (d and e) to a decreased depth (but an unchanged area) of Lake Chad (; see Eq. 2). Values are zonally averaged over 10–20° N for the boreal summer months (JJAS). The upper panels (a, d) show the zonal wind response (coloured shading) and the zonal wind climatology of the mH simulation (black contours). The middle panels (b, e) show the vertical and meridional wind response (arrows) and the specific humidity response (coloured shading). Note that the vertical wind component was re-scaled (multiplied by 150) for visibility reasons. The bottom panels (c, f) show the surface-temperature response (solid line). The dashed line in panel (c) shows the surface-temperature changes caused by the mid-Holocene lake expansion in a “green Sahara”, expressed as mHdVdL−mHdV. The “Lake Chad” labels indicate the location of Lake Chad, which is about 11–15° N. AEJ: African easterly jet.
The drying response across the Sahel caused by lake and vegetation dynamics is related to changes in the meridional surface-temperature gradient resulting from a warming response over Lake Chad (solid line in Fig. 8c). The change in the meridional surface-temperature gradient leads to an overturning circulation response with near-surface meridional winds blowing from the colder land towards the warmer lake (arrows in Fig. 8b). The southerly wind response to the north of Lake Chad causes, due to the Coriolis force, an easterly wind acceleration at about 12–16° N (blue shading in Fig. 8a). Additionally, the convergence of meridional winds above Lake Chad appears to be balanced not only in terms of ascending motions (arrows in Fig. 8b) but also with respect to the acceleration of the easterly winds between 8 and 16° N (blue shading in Fig. 8a). The resulting total easterly wind response over Lake Chad counteracts the near-surface westerly monsoon winds that transport moisture from the tropical Atlantic to the African continent. Accordingly, the easterly wind response decreases the moisture availability above Lake Chad (orange shading in Fig. 8b), which dampens the rain-generating deep convection in the overlying middle to upper troposphere (arrows in Fig. 8b).
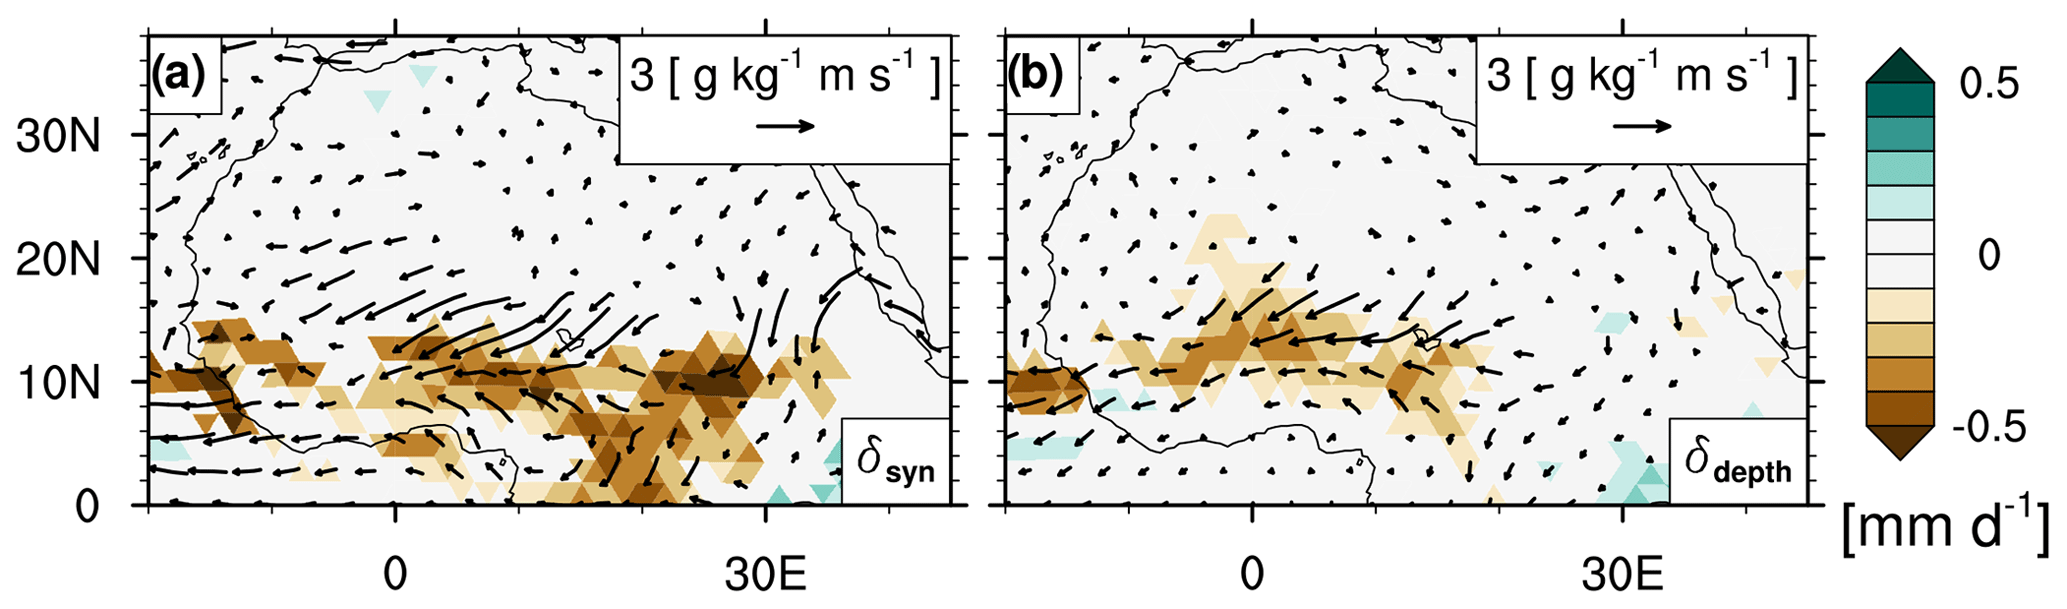
Figure 9Simulated mid-Holocene moisture flux response (arrows) and precipitation response (coloured shading) at 925 hPa to (a) the synergistic effect of lakes and vegetation (mHdVdL + mH − mHdV − mHdL) and (b) a decrease in the depth of Lake Chad (mH − mHL10) during the summer months (JJAS). The continuous colour shading indicates the significant changes in precipitation according to a two-sided bootstrapping test at significance levels of 0.05 and 0.95.
In addition, changes in the meridional surface-temperature gradient lead to a near-surface divergence to the south of Lake Chad at about 5° N (Fig. 8b). This near-surface divergence reduces moist convection in the lower troposphere, which dampens the rain-generating deep convection aloft in the middle to upper troposphere at about 5° N and weakens the subsequent flow of the westerly monsoon winds (arrows in Fig. 8b). This reduction in deep convection additionally decreases the precipitation over tropical Africa. However, the main reason for the rainfall decrease in the Sahel is the acceleration of the easterly winds above Megalake Chad (Fig. 9a).
Our simulations show that the acceleration of the easterly winds weakens the westerly monsoon winds not only locally but also in the upstream region to the west of Megalake Chad. Accordingly, the inland moisture flux decreases in these regions, leading to a reduction in rain-producing deep convection (arrows in Fig. 9a). The decrease in the near-surface inland moisture flux leads to a drying response across the entire Sahel along 12° N (brown shading in Fig. 9a).
An additional, idealized mid-Holocene experiment shows a similar drying response across the Sahel when the depth of Lake Chad is reduced by about 1–5 m from 10 m (mHL10 simulation) to 5–9 m (mH simulation) (Figs. 9b and A2b). The extent and the albedo of Lake Chad in the mHL10 and mH simulations are kept constant at pre-industrial values. In the mHL10 simulation, 10 m is the standard lake depth value in the JSBACH4 land model. In the mH simulation, the lake depth simulated by the DEL model for pre-industrial conditions is used to prescribe the water depth for the grid boxes of Lake Chad. The lake depth ranges between 5–9 m. Since the lake depth in both experiments is kept constant throughout the simulations, the results only show the effect of the constant differences in lake depth on the climate. A decrease in lake depth by about 1–5 m leads to a significant drying response (Fig. 9b), which becomes evident when averaged over 150 years, meaning that the comparatively strong variability in monsoon precipitation no longer overshadows the actual drying response (Fig. A4b). By reducing the depth of Lake Chad, the heat storage capacity of the lake decreases, which leads to faster warming of Lake Chad in the summer months (Fig. 8f). This warming response again changes the meridional surface-temperature gradient and, thus, the precipitation response at the latitude of Lake Chad.
In the mid-Holocene experiments (δdepth), the changes in the meridional surface-temperature gradient induce an overturning circulation response similar to the one caused by the synergistic effect of lakes and vegetation (δsyn) (Fig. 8b and e). This circulation response includes a near-surface easterly wind acceleration above Lake Chad (Fig. 8d) that decreases inland moisture transport and, thus, rainfall at around 12° N (Fig. 9b). Additionally, the circulation response includes a dipole-like zonal wind response in the middle troposphere above Lake Chad that corresponds to a southward shift in the African easterly jet (Fig. 8d) and, thus, a southward shift in the rain belt's northern boundary. Despite the similarities between δdepth and δsyn, small differences exist regarding the response amplitude and the latitudinal position of the maximum easterly wind acceleration as well as with respect to the latitudinal position of the dipole-like zonal wind response in the middle troposphere.
The area of the mid-Holocene Megalake Chad is much larger than that of the pre-industrial Lake Chad. However, the simulated Megalake Chad is rather shallow, with a depth of about 5–8 m in its southern basin around 12° N (Fig. A2a). A comparison between the mHdVdL and mHdV simulations shows that this shallow southward extension of Megalake Chad causes a local warming response, which means that the simulated mid-Holocene vegetation cools the land surface more strongly than the simulated Megalake Chad at its southern boundary (dashed line in Fig. 8d). This warming response is particularly strong where the extent of Megalake Chad is shallowest (Figs. A2a and A3a). Additionally, the expansion of Lake Chad reduces the local surface albedo by about 0.02 to 0.04 compared to the vegetated land (Fig. A3b), which increases surface energy absorption and, thus, contributes to the warming response in the southern basin of Megalake Chad.
The warming response to the shallow extent of Megalake Chad contributes considerably to the total warming response caused by the synergistic effect of lakes and vegetation at around 12° N (dashed and solid lines in Fig. 8d). In contrast to the simulated mid-Holocene extent of Lake Chad in a desert landscape, which causes local surface cooling and a precipitation increase (Fig. 6c), the mid-Holocene extent of Lake Chad in a simulation of a vegetated northern Africa causes surface warming and, therefore, a drying response (Fig. 8c).
Our results show that the DEL model realistically simulates the pre-industrial extent of Lake Chad and the presence of some dry basins over northern Africa. Only the extent of the Ahnet and Chotts lakes, which receive most of their discharge from the Atlas Mountains, is overestimated by about 1512 and 2004 km2, respectively. The overestimated lake extent of both lakes is likely caused by the coarse resolution of the simulation. The coarse resolution limits the accurate representation of the catchment boundaries as well as the accurate representation of small-scale heterogeneous precipitation from orographic updrafts, which occur in the Atlas Mountains.
Additionally, the DEL model only mimics the effect of an aquifer reservoir to avoid unrealistically high inter-annual fluctuations in lake depth and lake extent. In the HD model, however, a comprehensive aquifer model that interacts with the overlying dynamic lakes is missing. Reconstructions show that aquifers across northern Africa filled up during the early Holocene until the water table reached the overlying lake basins, leading to the formation of larger lakes (Lézine et al., 2011b). As precipitation over northern Africa decreased towards the end of the African Humid Period, the lake basins continued to be fed by the aquifers (Lézine et al., 2011b). Therefore, the expansion and regression of the lakes occurred with a delay of about 3000 years compared to the orbital-forced summer insolation changes (Lézine et al., 2011b). Since this lake–aquifer interaction is missing from the HD–DEL model, the DEL model is presumably not suitable for transient simulations.
The simulated area of the mid-Holocene Lake Chad, at 67 480 km2, is strongly underestimated compared to reconstructions, which yield an estimate of about 350 000 km2 (Hoelzmann et al., 1998; Quade et al., 2018; Drake et al., 2022). Comparing reconstructions with simulated lakes in the western Sahara is difficult because lake reconstructions for this region are subject to large uncertainties (Drake et al., 2022). Simulated lakes in the western Sahara are presumably also underestimated by the ICON-JSBACH4 model. The underestimated lake extent is likely related to the known dry bias across northern Africa simulated by the ICON-ESM (Schneck et al., 2022). Climate models that produce a more humid mid-Holocene climate across northern Africa, such as the MPI-ESM (e.g. Dallmeyer et al., 2021), potentially simulate much larger vegetation and lake extents across northern Africa. Even though the lake extent and vegetation extent in our mid-Holocene simulations are underestimated, the simulations provide interesting insights into the factors influencing the interaction between climate, lakes, and vegetation across northern Africa during the mid-Holocene.
The factor analysis indicates that the meridional surface-temperature gradient between the dynamic lakes and dynamic vegetation sensitively influences mid-Holocene precipitation over northern Africa and, therefore, plays a major role in the interaction between the West African summer monsoon, lakes, and vegetation during the mid-Holocene. For example, the simulated mid-Holocene extent of vegetation in the Sahel cools the land surface more strongly than the simulated mid-Holocene extent of Lake Chad. Accordingly, the mid-Holocene extent of Lake Chad in a simulation of a densely vegetated Sahel leads to local surface warming. The resulting local changes in the meridional surface-temperature gradient induce an overturning circulation response in the lower troposphere that decreases inland moisture transport from the tropical Atlantic into the African continent, resulting in a drying response across the entire Sahel. This drying response is an unexpected result since previous simulation studies have shown a general precipitation increase in response to the mid-Holocene extent of Lake Chad prescribed from reconstructions (Coe and Bonan, 1997; Broström et al., 1998; Carrington et al., 2001; Krinner et al., 2012; Chandan and Peltier, 2020; Specht et al., 2022; Li et al., 2023). This precipitation increase also occurs in the study by Specht et al. (2022), in which the same climate model, ICON-JSBACH4, is used. Specht et al. (2022), however, prescribe a constant lake depth of 10 m, which is the standard lake depth of the ICON-JSBACH4 model. In our study, the lake depth is treated dynamically and depends on the local water budget.
Idealized mid-Holocene simulations show that the simulated lake depth sensitively influences the surface temperature of the dynamic lakes and, thus, the local meridional surface-temperature gradient between the lakes and their vicinity. For example, our results show that decreasing the depth of Lake Chad, without changing its spatial extent, induces a local warming response over Lake Chad. By reducing the depth of Lake Chad by about 1–5 m, the heat storage capacity of the lake decreases, which leads to a faster warming of the lake during the summer months. The resulting local surface warming causes a circulation and drying response that is similar to that caused by the mid-Holocene extent of Lake Chad in a simulation of a densely vegetated Sahel. Based on these results, we conclude that a proper representation of lake parameters, such as lake depth, is important to properly simulate the surface temperature of lakes across northern Africa and to investigate the effect of these lakes on mid-Holocene monsoon precipitation.
Unfortunately, previous mid-Holocene simulation studies offer only limited information on how lakes are represented in terms of lake depth or lake surface albedo in the utilized climate models (Coe and Bonan, 1997; Broström et al., 1998; Carrington et al., 2001; Krinner et al., 2012; Chandan and Peltier, 2020; Li et al., 2023). These simulation studies likely neglect the effect of mid-Holocene lake depth changes on monsoon precipitation because they use lake reconstructions that rarely provide information about lake depth (e.g. Hoelzmann et al., 1998). The differences in lake representation between different climate models might be the reason why, in some models, a prescribed mid-Holocene lake extent only causes a local and marginal precipitation increase (Coe and Bonan, 1997; Broström et al., 1998; Chandan and Peltier, 2020), whereas the same lake extent causes a substantial precipitation increase across northern Africa in other models (Krinner et al., 2012; Specht et al., 2022; Li et al., 2023). In our study, lakes are treated as a pure mixed layer with a dynamic depth and a constant surface albedo of 0.07. A more realistic lake surface temperature might be simulated by considering the existence of a lake thermocline and a dynamic lake albedo. For example, the albedo of lakes with a depth exceeding 3 m might vary from 0.05 to 0.1 (Cogley, 1979), whereas the albedo of smaller water bodies with a depth of 1–3 m might vary from 0.09 to 0.22 (de Fleury et al., 2023) within the Sahelian–Saharan region (12–35° N).
Our results suggest that the mid-Holocene lake extent only causes a local positive vegetation feedback across northern Africa. In our simulations, however, the extent and depth of the mid-Holocene lakes are underestimated compared to reconstructions (Hoelzmann et al., 1998; Quade et al., 2018; Drake et al., 2022). Since the depth of the lakes is likely underestimated, the surface cooling caused by the simulated mid-Holocene lakes is likely underestimated as well. A larger lake extent and a greater depth across northern Africa might cause a positive vegetation feedback if these simulated lakes cool the land surface more strongly than the simulated vegetation of the surrounding land. Thus, rather than showing the most realistic mid-Holocene precipitation increase due to the simulated extent of dynamic lakes and dynamic vegetation, our study provides insights into the factors influencing the dynamic interaction between climate, lakes, and vegetation across northern Africa.
Additionally, in our study, we neglect the existence of wetlands as well as the effects of exorheic lakes, such as Megalake Timbuktu in the Niger Inner Delta (Drake et al., 2022). Wetlands might cause relatively high evaporation and surface cooling as this land surface type combines the high surface roughness of the vegetation with the moisture-saturated surface of the lakes (Specht et al., 2022). Strong surface cooling due to the extent of the wetlands potentially occurred in the vicinity of Megalake Chad (Hoelzmann et al., 1998) and in the western Sahel and Sahara (Chen et al., 2021). To gain a more comprehensive understanding of the effects of dynamic wetlands, more research is needed.
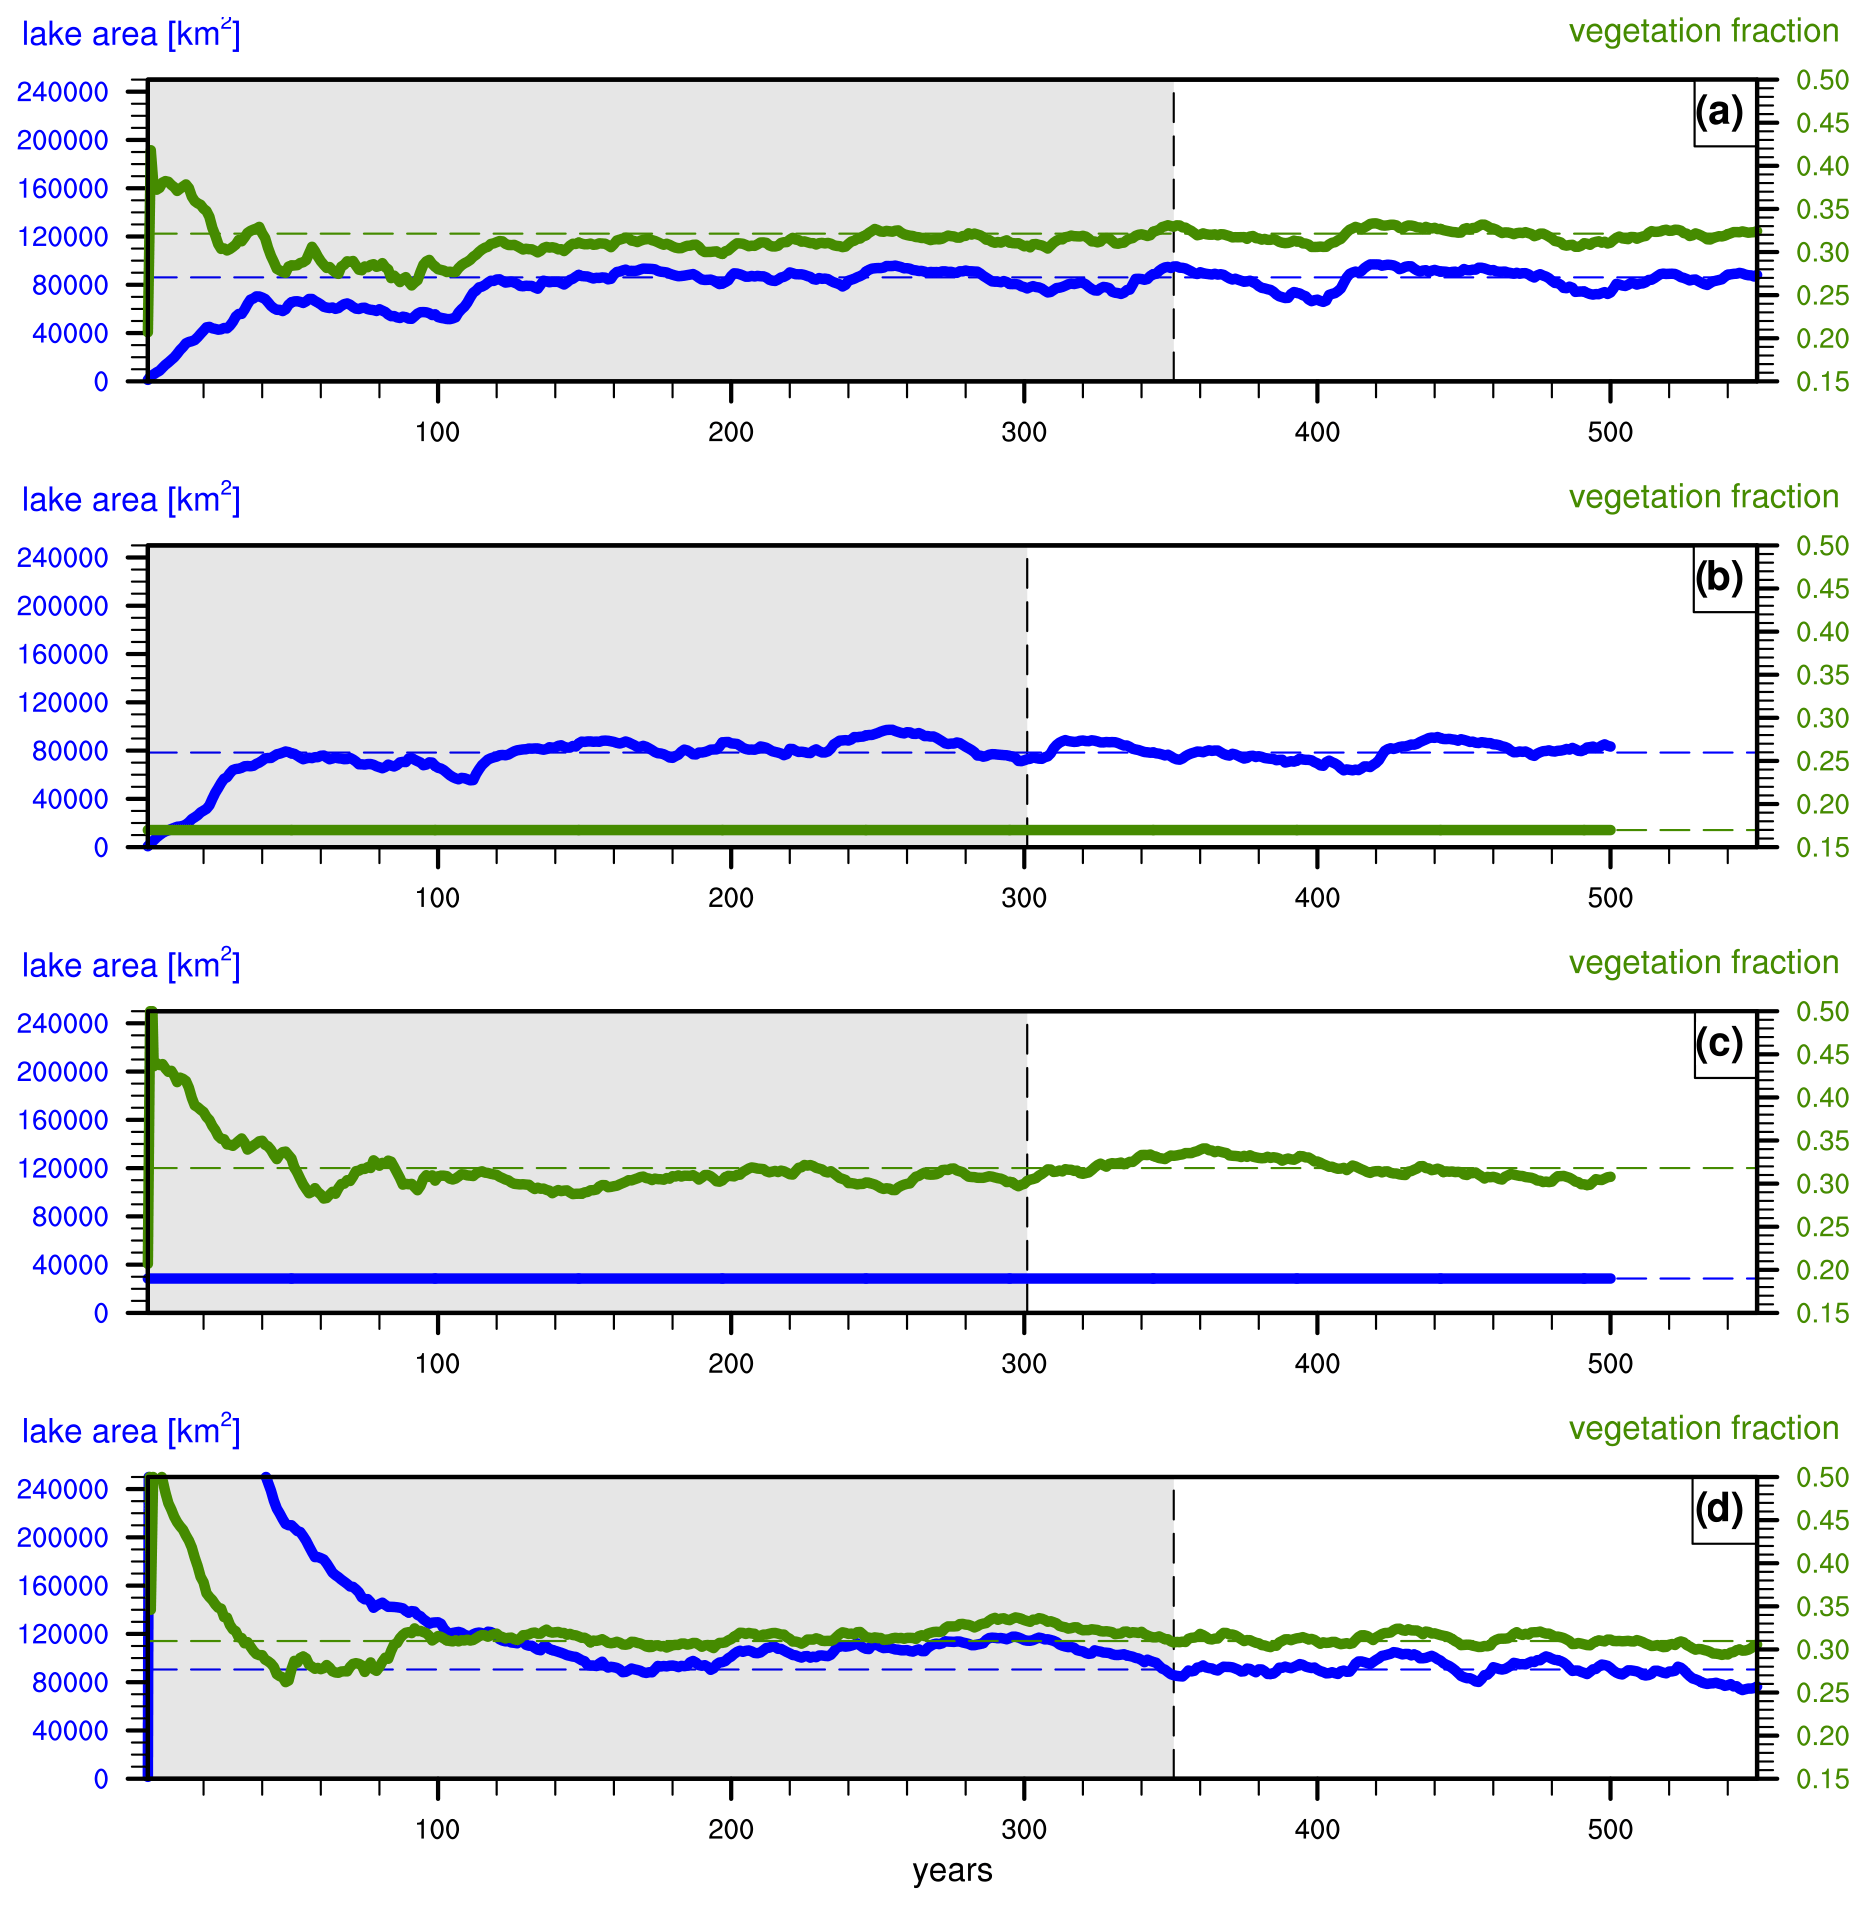
Figure A1Time series illustrating the simulated mid-Holocene lake extent (blue) and vegetation extent (green) for the (a) mHdVdL, (b) mHdL, (c) mHdV, and (d) mHdVdLmax simulations. The blue line denotes the lake area within the endorheic catchments of North Africa, and the green line denotes the vegetation cover averaged across the Sahel and Sahara (10–35° N, 20° E–35° W). The time series section with the white background indicates the evaluation period used for the analysis. Depending on the variability in the lake area and vegetation cover, the evaluation period is either 150 or 200 years long.
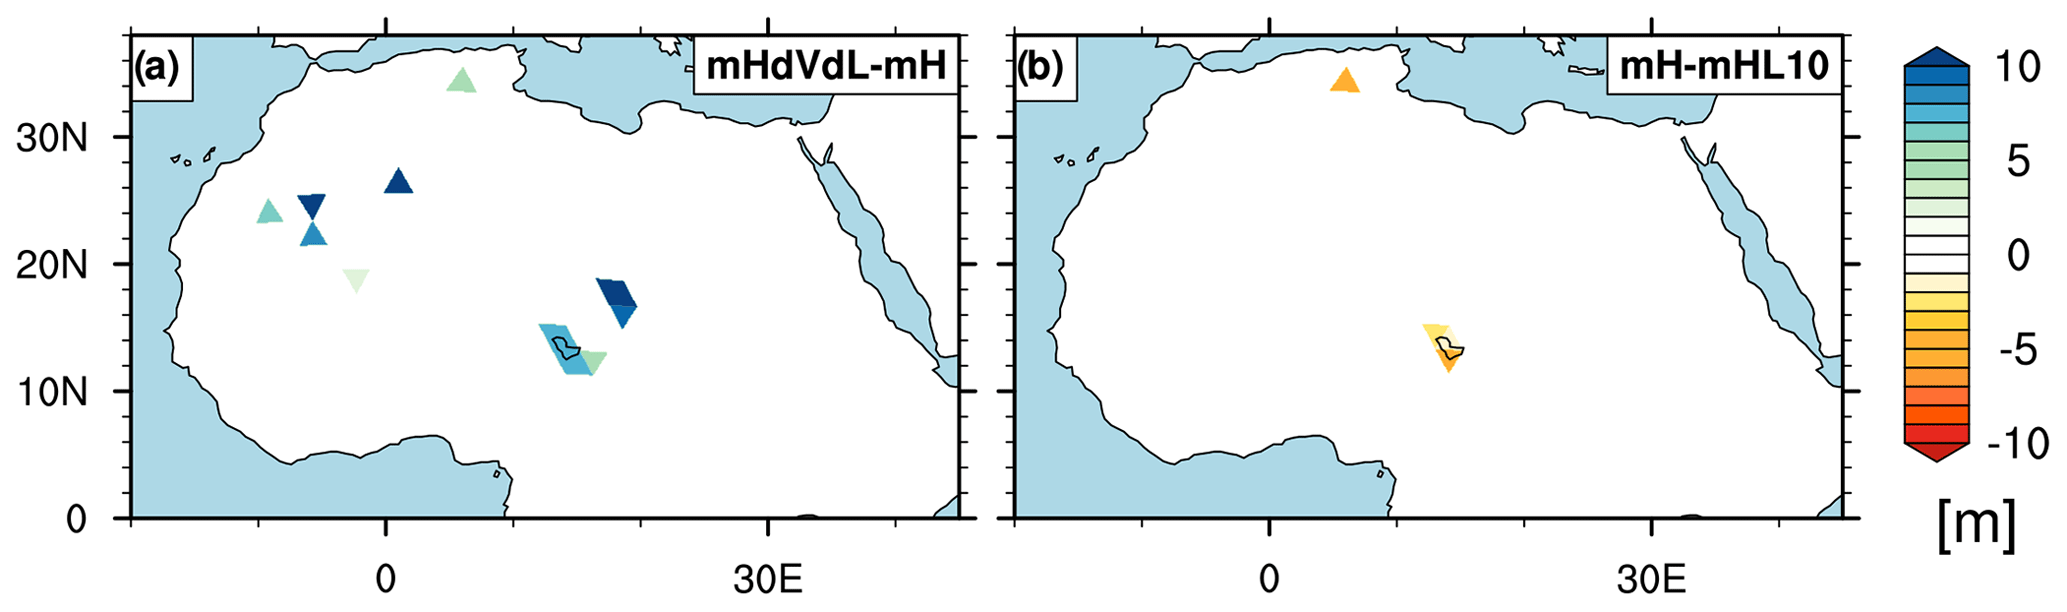
Figure A2Differences in lake depth between (a) the simulated mid-Holocene and pre-industrial lakes (mHdVdL − mH) and (b) the simulated pre-industrial lakes and the prescribed standard lakes with a constant 10 m lake depth (mH − mHL10).
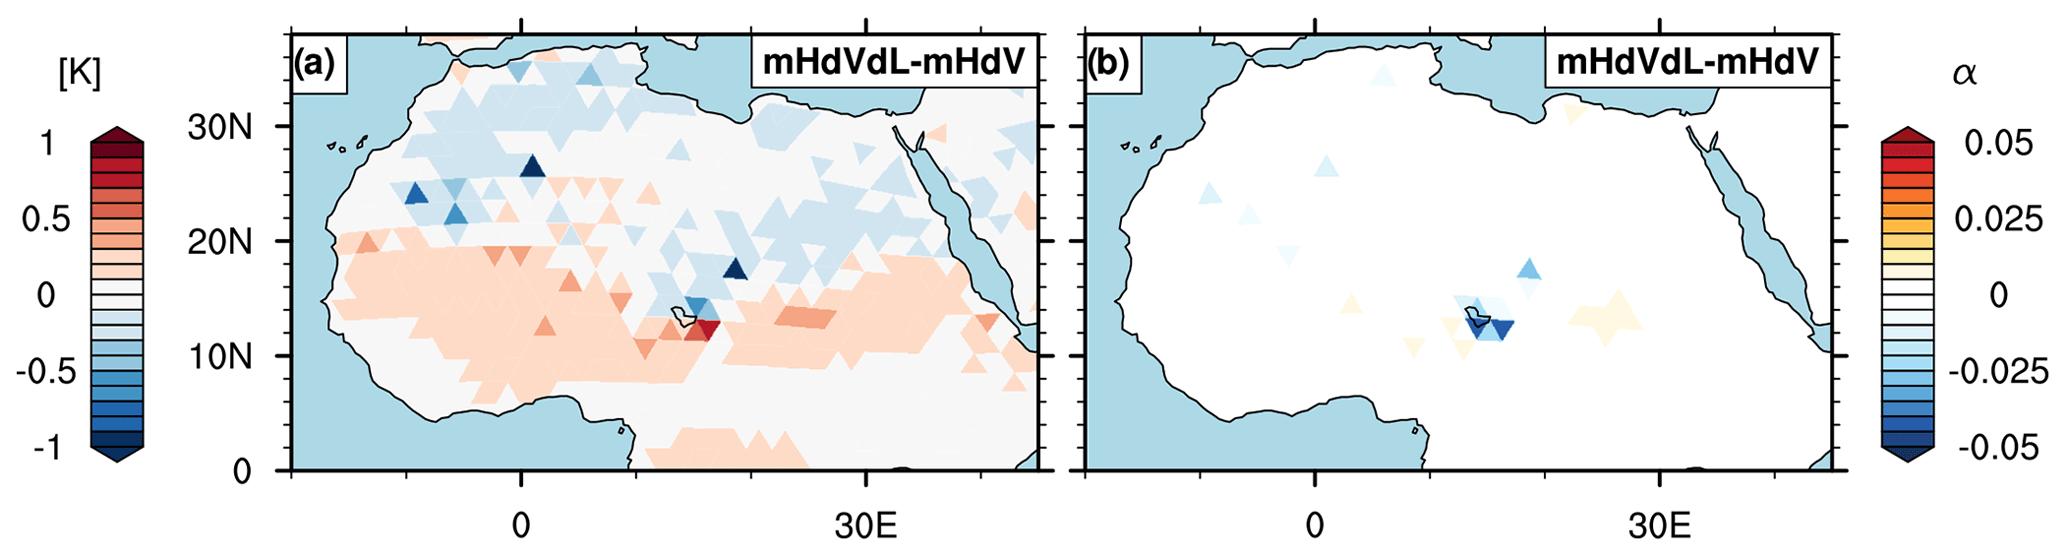
Figure A3Simulated changes in mid-Holocene summer (JJAS) (a) surface temperature and (b) albedo resulting from the extent of the lakes within a simulation of a vegetated Sahel and Sahara (mHdVdL − mHdV).
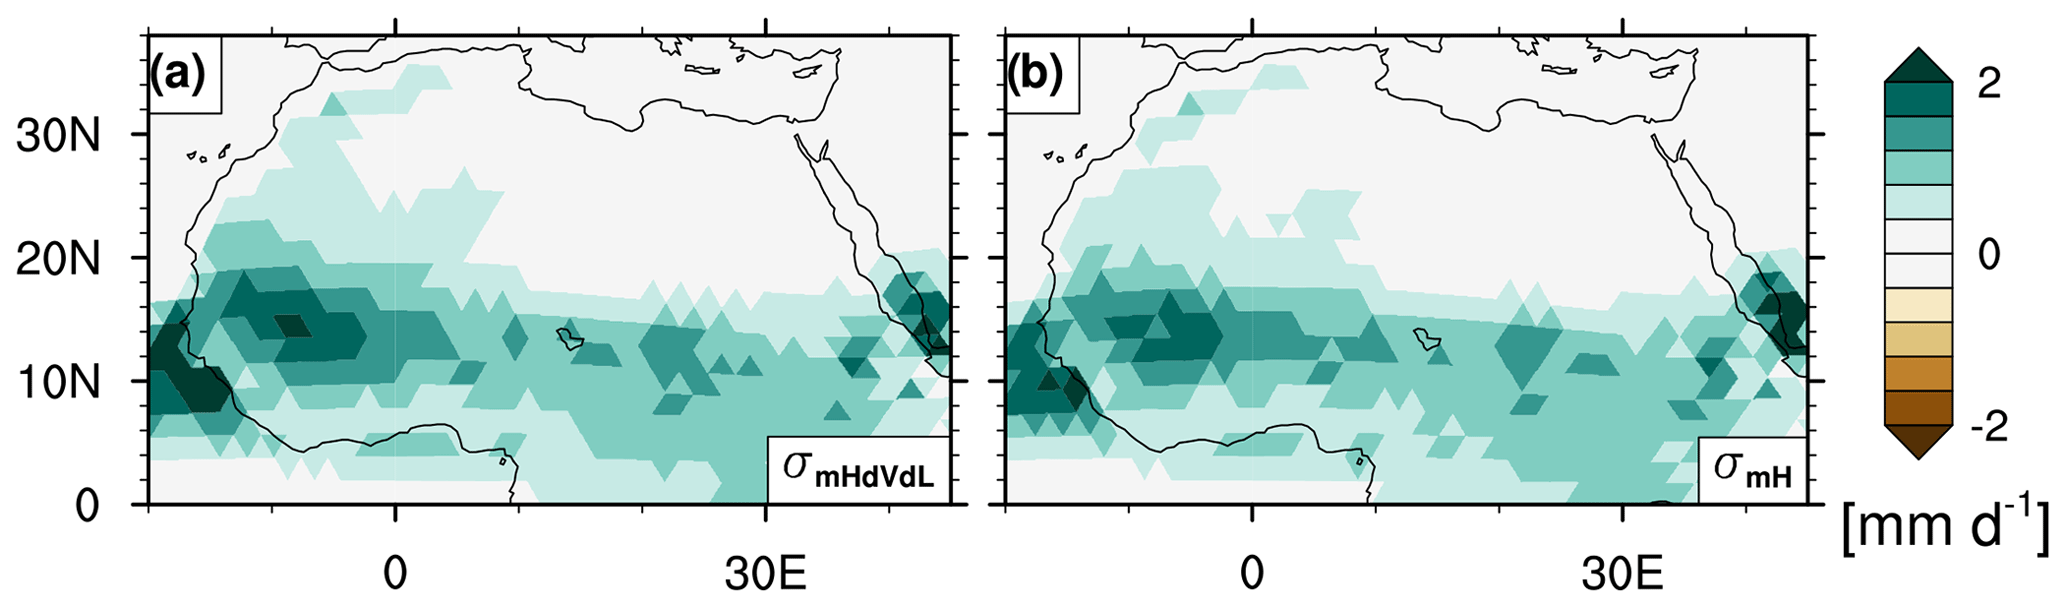
Figure A4Standard deviation of the simulated mid-Holocene precipitation for (a) the mHdVdL simulation and (b) the mH simulation during the summer months (JJAS).
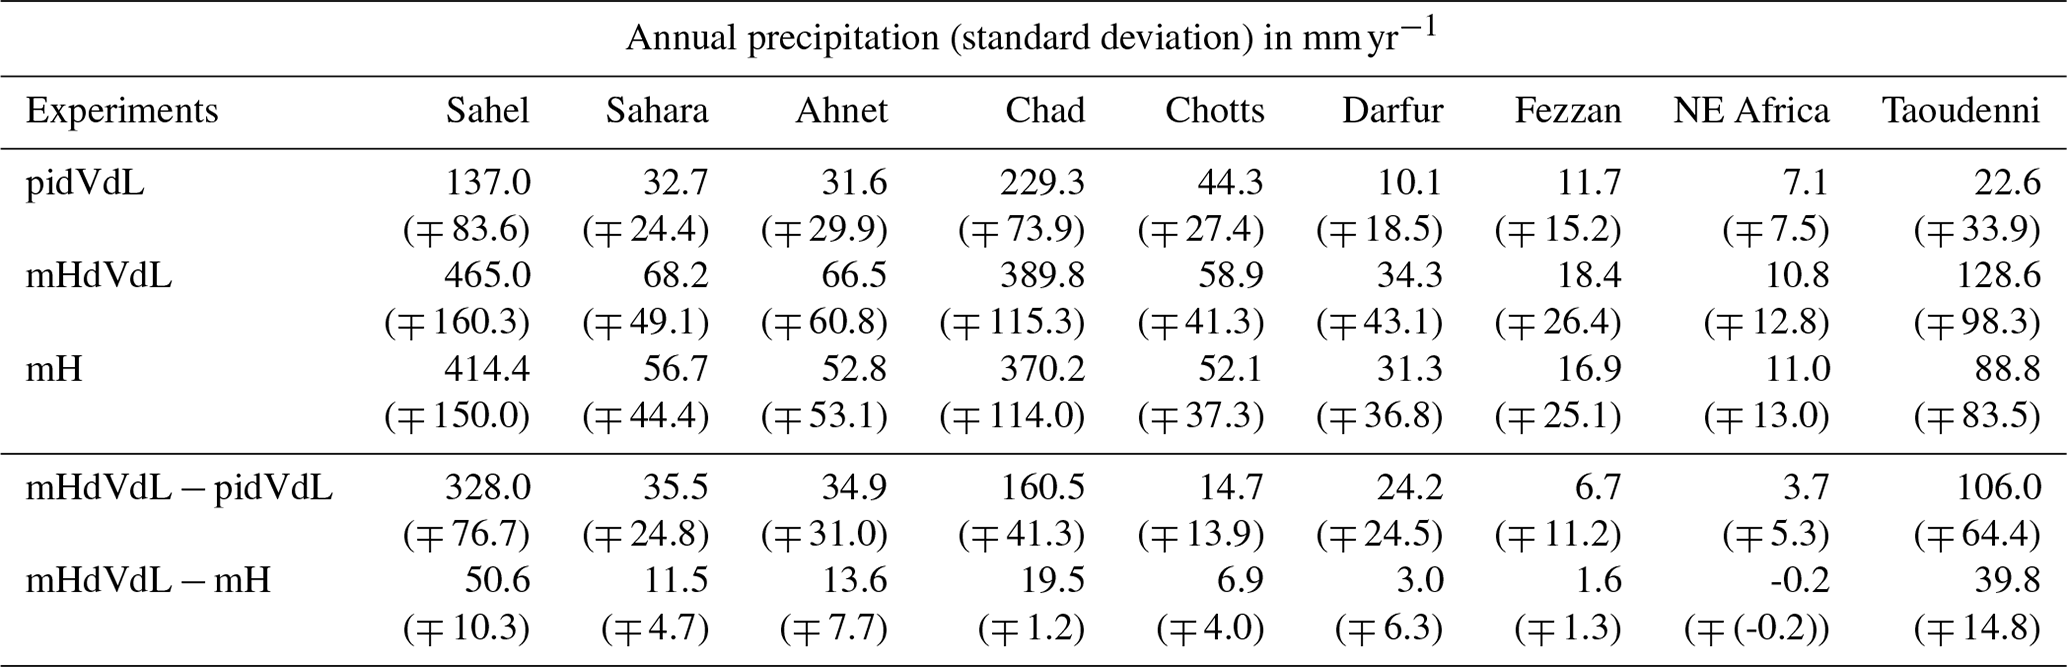
Table A1The simulated mean annual precipitation and standard deviation of the annual precipitation averaged across the Sahel (12–18° N, 20° E–35° W), the Sahara (18–35° N, 20° E–35° W), and the individual catchments over the last 150 years (pidVdL simulation), 200 years (mHdVdL simulation), and 150 years (mH simulation).
A summary of the ICON-A JSBACH4 model version, the scripts for generating the boundary conditions, the run scripts, and the output data used to generate the figures shown in this study are available at https://hdl.handle.net/21.11116/0000-000E-400F-A (MPG, 2024).
NFS and MC planned the study. NFS constructed and implemented the DEL model, ran the simulations, and analysed the results. MC and TK contributed to the discussion of the results and the paper.
At least one of the (co-)authors is a member of the editorial board of Climate of the Past. The peer-review process was guided by an independent editor, and the authors also have no other competing interests to declare.
Publisher's note: Copernicus Publications remains neutral with regard to jurisdictional claims made in the text, published maps, institutional affiliations, or any other geographical representation in this paper. While Copernicus Publications makes every effort to include appropriate place names, the final responsibility lies with the authors.
This study contributes to the Cluster of Excellence “Climate, Climatic Change, and Society” (CLICCS). The model simulations were performed at the German Climate Computing Centre (DKRZ). Many thanks go to Reiner Schnur (MPI-M), Veronika Gayler (MPI-M), Tobias Stacke (MPI-M), and Thomas Riddick (MPI-M) for their excellent technical support and discussion.
Thomas Kleinen is funded by the PalMod project of the German Federal Ministry of Education and Research (BMBF) through the Research for Sustainability (FONA) initiative (grant no. 01LP1921A). Nora Farina Specht is financed by the International Max Planck Research School on Earth System Modelling (IMPRS-ESM), Hamburg.
The article processing charges for this open-access publication were covered by the Max Planck Society.
This paper was edited by Christo Buizert and reviewed by Stefan Hagemann and Shivangi Tiwari.
Bader, J., Jungclaus, J., Krivova, N., Lorenz, S., Maycock, A., Raddatz, T., Schmidt, H., Toohey, M., Wu, C.-J., and Claussen, M.: Global temperature modes shed light on the Holocene temperature conundrum, Nat. Commun., 11, 4726, https://doi.org/10.1038/s41467-020-18478-6, 2020. a
Bartlein, P. J., Harrison, S. P., Brewer, S., Connor, S., Davis, B. A. S., Gajewski, K., Guiot, J., Harrison-Prentice, T. I., Henderson, A., Peyron, O., Prentice, I. C., Scholze, M., Seppä, H., Shuman, B., Sugita, S., Thompson, R. S., Viau, A. E., Williams, J., and Wu, H.: Pollen-based continental climate reconstructions at 6 and 21 ka: a global synthesis, Clim. Dynam., 37, 775–802, https://doi.org/10.1007/s00382-010-0904-1, 2011. a
Berger, A.: Long-term variations of caloric insolation resulting from the earth's orbital elements, Quaternary Res., 9, 139–167, https://doi.org/10.1016/0033-5894(78)90064-9, 1978. a
Bouchez, C., Goncalves, J., Deschamps, P., Vallet-Coulomb, C., Hamelin, B., Doumnang, J.-C., and Sylvestre, F.: Hydrological, chemical, and isotopic budgets of Lake Chad: a quantitative assessment of evaporation, transpiration and infiltration fluxes, Hydrol. Earth Syst. Sci., 20, 1599–1619, https://doi.org/10.5194/hess-20-1599-2016, 2016. a, b, c
Braconnot, P., Harrison, S. P., Kageyama, M., Bartlein, P. J., Masson-Delmotte, V., Abe-Ouchi, A., Otto-Bliesner, B., and Zhao, Y.: Evaluation of climate models using palaeoclimatic data, Nat. Clim. Change, 2, 417–424, https://doi.org/10.1038/nclimate1456, 2012. a, b
Brierley, C. M., Zhao, A., Harrison, S. P., Braconnot, P., Williams, C. J. R., Thornalley, D. J. R., Shi, X., Peterschmitt, J.-Y., Ohgaito, R., Kaufman, D. S., Kageyama, M., Hargreaves, J. C., Erb, M. P., Emile-Geay, J., D'Agostino, R., Chandan, D., Carré, M., Bartlein, P. J., Zheng, W., Zhang, Z., Zhang, Q., Yang, H., Volodin, E. M., Tomas, R. A., Routson, C., Peltier, W. R., Otto-Bliesner, B., Morozova, P. A., McKay, N. P., Lohmann, G., Legrande, A. N., Guo, C., Cao, J., Brady, E., Annan, J. D., and Abe-Ouchi, A.: Large-scale features and evaluation of the PMIP4-CMIP6 midHolocene simulations, Clim. Past, 16, 1847–1872, https://doi.org/10.5194/cp-16-1847-2020, 2020. a, b
Broström, A., Coe, M., Harrison, S. P., Gallimore, R., Kutzbach, J. E., Foley, J., Prentice, I. C., and Behling, P.: Land surface feedbacks and palaeomonsoons in northern Africa, Geophys. Res. Lett., 25, 3615–3618, https://doi.org/10.1029/98GL02804, 1998. a, b, c, d, e, f, g, h, i, j
Brovkin, V., Lorenz, S., Raddatz, T., Ilyina, T., Stemmler, I., Toohey, M., and Claussen, M.: What was the source of the atmospheric CO2 increase during the Holocene?, Biogeosciences, 16, 2543–2555, https://doi.org/10.5194/bg-16-2543-2019, 2019. a
Carrington, D. P., Gallimore, R. G., and Kutzbach, J. E.: Climate sensitivity to wetlands and wetland vegetation in mid-Holocene North Africa, Clim. Dynam., 17, 151–157, https://doi.org/10.1007/s003820000099, 2001. a, b, c
Chandan, D. and Peltier, W. R.: African Humid Period Precipitation Sustained by Robust Vegetation, Soil, and Lake Feedbacks, Geophys. Res. Lett., 47, 4726, https://doi.org/10.1029/2020GL088728, 2020. a, b, c, d, e, f, g, h, i
Chen, W., Ciais, P., Qiu, C., Ducharne, A., Zhu, D., Peng, S., Braconnot, P., and Huang, C.: Wetlands of North Africa During the Mid-Holocene Were at Least Five Times the Area Today, Geophys. Res. Lett., 48, e2021GL094194, https://doi.org/10.1029/2021GL094194, 2021. a, b
Coe, M. T.: Simulating Continental Surface Waters: An Application to Holocene Northern Africa, J. Climate, 10, 1680–1689, https://doi.org/10.1175/1520-0442(1997)010<1680:SCSWAA>2.0.CO;2, 1997. a
Coe, M. T. and Bonan, G. B.: Feedbacks between climate and surface water in northern Africa during the middle Holocene, J. Geophys. Res.-Atmos., 102, 11087–11101, https://doi.org/10.1029/97JD00343, 1997. a, b, c, d, e, f, g, h
Cogley, J. G.: The Albedo of Water as a Function of Latitude, Mon. Weather Rev., 107, 775–781, https://doi.org/10.1175/1520-0493(1979)107<0775:TAOWAA>2.0.CO;2, 1979. a
Coque, R.: La Tunisie présaharienne: étude géomorphologique, Armand Colin, google-Books-ID: M0EKAAAAMAAJ, 1962. a
Dallmeyer, A., Claussen, M., Lorenz, S. J., Sigl, M., Toohey, M., and Herzschuh, U.: Holocene vegetation transitions and their climatic drivers in MPI-ESM1.2, Clim. Past, 17, 2481–2513, https://doi.org/10.5194/cp-17-2481-2021, 2021. a, b
de Fleury, M., Kergoat, L., and Grippa, M.: Hydrological regime of Sahelian small waterbodies from combined Sentinel-2 MSI and Sentinel-3 Synthetic Aperture Radar Altimeter data, Hydrol. Earth Syst. Sci., 27, 2189–2204, https://doi.org/10.5194/hess-27-2189-2023, 2023. a
Drake, N. A., Lem, R. E., Armitage, S. J., Breeze, P., Francke, J., El-Hawat, A. S., Salem, M. J., Hounslow, M. W., and White, K.: Reconstructing palaeoclimate and hydrological fluctuations in the Fezzan Basin (southern Libya) since 130 ka: A catchment-based approach, Quaternary Sci. Rev., 200, 376–394, https://doi.org/10.1016/j.quascirev.2018.09.042, 2018. a
Drake, N. A., Candy, I., Breeze, P., Armitage, S. J., Gasmi, N., Schwenninger, J. L., Peat, D., and Manning, K.: Sedimentary and geomorphic evidence of Saharan megalakes: A synthesis, Quaternary Sci. Rev., 276, 107318, https://doi.org/10.1016/j.quascirev.2021.107318, 2022. a, b, c, d, e, f, g, h, i, j, k
Durack, P. J., Taylor, K. E., Ames, S., Po-Chedley, S., and Mauzey, C.: PCMDI AMIP SST and sea-ice boundary conditions version 1.1.7, Earth System Grid Federation, https://doi.org/10.22033/ESGF/input4MIPs.16485, 2022. a
Enzel, Y., Quade, J., and Kushnir, Y.: Response to Engel et al. (in press): Lakes or wetlands? A comment on “The middle Holocene climatic records from Arabia: Reassessing lacustrine environments, shift of ITCZ in Arabian Sea, and impacts of the southwest Indian and African monsoons” by Enzel et al. (2015), Global Planet. Change, 148, 268–271, https://doi.org/10.1016/j.gloplacha.2016.11.003, 2017. a
Giorgetta, M. A., Brokopf, R., Crueger, T., Esch, M., Fiedler, S., Helmert, J., Hohenegger, C., Kornblueh, L., Köhler, M., Manzini, E., Mauritsen, T., Nam, C., Raddatz, T., Rast, S., Reinert, D., Sakradzija, M., Schmidt, H., Schneck, R., Schnur, R., Silvers, L., Wan, H., Zängl, G., and Stevens, B.: ICON-A, the Atmosphere Component of the ICON Earth System Model: I. Model Description, J. Adv. Model. Earth Sy., 10, 1613–1637, https://doi.org/10.1029/2017MS001242, _eprint: https://onlinelibrary.wiley.com/doi/pdf/10.1029/2017MS001242, 2018. a
Hagemann, S. and Duemenil, L.: Documentation for the hydrological discharge model, Technical Report No. 17, Max Planck Institute for Meteorology, Hamburg, Germany, https://www.osti.gov/etdeweb/biblio/310974 (last access: 29 September 2022), 1998. a, b
Hagemann, S. and Dümenil, L.: A parametrization of the lateral waterflow for the global scale, Clim. Dynam., 14, 17–31, https://doi.org/10.1007/s003820050205, 1997. a
Hagemann, S. and Gates, L. D.: Validation of the hydrological cycle of ECMWF and NCEP reanalyses using the MPI hydrological discharge model, J. Geophys. Res.-Atmos., 106, 1503–1510, https://doi.org/10.1029/2000JD900568, 2001. a
Hély, C., Lézine, A.-M., and contributors, A.: Holocene changes in African vegetation: tradeoff between climate and water availability, Clim. Past, 10, 681–686, https://doi.org/10.5194/cp-10-681-2014, 2014. a, b, c, d
Hoelzmann, P., Jolly, D., Harrison, S. P., Laarif, F., Bonnefille, R., and Pachur, H.-J.: Mid-Holocene land-surface conditions in northern Africa and the Arabian Peninsula: A data set for the analysis of biogeophysical feedbacks in the climate system, Global Biogeochem. Cy., 12, 35–51, https://doi.org/10.1029/97GB02733, 1998. a, b, c, d, e, f, g, h, i
Holmes, J. and Hoelzmann, P.: The Late Pleistocene–Holocene African Humid Period as Evident in Lakes, Oxford Research Encyclopedia of Climate Science, Oxford University Press, Oxford, UK, https://doi.org/10.1093/acrefore/9780190228620.013.531, 2017. a, b
Jungclaus, J., Mikolajewicz, U., Kapsch, M.-L., D'Agostino, R., Wieners, K.-H., Giorgetta, M., Reick, C., Esch, M., Bittner, M., Legutke, S., Schupfner, M., Wachsmann, F., Gayler, V., Haak, H., de Vrese, P., Raddatz, T., Mauritsen, T., von Storch, J.-S., Behrens, J., Brovkin, V., Claussen, M., Crueger, T., Fast, I., Fiedler, S., Hagemann, S., Hohenegger, C., Jahns, T., Kloster, S., Kinne, S., Lasslop, G., Kornblueh, L., Marotzke, J., Matei, D., Meraner, K., Modali, K., Müller, W., Nabel, J., Notz, D., Peters-von Gehlen, K., Pincus, R., Pohlmann, H., Pongratz, J., Rast, S., Schmidt, H., Schnur, R., Schulzweida, U., Six, K., Stevens, B., Voigt, A., and Roeckner, E.: MPI-M MPI-ESM1.2-LR model output prepared for CMIP6 PMIP midHolocene, Earth System Grid Federation, https://doi.org/10.22033/ESGF/CMIP6.6644, 2019. a
Jungclaus, J. H., Fischer, N., Haak, H., Lohmann, K., Marotzke, J., Matei, D., Mikolajewicz, U., Notz, D., and von Storch, J. S.: Characteristics of the ocean simulations in the Max Planck Institute Ocean Model (MPIOM) the ocean component of the MPI-Earth system model, J. Adv. Model. Earth Sy., 5, 422–446, https://doi.org/10.1002/jame.20023, 2013. a
Jungclaus, J. H., Lorenz, S. J., Schmidt, H., Brovkin, V., Brüggemann, N., Chegini, F., Crüger, T., De-Vrese, P., Gayler, V., Giorgetta, M. A., Gutjahr, O., Haak, H., Hagemann, S., Hanke, M., Ilyina, T., Korn, P., Kröger, J., Linardakis, L., Mehlmann, C., Mikolajewicz, U., Müller, W. A., Nabel, J. E. M. S., Notz, D., Pohlmann, H., Putrasahan, D. A., Raddatz, T., Ramme, L., Redler, R., Reick, C. H., Riddick, T., Sam, T., Schneck, R., Schnur, R., Schupfner, M., von Storch, J.-S., Wachsmann, F., Wieners, K.-H., Ziemen, F., Stevens, B., Marotzke, J., and Claussen, M.: The ICON Earth System Model Version 1.0, J. Adv. Model. Earth Syst., 14, e2021MS002813, https://doi.org/10.1029/2021MS002813, 2022. a
Kang, I. S., Park, J. I., and Singh, V. P.: Effect of urbanization on runoff characteristics of the On-Cheon Stream watershed in Pusan, Korea, Hydrol. Process., 12, 351–363, https://doi.org/10.1002/(SICI)1099-1085(199802)12:2<351::AID-HYP569>3.0.CO;2-O, 1998. a
Krinner, G., Lézine, A.-M., Braconnot, P., Sepulchre, P., Ramstein, G., Grenier, C., and Gouttevin, I.: A reassessment of lake and wetland feedbacks on the North African Holocene climate, Geophys. Res. Lett., 39, L07701, https://doi.org/10.1029/2012GL050992, 2012. a, b, c, d, e, f, g, h, i, j, k
Lehner, B. and Grill, G.: Global river hydrography and network routing: baseline data and new approaches to study the world's large river systems, Hydrol. Process., 27, 2171–2186, https://doi.org/10.1002/hyp.9740, 2013. a, b
Lézine, A.-M.: Vegetation at the Time of the African Humid Period, Oxford Research Encyclopedia of Climate Science, Oxford University Press, Oxford, https://doi.org/10.1093/acrefore/9780190228620.013.530, 2017. a, b, c
Lézine, A.-M., Hély, C., Grenier, C., Braconnot, P., and Krinner, G.: Sahara and Sahel vulnerability to climate changes, lessons from Holocene hydrological data, Quaternary Sci. Rev., 30, 3001–3012, https://doi.org/10.1016/j.quascirev.2011.07.006, 2011a. a
Lézine, A.-M., Zheng, W., Braconnot, P., and Krinner, G.: Late Holocene plant and climate evolution at Lake Yoa, northern Chad: pollen data and climate simulations, Clim. Past, 7, 1351–1362, https://doi.org/10.5194/cp-7-1351-2011, 2011b. a, b, c, d
Li, Y., Kino, K., Cauquoin, A., and Oki, T.: Contribution of lakes in sustaining the Sahara greening during the mid-Holocene, Clim. Past, 19, 1891–1904, https://doi.org/10.5194/cp-19-1891-2023, 2023. a, b, c, d, e, f, g
Messager, M., Lehner, B., Grill, G., Nedeva, I., and Schmitt, O.: Estimating the volume and age of water stored in global lakes using a geo-statistical approach, Nat. Commun., 7, 13603, https://doi.org/10.1038/ncomms13603, 2016. a, b, c
MPG: Dynamic interaction of lakes, climate and vegetation over northern Africa during the mid-Holocene, https://hdl.handle.net/21.11116/0000-000E-400F-A (last access: 24 July 2024), 2024. a
Olivry, J.-C., Chouret, A., Vuillaume, G., Lemoalle, J., and Bricquet, J.-P.: Hydrologie Du Lac Tchad, vol. 12, Orstom, ISBN 2-7099-1353-4, https://horizon.documentation.ird.fr/exl-doc/pleins_textes/pleins_textes_7/b_fdi_03_01/010009878.pdf (last access: 17 January 2023), 1996. a
Pachur, H.-J. and Hoelzmann, P.: Paleoclimatic implications of late quaternary lacustrine sediments in Western Nubia, Sudan, Quaternary Res., 36, 257–276, https://doi.org/10.1016/0033-5894(91)90002-M, 1991. a
Pham-Duc, B., Sylvestre, F., Papa, F., Frappart, F., Bouchez, C., and Crétaux, J.-F.: The Lake Chad hydrology under current climate change, Sci. Rep.-UK, 10, 5498, https://doi.org/10.1038/s41598-020-62417-w, 2020. a, b, c
Quade, J., Dente, E., Armon, M., Dor, Y. B., Morin, E., Adam, O., and Enzel, Y.: Megalakes in the Sahara? A Review, Quaternary Res., 90, 253–275, https://doi.org/10.1017/qua.2018.46, 2018. a, b, c, d, e
Rachmayani, R., Prange, M., and Schulz, M.: North African vegetation–precipitation feedback in early and mid-Holocene climate simulations with CCSM3-DGVM, Clim. Past, 11, 175–185, https://doi.org/10.5194/cp-11-175-2015, 2015. a
Reick, C. H., Gayler, V., Goll, D., Hagemann, S., Heidkamp, M., Nabel, J. E. M. S., Raddatz, T., Roeckner, E., Schnur, R., and Wilkenskjeld, S.: JSBACH 3 - The land component of the MPI Earth System Model: documentation of version 3.2, MPI für Meteorologie Version Number: 1, MPI für Meteorologie, https://doi.org/10.17617/2.3279802, 2021. a, b
Richter, I. and Tokinaga, H.: An overview of the performance of CMIP6 models in the tropical Atlantic: mean state, variability, and remote impacts, Clim. Dynam., 55, 2579–2601, https://doi.org/10.1007/s00382-020-05409-w, 2020. a
Riddick, T., Brovkin, V., Hagemann, S., and Mikolajewicz, U.: Dynamic hydrological discharge modelling for coupled climate model simulations of the last glacial cycle: the MPI-DynamicHD model version 3.0, Geosci. Model Dev., 11, 4291–4316, https://doi.org/10.5194/gmd-11-4291-2018, 2018. a
Schneck, R., Gayler, V., Nabel, J. E. M. S., Raddatz, T., Reick, C. H., and Schnur, R.: Assessment of JSBACHv4.30 as a land component of ICON-ESM-V1 in comparison to its predecessor JSBACHv3.2 of MPI-ESM1.2, Geosci. Model Dev., 15, 8581–8611, https://doi.org/10.5194/gmd-15-8581-2022, 2022. a, b, c
Sha, L., Ait Brahim, Y., Wassenburg, J. A., Yin, J., Peros, M., Cruz, F. W., Cai, Y., Li, H., Du, W., Zhang, H., Edwards, R. L., and Cheng, H.: How Far North Did the African Monsoon Fringe Expand During the African Humid Period? Insights From Southwest Moroccan Speleothems, Geophys. Res. Lett., 46, 14093–14102, https://doi.org/10.1029/2019GL084879, 2019. a
Specht, N. F., Claussen, M., and Kleinen, T.: Simulated range of mid-Holocene precipitation changes from extended lakes and wetlands over North Africa, Clim. Past, 18, 1035–1046, https://doi.org/10.5194/cp-18-1035-2022, 2022. a, b, c, d, e, f, g, h, i, j, k, l, m
Stacke, T.: Development of a dynamical wetlands hydrology scheme and its application under different climate conditions, PhD thesis, University of Hamburg, Hamburg, 2011. a
Strickler, D. A.: Contributions to the Question of a Velocity Formula and Roughness Data for Streams, Channels and Closed Pipelines, California Institute of Technology, p. 112, 1981. a, b
Swezey, C., Lancaster, N., Kocurek, G., Deynoux, M., Blum, M., Price, D., and Pion, J. C.: Response of aeolian systems to Holocene climatic and hydrologic changes on the northern margin of the Sahara: a high-resolution record from the Chott Rharsa basin, Tunisia, Holocene, 9, 141–147, https://doi.org/10.1191/095968399670329816, 1999. a
Tierney, J. E., Pausata, F. S. R., and deMenocal, P. B.: Rainfall regimes of the Green Sahara, Science Advances, 3, e1601503, https://doi.org/10.1126/sciadv.1601503, 2017. a
Vamborg, F. S. E., Brovkin, V., and Claussen, M.: The effect of a dynamic background albedo scheme on Sahel/Sahara precipitation during the mid-Holocene, Clim. Past, 7, 117–131, https://doi.org/10.5194/cp-7-117-2011, 2011. a
Wieners, K.-H., Giorgetta, M., Jungclaus, J., Reick, C., Esch, M., Bittner, M., Legutke, S., Schupfner, M., Wachsmann, F., Gayler, V., Haak, H., de Vrese, P., Raddatz, T., Mauritsen, T., von Storch, J.-S., Behrens, J., Brovkin, V., Claussen, M., Crueger, T., Fast, I., Fiedler, S., Hagemann, S., Hohenegger, C., Jahns, T., Kloster, S., Kinne, S., Lasslop, G., Kornblueh, L., Marotzke, J., Matei, D., Meraner, K., Mikolajewicz, U., Modali, K., Müller, W., Nabel, J., Notz, D., Peters-von Gehlen, K., Pincus, R., Pohlmann, H., Pongratz, J., Rast, S., Schmidt, H., Schnur, R., Schulzweida, U., Six, K., Stevens, B., Voigt, A., and Roeckner, E.: MPI-M MPI-ESM1.2-LR model output prepared for CMIP6 CMIP historical, Earth System Grid Federation, https://doi.org/10.22033/ESGF/CMIP6.6595, 2019a. a
Wieners, K.-H., Giorgetta, M., Jungclaus, J., Reick, C., Esch, M., Bittner, M., Legutke, S., Schupfner, M., Wachsmann, F., Gayler, V., Haak, H., de Vrese, P., Raddatz, T., Mauritsen, T., von Storch, J.-S., Behrens, J., Brovkin, V., Claussen, M., Crueger, T., Fast, I., Fiedler, S., Hagemann, S., Hohenegger, C., Jahns, T., Kloster, S., Kinne, S., Lasslop, G., Kornblueh, L., Marotzke, J., Matei, D., Meraner, K., Mikolajewicz, U., Modali, K., Müller, W., Nabel, J., Notz, D., Peters-von Gehlen, K., Pincus, R., Pohlmann, H., Pongratz, J., Rast, S., Schmidt, H., Schnur, R., Schulzweida, U., Six, K., Stevens, B., Voigt, A., and Roeckner, E.: MPI-M MPI-ESM1.2-LR model output prepared for CMIP6 CMIP piControl, Earth System Grid Federation, https://doi.org/10.22033/ESGF/CMIP6.6675, 2019b. a
Zhao, Y., Braconnot, P., Harrison, S. P., Yiou, P., and Marti, O.: Simulated changes in the relationship between tropical ocean temperatures and the western African monsoon during the mid-Holocene, Clim. Dynam., 28, 533–551, https://doi.org/10.1007/s00382-006-0196-7, 2007. a