the Creative Commons Attribution 4.0 License.
the Creative Commons Attribution 4.0 License.
 | 23 Jul 2024
Controls on Early Cretaceous South Atlantic Ocean circulation and carbon burial – a climate model–proxy synthesis
Sebastian Steinig
Wolf Dummann
Peter Hofmann
Martin Frank
Wonsun Park
Thomas Wagner
Sascha Flögel
Black shale sediments from the Barremian to Aptian South Atlantic document the intense and widespread burial of marine organic carbon during the initial stages of seafloor spreading between Africa and South America. The enhanced sequestration of atmospheric CO2 makes these young ocean basins potential drivers of the Early Cretaceous carbon cycle and climate perturbations. The opening of marine gateways between initially restricted basins and related circulation and ventilation changes are a commonly invoked explanation for the transient formation and disappearance of these regional carbon sinks. However, large uncertainties in palaeogeographic reconstructions limit the interpretation of available palaeoceanographic data and prevent any robust model-based quantifications of the proposed circulation and carbon burial changes. Here, we present a new approach to assess the principal controls on the Early Cretaceous South Atlantic and Southern Ocean circulation changes under full consideration of the uncertainties in available boundary conditions. Specifically, we use a large ensemble of 36 climate model experiments to simulate the Barremian to Albian progressive opening of the Falkland Plateau and Georgia Basin gateways with different configurations of the proto-Drake Passage, the Walvis Ridge, and atmospheric CO2 concentrations. The experiments are designed to complement available geochemical data across the regions and to test circulation scenarios derived from them. All simulations show increased evaporation and intermediate water formation at subtropical latitudes that drive a meridional overturning circulation whose vertical extent is determined by the sill depth of the Falkland Plateau. The densest water masses formed in the southern Angola Basin and potentially reached the deep Cape Basin as Walvis Ridge Overflow Water. Palaeogeographic uncertainties are as important as the lack of precise knowledge of atmospheric CO2 levels for the simulated temperature and salinity spread in large parts of the South Atlantic. Overall temperature uncertainties reach up to 15 °C and increase significantly with water depth. The ensemble approach reveals temporal changes in the relative importance of geographic and radiative forcings for the simulated oceanographic conditions and, importantly, nonlinear interactions between them. The progressive northward opening of the highly restricted Angola Basin increased the sensitivity of local overturning and upper-ocean stratification to atmospheric CO2 concentrations due to large-scale changes in the hydrological cycle, while the chosen proto-Drake Passage depth is critical for the ocean dynamics and CO2 response in the southern South Atlantic. Finally, the simulated processes are integrated into a recent carbon burial framework to document the principal control of the regional gateway evolution on the progressive shift from the prevailing saline and oxygen-depleted subtropical water masses to the dominance of ventilated high-latitude deep waters.
- Article
(11658 KB) - Full-text XML
-
Supplement
(4747 KB) - BibTeX
- EndNote


The Early Cretaceous (i.e. Barremian to Albian) South Atlantic Ocean provides a unique possibility for gaining insights into the complex interplay of large-scale tectonics, related ocean circulation and carbon burial changes, and the global climate evolution. On the one hand, the young ocean basin emerged in the wake of the ongoing breakup of Gondwana and the rifting between South America and Africa that had started during the earliest Cretaceous (Torsvik et al., 2009; Heine et al., 2013). On the other hand, the general warmth of the Early Cretaceous greenhouse climate (O'Brien et al., 2017) was interrupted by severe perturbations of the global carbon cycle (e.g. Weissert, 1989; Bralower et al., 1994), short-term temperature fluctuations (Bodin et al., 2015; Jenkyns, 2018; Cavalheiro et al., 2021), and marine biotic crises (McAnena et al., 2013). Large shelf areas and restricted circulation in young ocean basins produced favourable conditions for increased biogeochemical turnover rates and organic carbon burial (Trabucho-Alexandre et al., 2012), thus providing a possible link between the regional basin evolution and global carbon cycle perturbations. Sedimentary evidence for periods of enhanced carbon sequestration come from the widespread deposition of organic-rich black shales found throughout the Mesozoic Atlantic Ocean, with an increased occurrence during the Aptian–Albian (Stein et al., 1986). Biogeochemical modelling showed that the restricted environments of the developing South Atlantic and Southern Ocean acted as efficient carbon sinks that played a crucial role in driving global cooling during the Late Aptian (McAnena et al., 2013).
Dummann et al. (2020, 2021a) reconstructed the history of Early Cretaceous gateway openings in the southern South Atlantic and the related formation and disappearance of regional carbon sinks. They combined a new stratigraphic framework for distinct sites across the South Atlantic and Southern Ocean with radiogenic neodymium (Nd) isotope signatures to trace past water mass mixing between both basins (Fig. 1b). The neodymium isotopic composition, expressed as ϵNd(t), is used as a quasi-conservative tracer of bottom-water masses (Frank, 2002). Differences in the ϵNd(t) of seawater are mainly caused by spatially heterogeneous lithogenic input in the source region of a water mass and by mixing along its flow path. Dummann et al. (2020) demonstrated the dominant control of marine gateways on the local ocean circulation and ventilation. Prior to 117 Ma, the palaeogeographic position of the Falkland Plateau (FP) severely limited water mass exchange between the South Atlantic and the Southern Ocean (Fig. 1c). Limited ventilation of the Cape Basin led to oxygen-deficient deep waters and the formation of organic-rich black shales (Fig. 1a). The detection of a more radiogenic water mass at the Deep Sea Drilling Project (DSDP) Site 511 on the Falkland Plateau at around 117 Ma marks the onset of increased South Atlantic Intermediate Water (SAIW) export due to the progressive westward drift of the Falkland Plateau (Fig. 1d). Between 113 and 110 Ma, the Maurice Ewing Bank cleared the southern tip of Africa and allowed the first deep-water exchange between the South Atlantic and Southern Ocean via the Georgia Basin gateway (GBG) (Fig. 1e). Less radiogenic ϵNd(t) signatures in the South Atlantic indicate stronger advection of cold, oxygenated waters from the Southern Ocean. As a consequence, the enhanced organic carbon burial ended even in the deep South Atlantic.
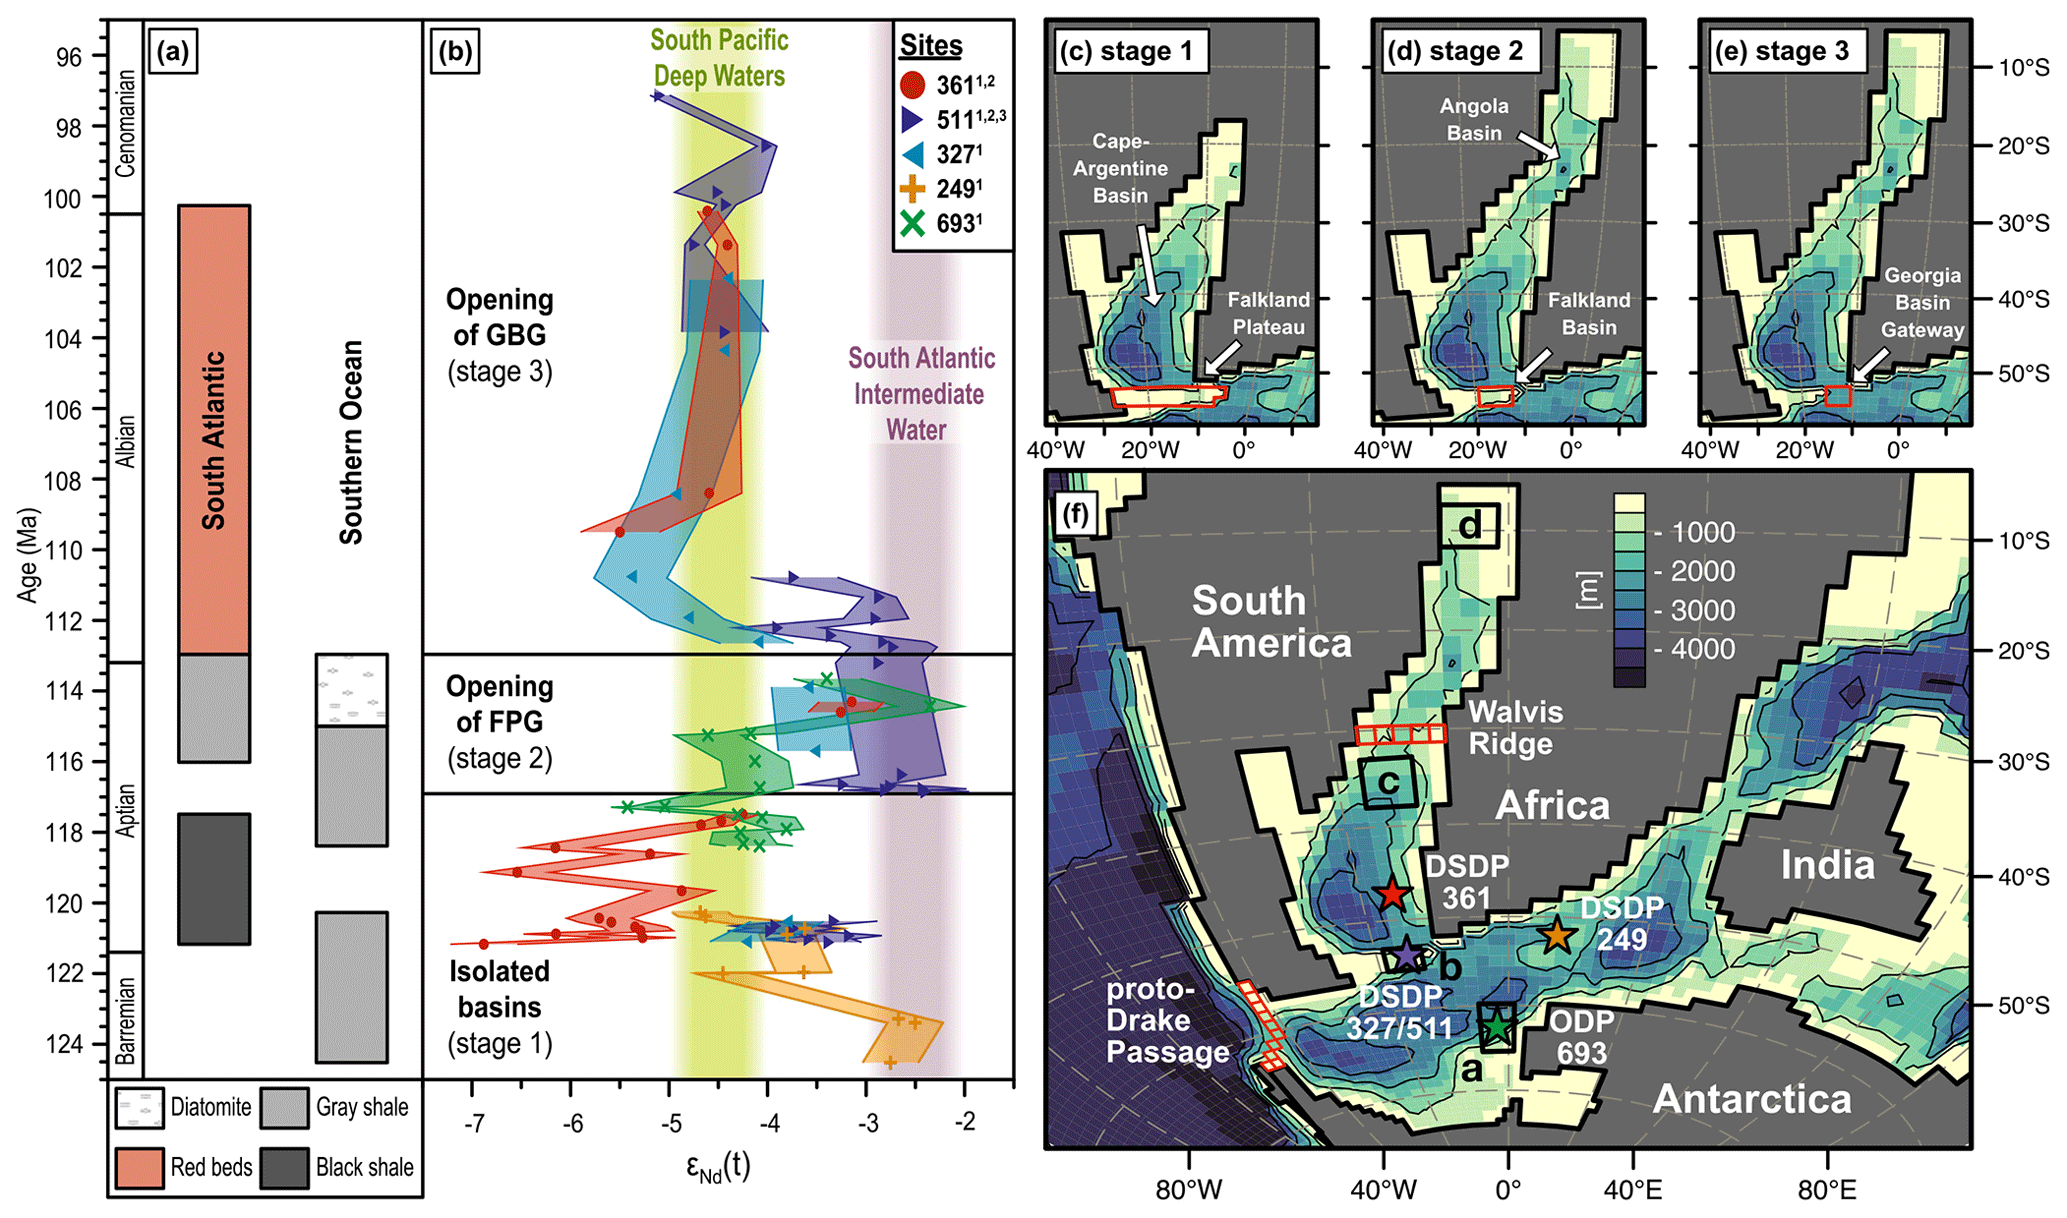
Figure 1Reconstructed water mass evolution and model set-up. Panels (a)–(b) are modified from Dummann et al. (2020) and updated to GTS2020 and show the (a) dominant lithology of sites in the South Atlantic and Southern Ocean and (b) the evolution of seawater Nd isotope signatures with ±2 SD range. Green and purple shading indicate the proposed Nd isotope range of the intermediate and deep-water end-members of the South Pacific and South Atlantic. The literature ϵNd(t) values are taken from Dummann et al. (2020), Murphy and Thomas (2013), and Robinson et al. (2010). Panels (c), (d), and (e) show the applied model bathymetries for stages 1 to 3, and panel (f) shows the approximate palaeolocations of the study sites adapted to the stage 2 model bathymetry. Highlighted grid points for the proto-Drake Passage and Walvis Ridge show the maximum applied gateway depth. Black rectangles in panel (f) represent areas used for averaging in Fig. 7.
Climate models are an ideal tool for testing these proxy-derived hypotheses and quantifying the associated regional circulation and palaeoenvironmental changes. Previous modelling studies support the idea that large-scale ocean circulation in the young South Atlantic and Southern Ocean was primarily controlled by the palaeogeography (Chaboureau et al., 2012; Uenzelmann-Neben et al., 2017; Ladant et al., 2020). But this also means that the validity of any simulated mean state and potentially also the predicted response to the proposed gateway changes critically depend on the quality of applied model boundary conditions. While this poses a problem for palaeomodelling applications in general, it becomes even more important for analyses of regional scales for deep-time periods. For the Early Cretaceous South Atlantic opening, we identify three major uncertainties in available boundary conditions:
-
Stomata-based reconstructions of Barremian–Albian atmospheric CO2 concentrations vary between 400 and 1500 ppmv (Wang et al., 2014; Jing and Bainian, 2018).
-
Estimates of the proto-Drake Passage (DP; Fig. 1f) bathymetry for the Early Cretaceous range from intermediate depth (Sewall et al., 2007; Eagles, 2010) and shallow marine (Cao et al., 2017) to a complete closure (Hay et al., 1999).
-
The depth of the Walvis Ridge (WR), which separates the southern South Atlantic from the Angola Basin (Fig. 1f), is poorly constrained (Pérez-Díaz and Eagles, 2017).
All of these uncertainties have the potential to influence the oceanographic response to changes in the palaeogeographic position of the Falkland Plateau. Traditionally, dedicated sensitivity experiments are used to diagnose the influence of each uncertain parameter on the simulated circulation individually (e.g. Barron and Washington, 1984; Sloan and Rea, 1996; Chaboureau et al., 2012; Ladant et al., 2020). Although computationally efficient, this approach does not necessarily capture all possible circulation states because it does not account for potential nonlinear responses. For example, the simulated response to changes in atmospheric CO2 concentrations could be different during the individual opening stages of the South Atlantic or might itself depend on the chosen depth of the Drake Passage or Walvis Ridge. To resolve this dilemma, we propose an ensemble approach to simulate the first three stages of the proposed gateway history under full consideration of the above-mentioned uncertainties. We adapt a concept similar to ensemble forecasting used for numerical weather prediction, but instead of accounting for imperfect initial conditions, we account for uncertainties in the boundary conditions. We make use of advances in available computing power to generate a large ensemble of 36 model simulations (3 opening stages × 2 CO2 levels × 3 DP depths × 2 WR depths) instead of dedicated sensitivity experiments. This approach allows us to estimate the full range of possible model results arising from the uncertainties in the boundary conditions and to identify potential nonlinear responses of the regional ocean circulation through time. We further use the spread between different ensemble members to assess the robustness of our results and the derived conclusions. Finally, we constrain the range of simulated circulation scenarios with the reconstructed water mass mixing to derive an integrated history of ocean circulation and carbon burial for the Early Cretaceous South Atlantic and Southern Ocean.
2.1 Model description
We use a version of the Kiel Climate Model (KCM; Park et al., 2009), a fully coupled atmosphere–ocean–sea ice general circulation model, for all simulations. It uses the ECHAM5 spectral atmospheric general circulation model (Roeckner et al., 2003) with 19 vertical levels and a higher horizontal resolution of ∼ 2.8° × 2.8° (T42) than described in Park and Latif (2019). It is coupled to the NEMO ocean–sea ice model (Madec and the NEMO System Team, 2023), which uses a tripolar grid with a horizontal resolution of 2° (ORCA2) at 31 vertical levels, with an equatorial refinement of the meridional resolution to 0.5°. The global land topography and ocean bathymetry (Blöhdorn, 2013) represent an Early Aptian (∼ 120 Ma) time slice and are based on the reconstructions of Müller et al. (2008) and Blakey (2008). Freshwater routing from the land surface to the ocean follows the land orography (Hagemann and Dümenil, 1998). Simplified climate-zone-dependent vegetation parameters (Blöhdorn, 2013) are applied to the ice-free land surface. Integrations are performed at atmospheric CO2 concentrations of 600 and 1200 ppmv to account for the large spread in available reconstructions for the Early Cretaceous (e.g. Wang et al., 2014; Jing and Bainian, 2018). The solar constant is reduced by ∼ 1 % to 1350 W m−2, while the orbital parameters and other greenhouse gases are fixed at their preindustrial values due to the lack of available reconstructions.
2.2 South Atlantic and Southern Ocean palaeobathymetry
The model set-up is nearly identical to the simulations in Steinig et al. (2020). But to increase comparability with previous studies (Chaboureau et al., 2012; Uenzelmann-Neben et al., 2017) and improve reproducibility, we replaced the regional land–sea mask and ocean bathymetry of the study area, i.e. the whole region shown in Fig. 1f, with published climate model boundary conditions for the Early Cretaceous (Sewall et al., 2007). To focus on gateway-related circulation changes during the initial stages of the South Atlantic opening, we kept the large-scale bathymetry of the Southern Ocean and southern South Atlantic fixed throughout all simulations. Sewall et al. (2007) provide palaeobathymetries for the time slices of the Early Aptian and Early Albian. We chose the latter as our base configuration (Fig. 1f) for two reasons. First, it features an initial shallow-water connection between India and Antarctica. This proto-Indian Ocean is missing in the Early Aptian time slice but is present in other reconstructions (Golonka, 2007; Gibbons et al., 2013) and other climate model boundary conditions for the earliest Cretaceous (Lunt et al., 2016). Second, it includes a shallower maximum water depth of the DP of ∼ 1400 m compared to ∼ 2000 m in the Early Aptian time slice (Sewall et al., 2007). This is more in line with the general view of a shallow- or intermediate-water connection between the Pacific Ocean and the Weddell Sea during the Cretaceous (e.g. Eagles, 2010; Donnadieu et al., 2016; Cao et al., 2017), while the onset of deep-water exchange was associated with the formation of oceanic crust starting in the Oligocene (Lagabrielle et al., 2009). To further account for the considerable uncertainty in estimates of the DP depth, ranging from about 1400 m (Sewall et al., 2007) and shallow marine (Cao et al., 2017) to a closed gateway (Hay et al., 1999), we perform the simulations with three different depths of the passage of 1400, 200, and 0 m, respectively (200 and 0 m depths are applied to all highlighted DP grid points in Fig. 1f). Paleobathymetric reconstructions for the WR between the Cape–Argentine and Angola basins (Fig. 1f), are similarly uncertain (Pérez-Díaz and Eagles, 2017). Although previous modelling studies assumed relatively large sill depths of ∼ 1000 m (Lunt et al., 2016; Uenzelmann-Neben et al., 2017), plate tectonic modelling (Heine et al., 2013) and seawater Nd isotope data (Dummann et al., 2023) suggest little to no water mass exchange across the WR during the Aptian–Albian. We therefore conducted two sets of simulations with a maximum depth of the WR of either ∼ 1200 m (Sewall et al., 2007) or 200 m (a depth of 200 m is applied to all highlighted WR grid points in Fig. 1f). In contrast to the DP, we do not consider a completely closed WR due to the evidence of at least some connectivity between the southern and northern South Atlantic (e.g. Dingle, 1999; Kochhann et al., 2014; Cui et al., 2023).
Due to the proposed crucial role of the Falkland Plateau in governing the water mass exchange between the South Atlantic and the Southern Ocean, we refined its representation in the local model bathymetry. Shape and position are based on a high-resolution regional study (see Fig. S1 in the Supplement; Pérez-Díaz and Eagles, 2017), but the limited model resolution only allows for an idealised geometry (red polygon in Fig. 1c). The plateau consists of a shallow (250 m) Malvinas Basin in the west, a deeper Falkland Basin (750 m, Fig. 1d), and a shallow (250 m) Maurice Ewing Bank in the east. The chosen depth of the Falkland Basin is in between a reconstructed Aptian shelf environment (Harris et al., 1977; Basov and Krasheninnikov, 1983) and a Late Albian water depth of ∼ 800 m (Holbourn et al., 2001). The estimated subsidence based on assemblages of benthic foraminifera was supported by the application of backtracking methods (Müller et al., 2018). The depth of the Georgia Basin gateway (Fig. 1e) was set to 2500 m (Pérez-Díaz and Eagles, 2017).
2.3 Ensemble approach and model spin-up
We define model geographies for three consecutive time slices representing the initial stages of South Atlantic opening (Fig. 1c–e). They resemble the proposed characteristics of the first three stages of the reconstructed water mass exchange between the South Atlantic and Southern Ocean (see Sect. 1) associated with a progressive westward drift of the Falkland Plateau. The bathymetry of the Southern Ocean and southern South Atlantic (i.e. the Cape–Argentine Basin) is fixed for all stages due to the large uncertainties in the available reconstructions (Pérez-Díaz and Eagles, 2017). In fact, at the upper end of reconstructions, the southern South Atlantic at 120 Ma is as wide as, and even deeper than, the minimum estimate at 110 Ma (see Fig. S1). For the region north of the WR, we apply the Early Aptian bathymetry of Sewall et al. (2007) for stage 1 and the Early Albian time slice for stages 2 and 3 to assess the influence of the changing Angola Basin geometry. As the applied topography around the Angola Basin is fixed to an Early Aptian time slice and does not include the Early Albian equatorial rift valley shown in Sewall et al. (2007), we add a drainage basin north of the Angola Basin to the model freshwater routing for stages 2 and 3. These three opening stages are simulated with all possible combinations of sensitivity parameters discussed above, i.e. variable DP depth (0, 200, and 1400 m), variable WR depth (200 and 1200 m), and two atmospheric CO2 end members (600 and 1200 ppmv). This results in 12 different ensemble members for each stage and 36 simulations in total.
Throughout the analysis, we will focus on the oceanographic changes associated with four key processes that are defined as follows:
-
a doubling of atmospheric CO2, i.e. 1200 minus 600 ppmv (hereafter ΔCO2);
-
an opening of the proto-Drake Passage, i.e. original maximum depth of 1400 m minus closed gateway (hereafter ΔDP);
-
an opening of a deep-water connection between the South Atlantic and Southern Ocean via the Georgia Basin, i.e. stage 3 minus stage 2 (hereafter ΔGBG); and
-
a deeper Walvis Ridge, i.e. 1200 m minus 200 m (hereafter ΔWR)
If not stated differently, these changes are averaged over all respective ensemble members; i.e. results for ΔCO2 represent the average difference between 18 simulations with 1200 ppmv and 18 simulations with 600 ppmv CO2. All ensemble members are equally weighted for the calculation of the ensemble averages.
Simulations are initialised with the output of two existing 6000-year-long integrations (Steinig et al., 2020), using the boundary conditions described in Sect. 2.1 at 600 and 1200 ppmv CO2, respectively. These two simulations were started from a homogeneous ocean with a temperature of 10 °C and a salinity of 35. The remaining temperature drift even in the deeper ocean was below 1 °C over the last 1000 years for both spin-ups (Fig. 2e). From this, the six experiments for stages 1 to 3 at the two chosen CO2 levels were branched off and integrated for another 2000 years to allow the regional circulation to adapt to the modified geography described in Sect. 2.2. Ensemble simulations with changes in the depth of the DP (WR) are branched off at overall model year 8000 (8500) and integrated for a further 1000 (500) years. Ensemble members with a closed DP are integrated for an additional 500 years to account for the larger regional temperature response. The integration length for individual ensemble members is limited due to the computational effort of the ensemble approach. Changes in DP depth have the largest influence on deep-ocean conditions (Fig. 2f). To test the long-term stability of our results, we extended the integrations for three ensemble members with different Drake Passage depths by a further 1500–2000 model years each. There is no mean change in the ocean temperature during this spin-up extension in all three ensemble members (red lines are extended to the model year 11 000 in Fig. 2b, d, f) in the study region, even for the deep ocean. In addition, global mean temperature drift over the additional 1500–2000 model years for all extended simulations is below 0.3 °C at all levels (Fig. S2). We therefore treat all ensemble members as sufficiently equilibrated, even for the deep South Atlantic and Southern Ocean (Fig. 2f). Climatological means are averaged over the respective last 100 model years.
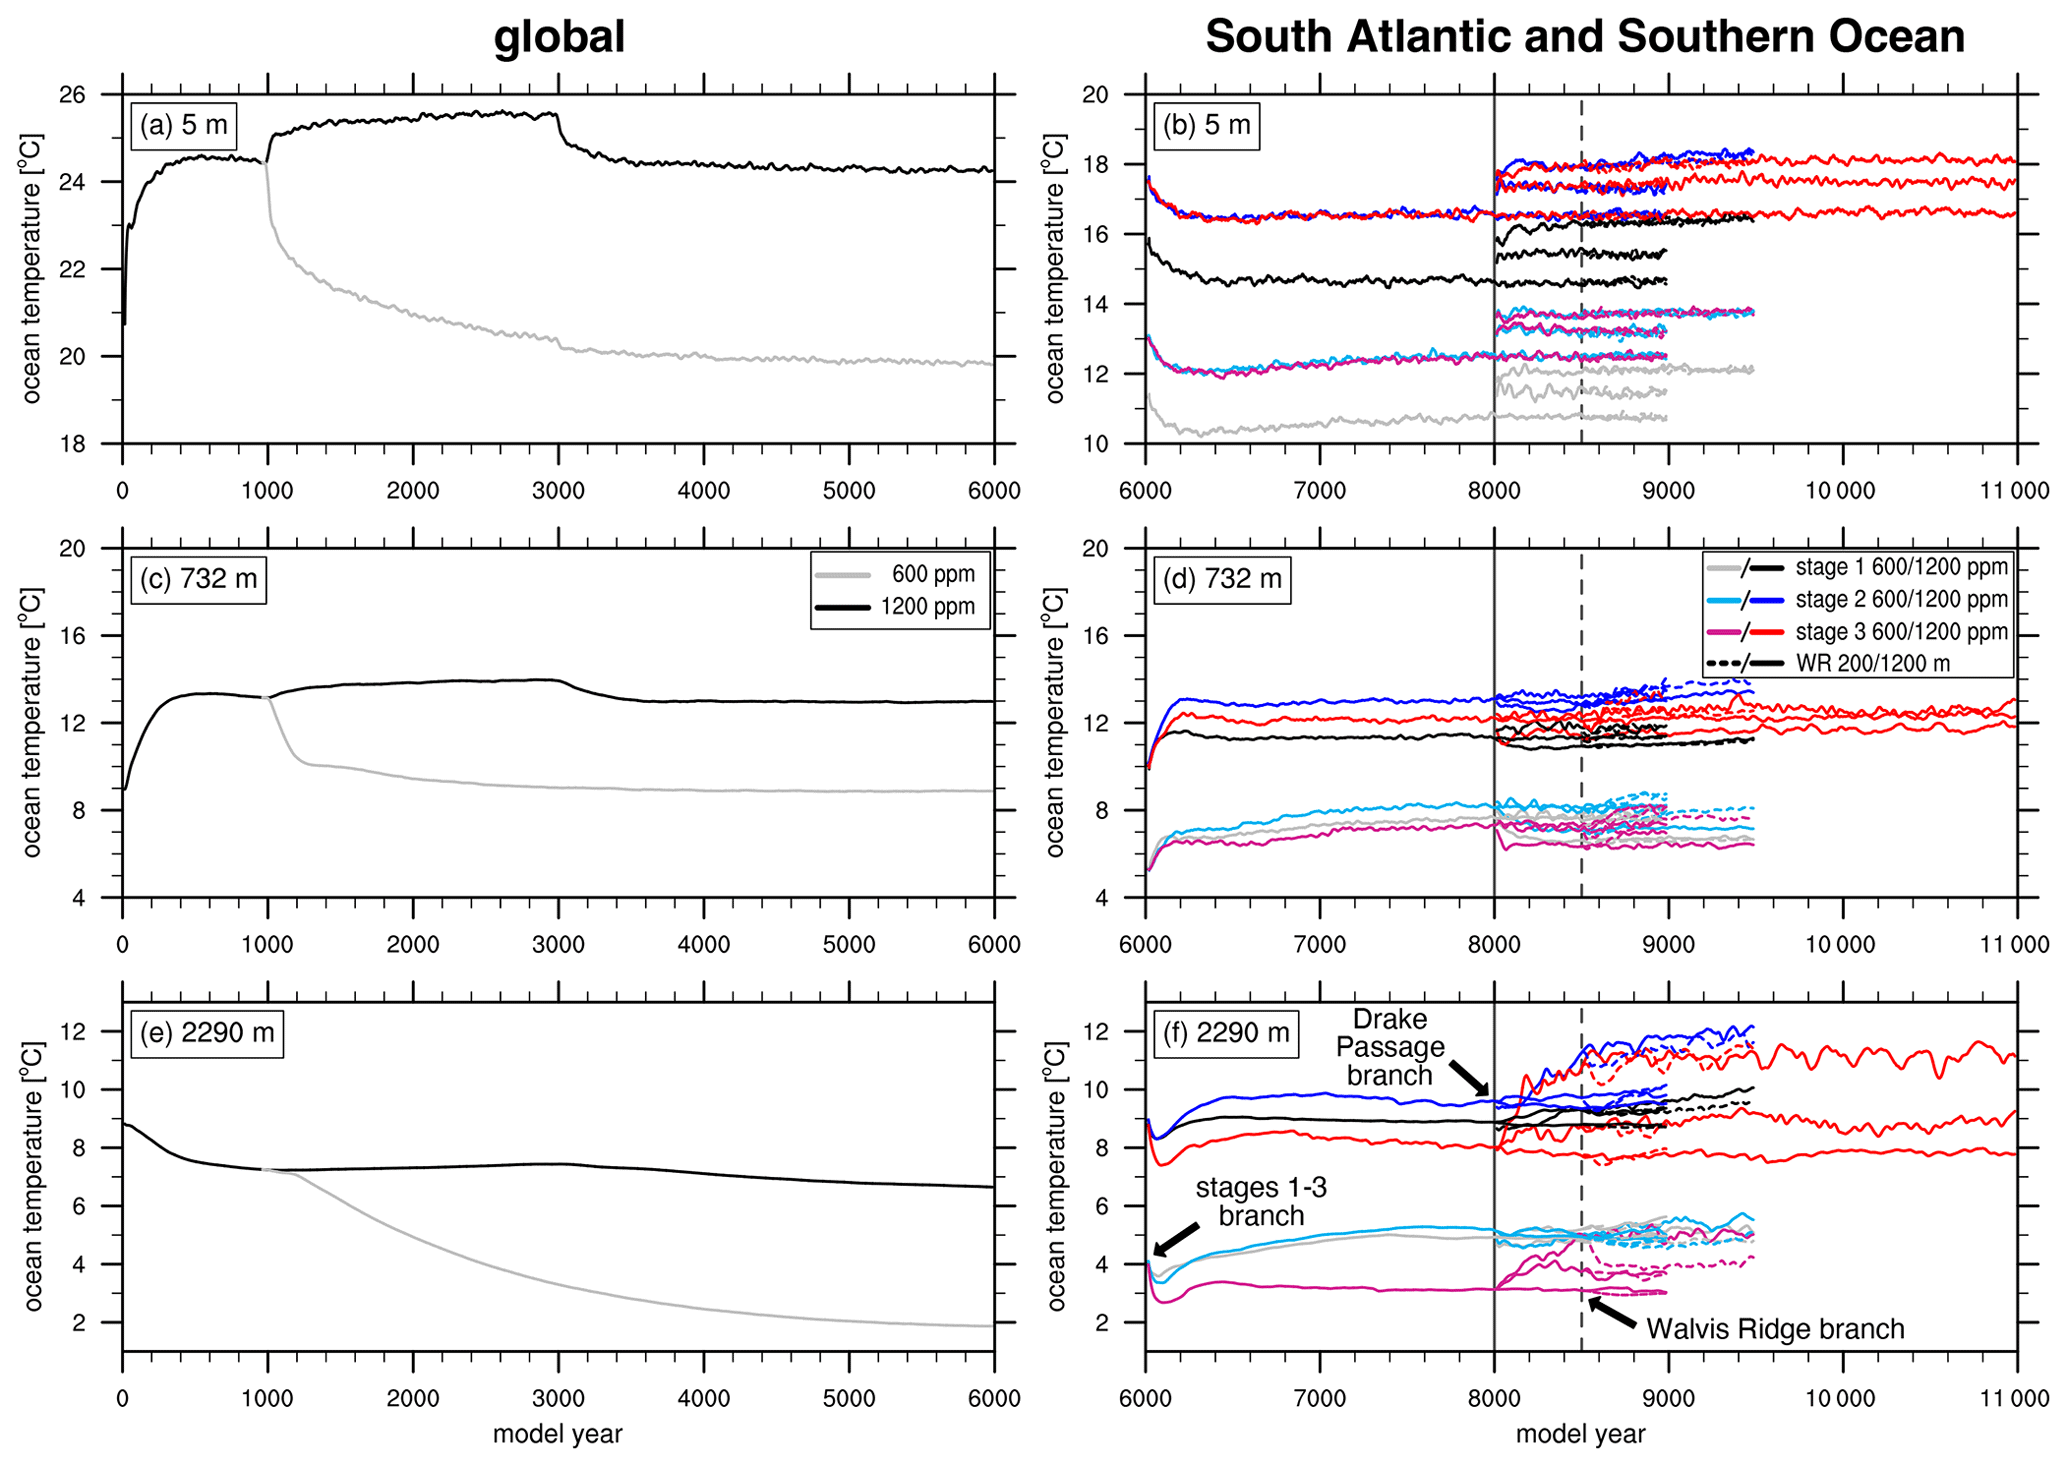
Figure 2Overview of ensemble spin-up phases. Time series of annual mean ocean temperatures at different depths are averaged globally on the left and over the South Atlantic and Southern Ocean (0–90° S, 40° W–20° E) on the right. Colour coding represents the different stages defined in the main text and the two levels of atmospheric CO2. The sudden shifts in temperature at years 1000 and 3000 of the initial spin-up are related to a temporary increase in the atmospheric time step length, which has been reversed to improve model stability.
3.1 Global ocean circulation
The simulated global ocean surface circulation and temperature distribution for the three ensemble members with the extended spin-up period (see Sect. 2.3) are shown in Fig. 3. High-latitude circulation is limited by marine gateways in both hemispheres. The maximum DP depth leads a total volume transport of 20.6 Sv into the Atlantic sector of the Southern Ocean, while 9.5 Sv enter the Arctic Ocean from the North Pacific (Fig. 3a). Deep-water-formation regions, defined as areas with monthly mean mixed-layer depths greater than 500 m, are found in the high-latitude North and South Pacific, as well as the Arctic Ocean (Fig. 3a). Limited connectivity of the Arctic to the rest of the global deep ocean leads to a Southern-Hemisphere-dominated global overturning circulation (not shown). Changes in the South Atlantic gateways (i.e. FP, GBG, and WR) do not influence global ocean dynamics significantly, due to the limited export of local water masses. However, we find an important influence of the DP depth on the large-scale ocean circulation and the associated meridional heat transport. As the depth of the DP decreases (Fig. 3b, c), the reduced volume transport through the DP is compensated by an equally large increase (11 to 17 Sv) in the advection of warm and saline subtropical waters between Africa and India. Simultaneously, the advection of relatively warm waters into the Arctic Ocean decreases by up to 40 % (Fig. 3b). As a result, surface temperatures increase in the Southern Hemisphere and decrease in the Northern Hemisphere in response to changes in the DP, with maximum changes of up to 3 °C in the polar regions.
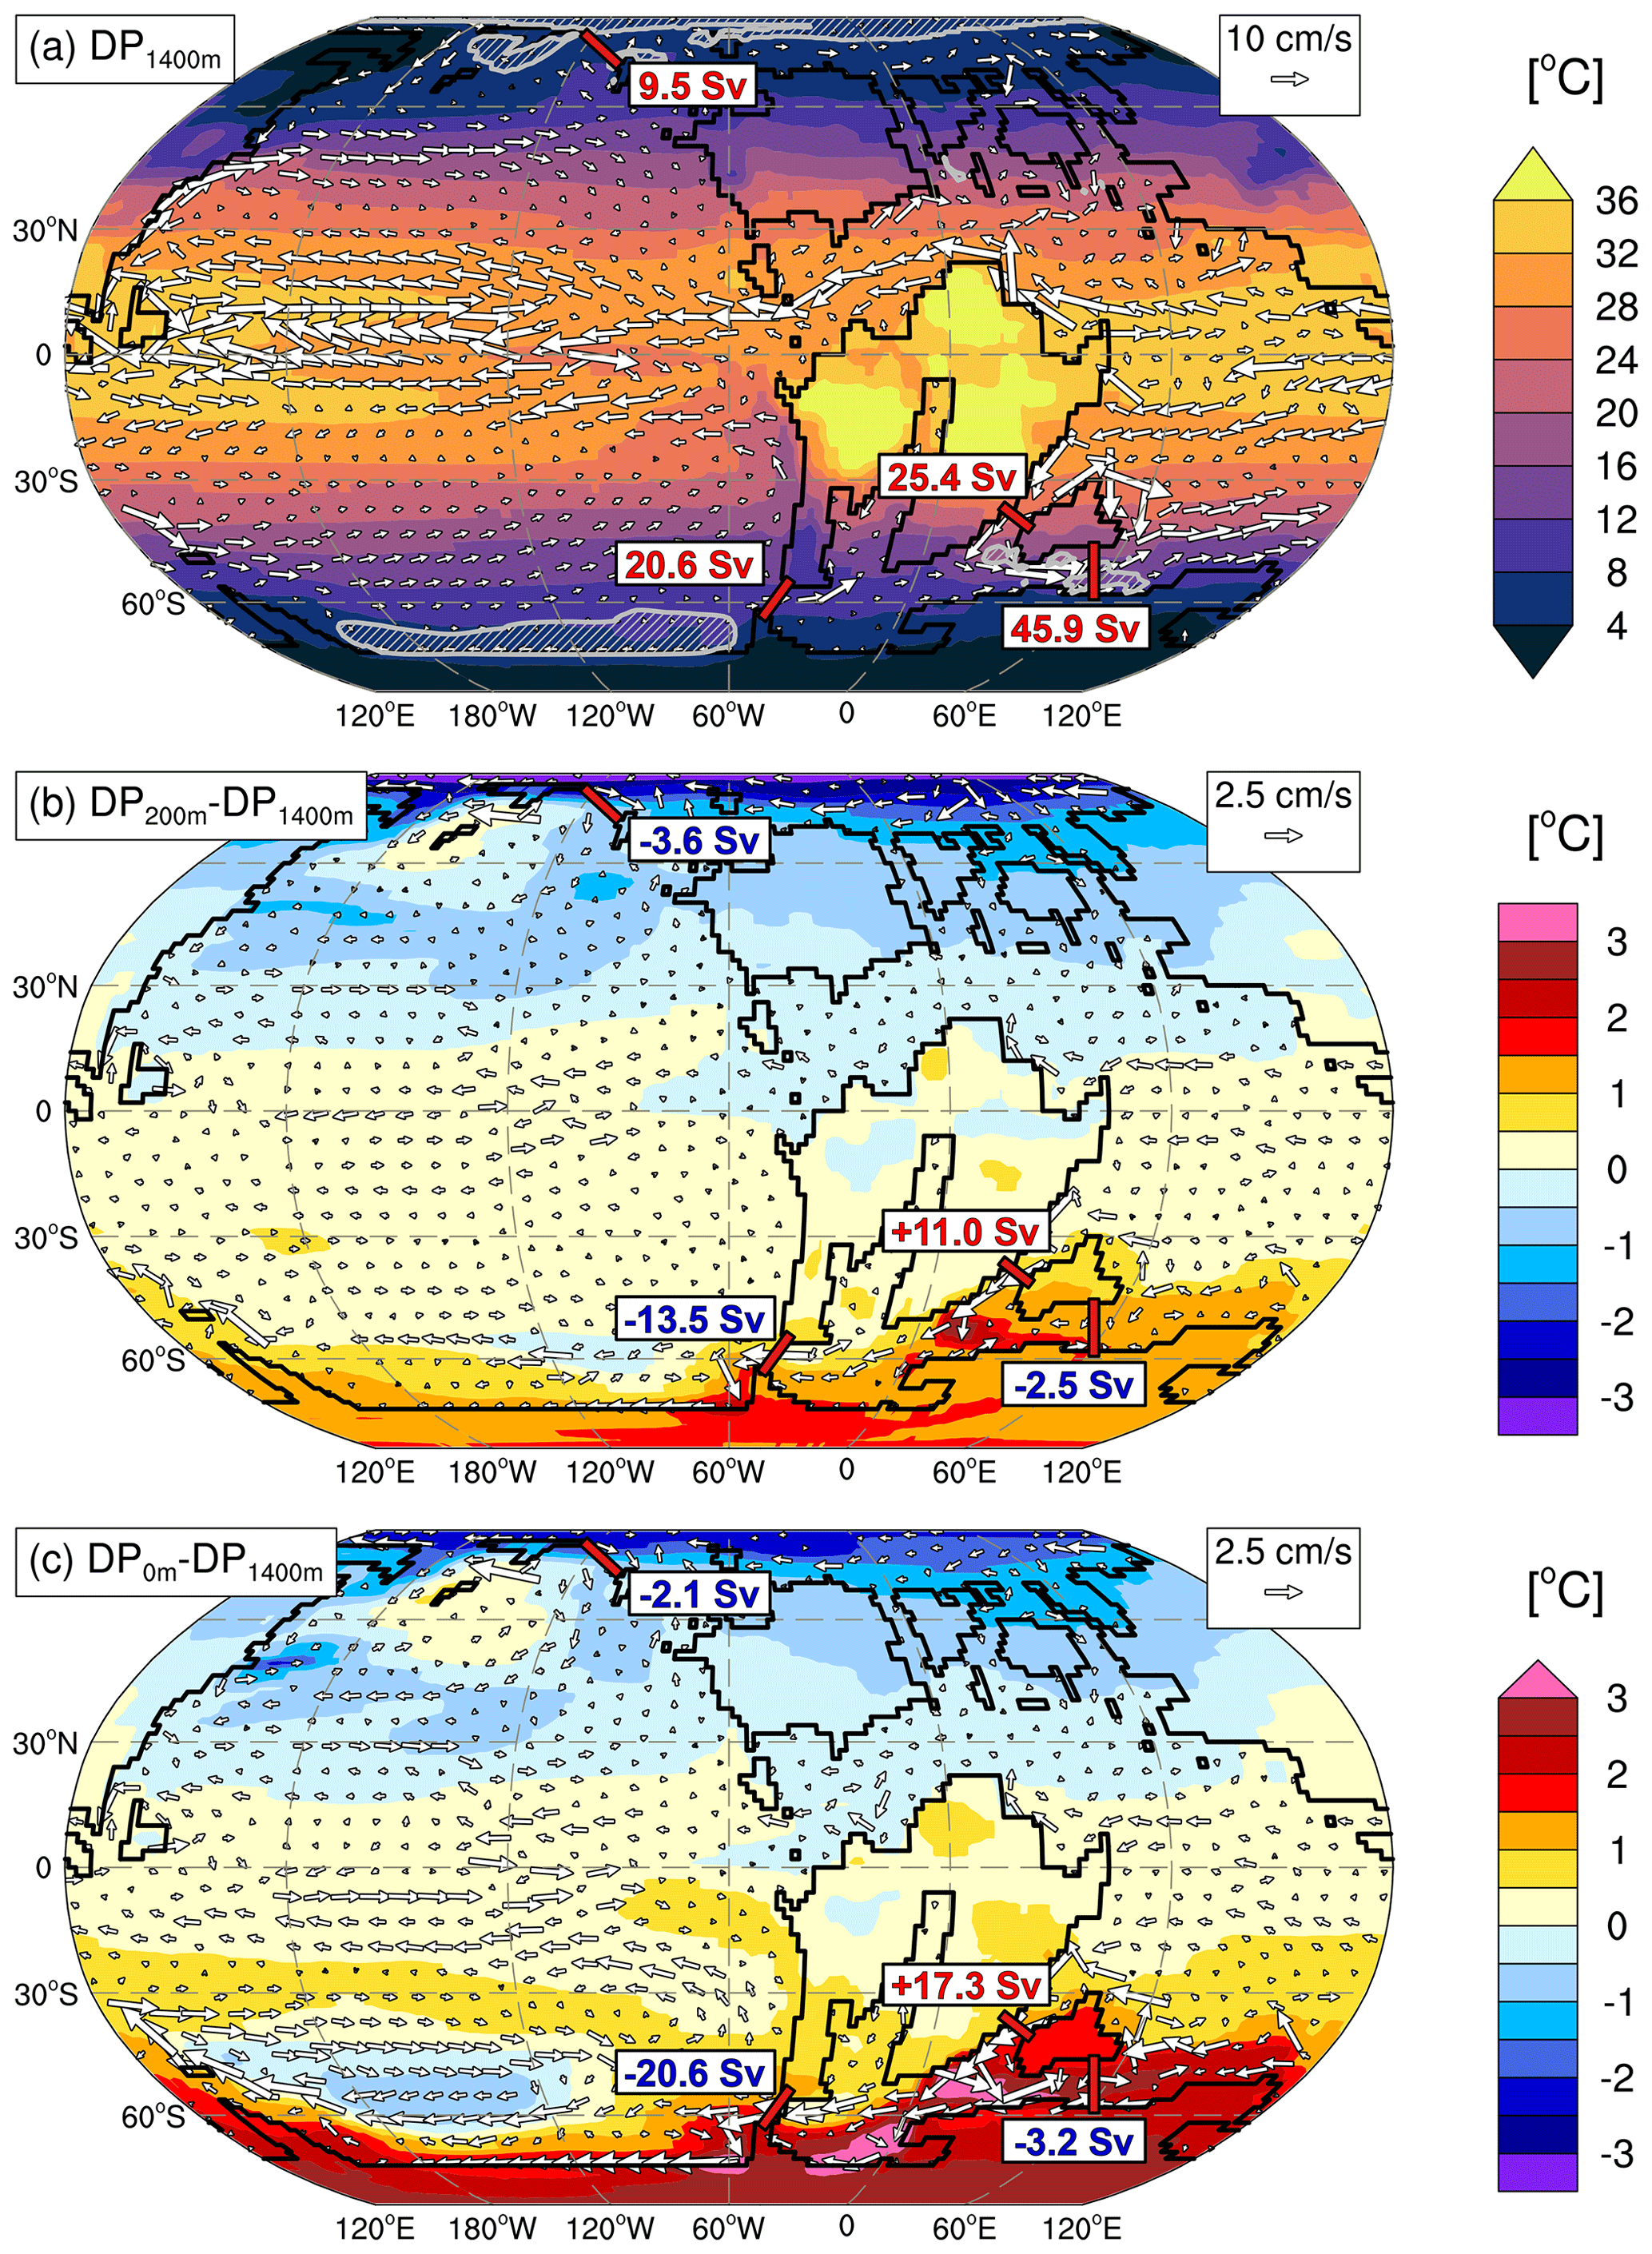
Figure 3Ocean circulation and surface temperature sensitivity to proto-Drake Passage depth. Vectors show the horizontal ocean velocity (cm s−1) averaged over the upper 100 m on contours of near-surface air temperature (°C). Numbers indicate the depth-integrated volume transport across individual gateways. Values are in sverdrup (1 Sv = 106 m3 s−1). Panel (a) shows the annual mean values for the original DP depth of 1400 m and the respective differences for the (b) 200 m and (c) closed DP. Note that ocean current vectors and total gateway transports in panels (b) and (c) are also shown as anomalies relative to panel (a). Shaded areas in panel (a) indicate deep-water-formation areas with monthly mean mixed-layer depths greater than 500 m. Results are shown for the three ensemble members with an extended spin-up to model year 11 000 (Fig. 2).
3.2 South Atlantic and Southern Ocean circulation
The ensemble mean fields, i.e. the averages across all 36 simulations, provide a robust estimate of the main circulation features and are used as a baseline to further test the sensitivity to individual boundary condition changes. The Southern Ocean circulation is dominated by the prevailing westerly winds that drive surface water inflow from the South Pacific in the case of an open DP (Fig. 4a). After passing the southern tip of South America, a surface current of ∼ 5 cm s−1 enters the southern South Atlantic via the Malvinas Basin and carries relatively fresh, southern-sourced surface waters along the eastern boundary northwards. Surface circulation in the narrow South Atlantic is cyclonic in the Angola Basin and anticyclonic south of the WR. Surface salinities are enhanced in the southward return flows of these small-scale gyres due to enhanced rates of evaporation at subtropical latitudes (Fig. 4c). The associated higher surface densities (Fig. 4d) enhance vertical mixing and lead to the formation of South Atlantic Intermediate Water (SAIW) offshore South America. The intermediate water formation is confined to the centre of the subtropical gyre, indicated by the local mixed-layer maximum between 30 and 40° S in Fig. 4e. Local convection shows strong seasonality, peaking during the months of July to September and disappearing during austral summer (not shown). As the WR severely limits lateral water mass exchange, the deeper Angola Basin is characterised by a sluggish circulation and is filled with a locally produced saline water mass (Fig. 4b). SAIW formed in the vicinity of the Paraná large igneous province (Fig. 4a) exits the South Atlantic via the Falkland Plateau at flow speeds of 1–2 cm s−1, mixes with Southern Ocean waters and eventually merges with the southern limb of the strong subtropical gyre circulating around India (Fig. 4b).
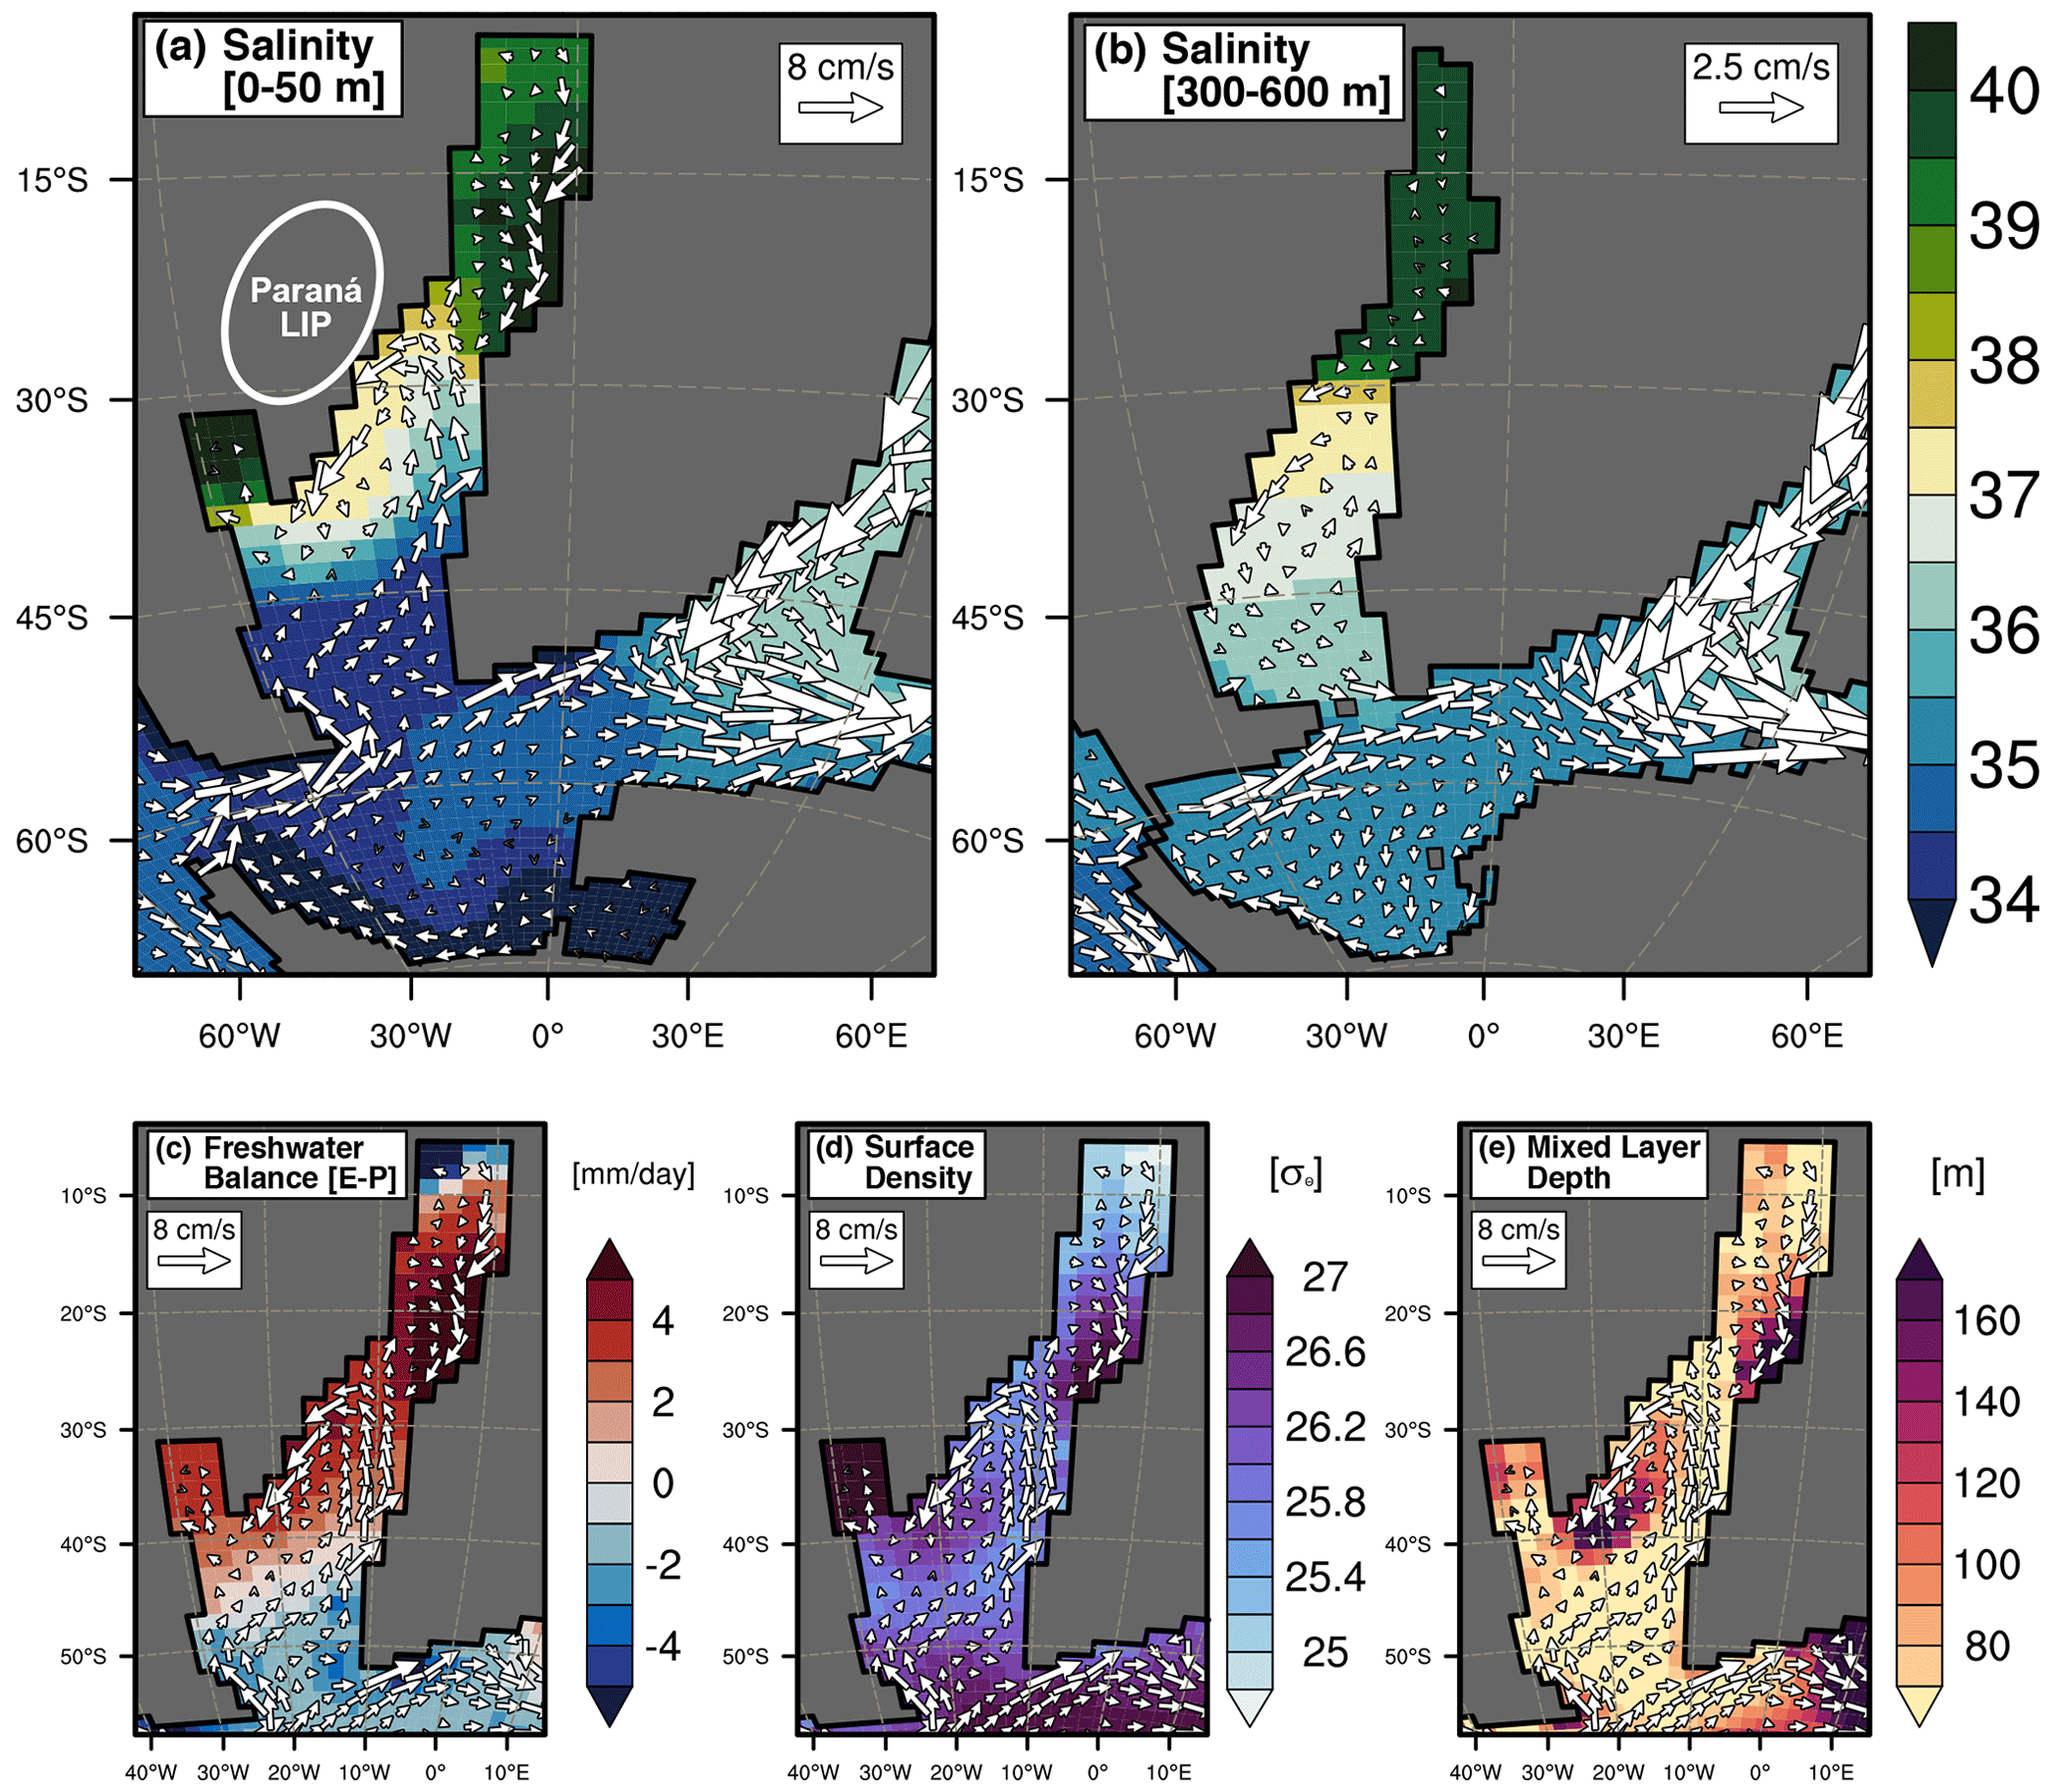
Figure 4Simulated mean ocean circulation averaged over all 36 ensemble simulations. Only grid points that represent ocean values in at least half of the simulations are shown. Panels show the annual mean ocean velocity and salinity averaged over (a) 0–50 m and (b) 300–600 m, as well as 0–50 m velocity on top of the (c) net freshwater flux from the ocean to the atmosphere, (d) sea surface density, and (e) climatological maximum monthly mean mixed-layer depth. Velocity vector length is limited to 2 times the reference magnitude for figure clarity. The white oval in panel (a) represents an approximate position of the Paraná Large Igneous Province (LIP).
3.3 Temperature and salinity
As a result of the salinity-driven intermediate water formation, the Cape–Argentine and the Angola basins both show a pronounced subsurface maximum in salinity at depths between 200 and 600 m (Fig. 5b). The deeper parts of the silled basins are filled with relatively warm and saline waters averaging around 10 °C at 3000 m in the Cape Basin and 20 °C at 1400 m in the Angola Basin. In comparison, mean bottom-water temperatures in the Southern Ocean are lower at 5.5 °C and as low as 4 °C in the global mean. The deep Cape–Argentine and Angola basins also show the largest spread in simulated temperatures and salinities across individual ensemble members (Fig. 5c–d). Zonal mean values differ by as much as 15 °C and a salinity of 5.8. Simulated uncertainties are highest in regions closest to the GBG and WR. Bottom-water temperatures drop on average by 5–7 °C in response to the opening of these gateways (Fig. 6e–f), while a doubling of the atmospheric CO2 increases temperatures by about 5 °C with a more homogeneous warming pattern (Fig. 6c). This makes ΔWR and ΔGBG the dominant control on temperature (Fig. 5e) and salinity (Fig. 5f) for the deep Angola Basin and some parts of the deep Cape–Argentine Basin, respectively. Resulting bottom-water temperatures at DSDP Site 361 (Fig. 5a) show a remarkably large range from 3.1 to 17.6 °C (Fig. 6a–b), with a mean value of 10.4 °C. The most constant temperatures with an ensemble spread below 4 °C are simulated for the upper 200 m just south of the WR. Southern Ocean temperatures are primarily controlled by CO2 (Fig. 6c), while the enhanced advection of low-salinity waters resulting from a DP opening (see Fig. S3) dominates the regional salinity variability in the Southern Ocean (Fig. 5f).
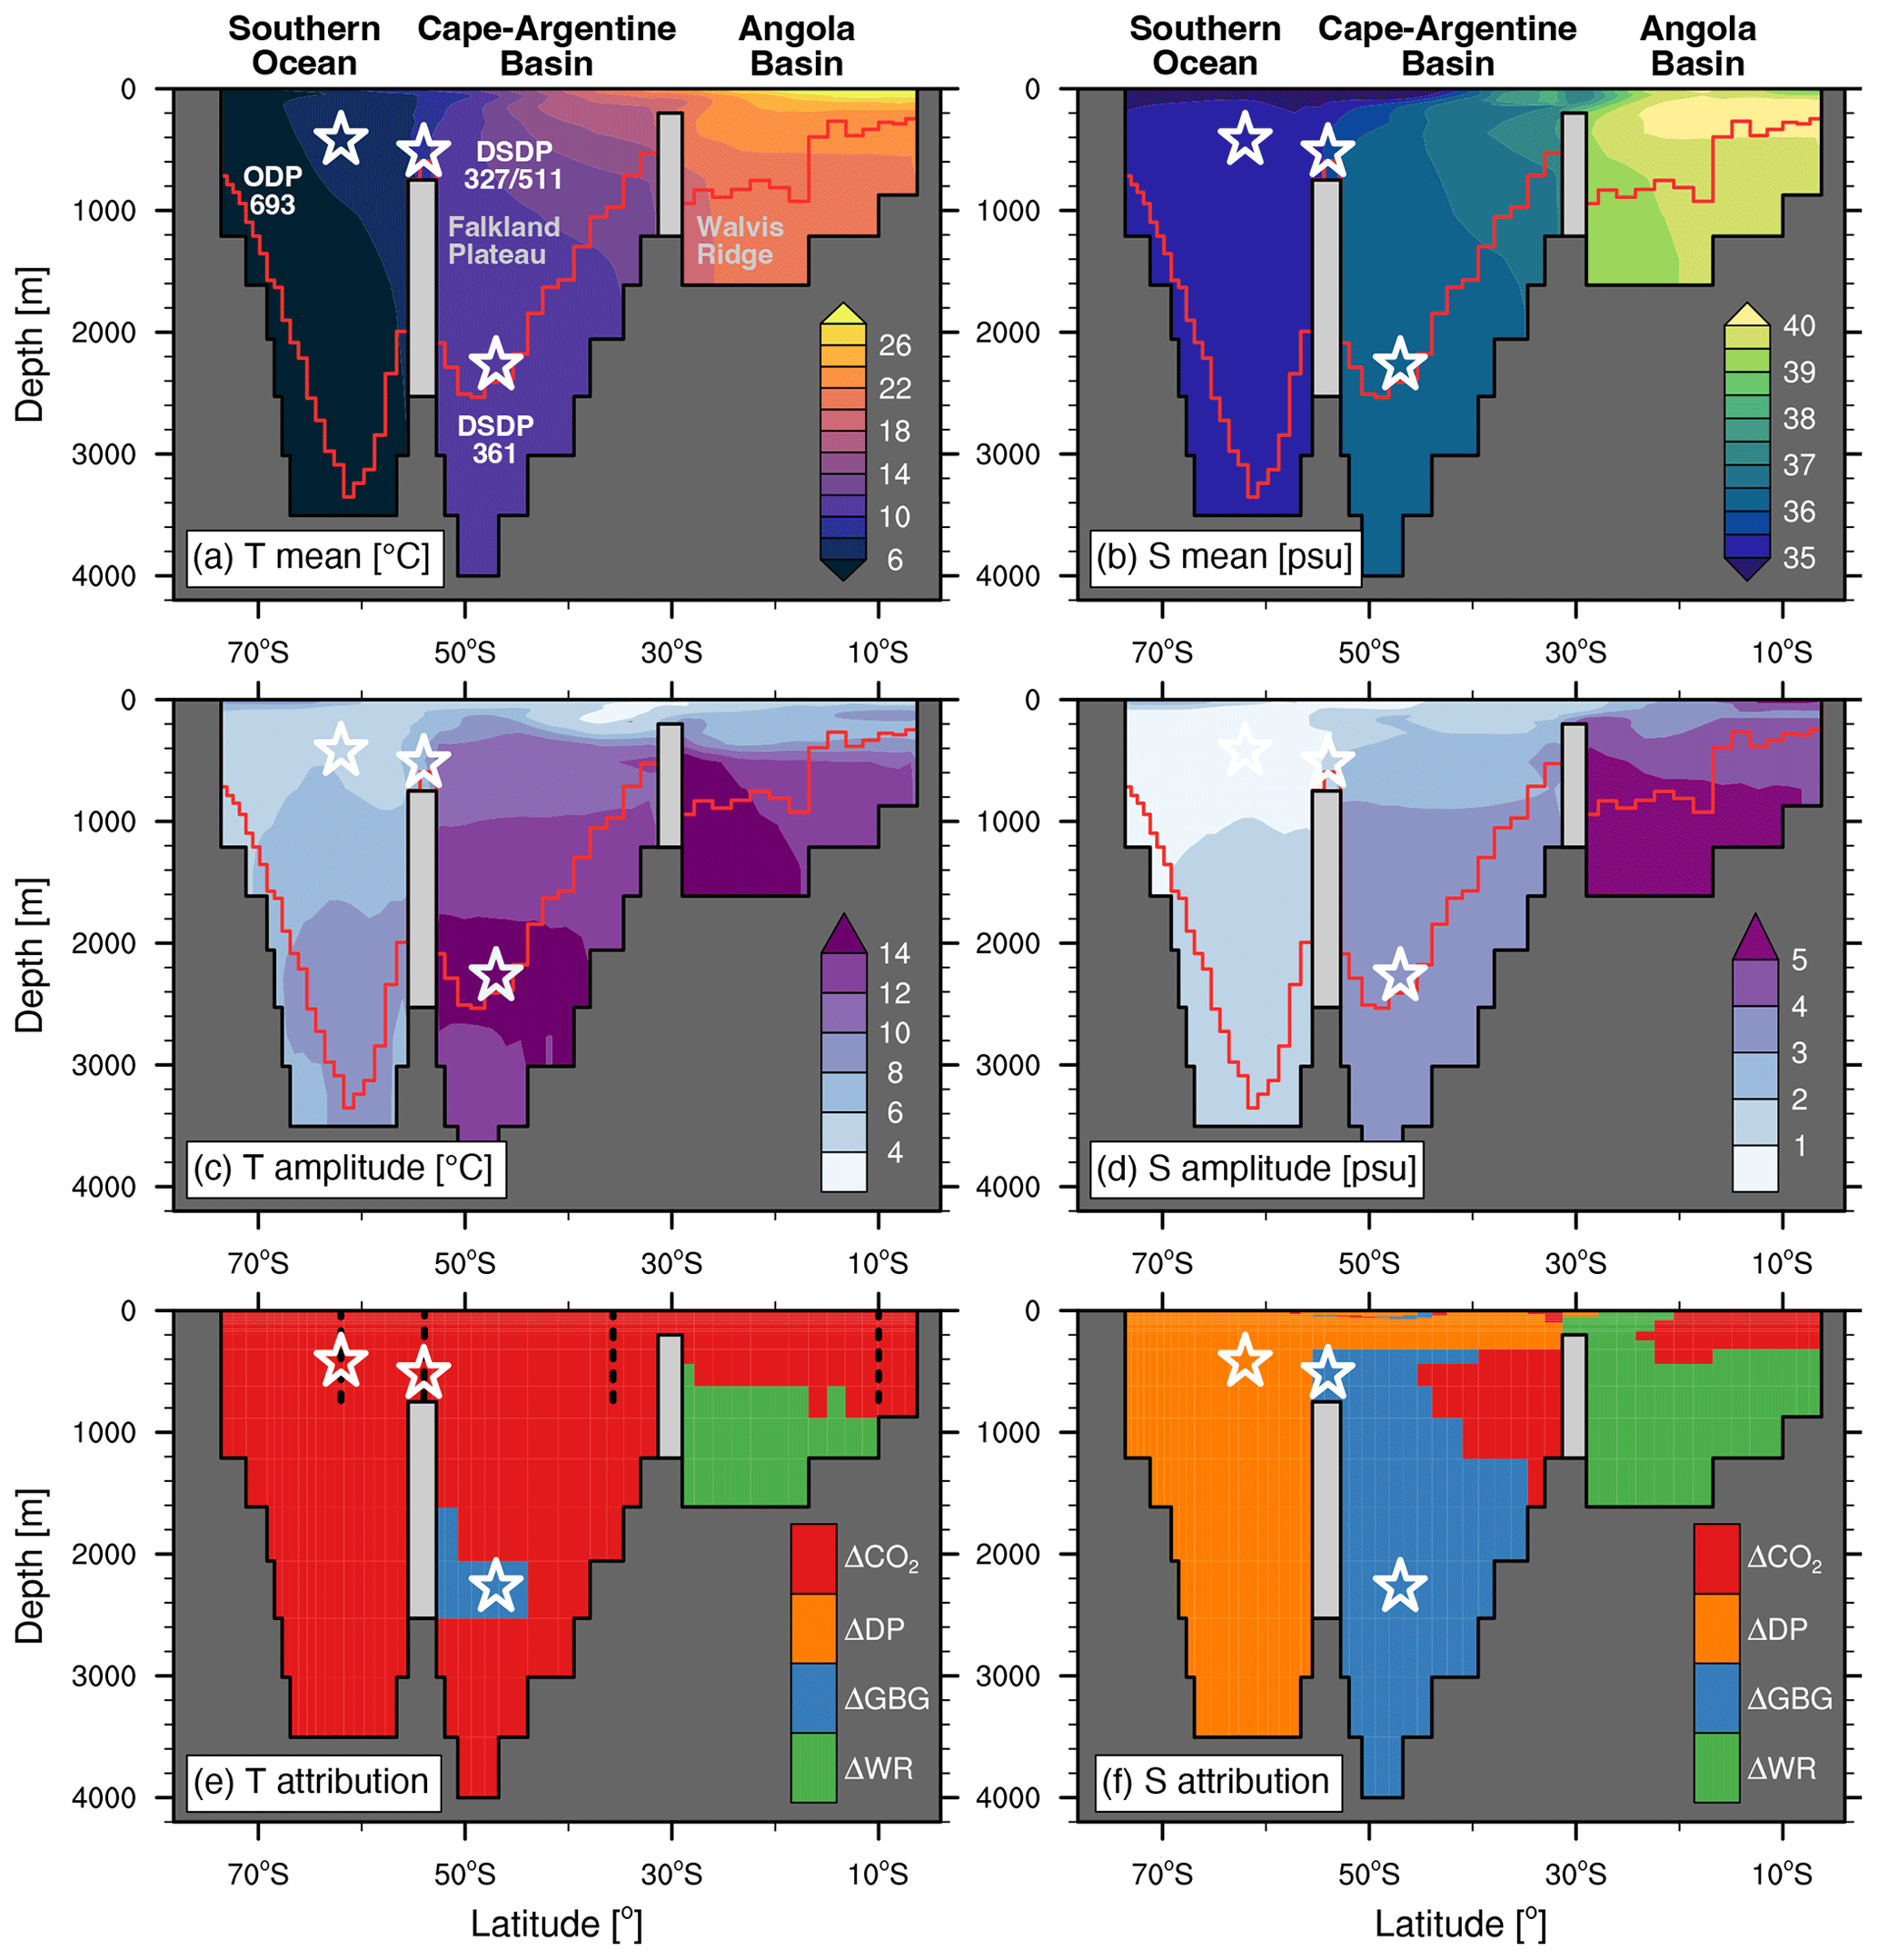
Figure 5Zonal mean sections of temperature and salinity for the South Atlantic and Southern Ocean. Values are averaged between 30 and 10° W at the Falkland Plateau and between 30° W and 0° elsewhere. Panels show the (a–b) ensemble mean, (c–d) the difference between the minimum and maximum simulated value, and (e–f) the respective process causing the largest mean change. Individual processes are defined in Sect. 2.3 and shown in Figs. 6 and S3, respectively. Red lines show average water depth at the respective latitude, and dotted lines in panel (e) indicate vertical sections analysed in Fig. 7.
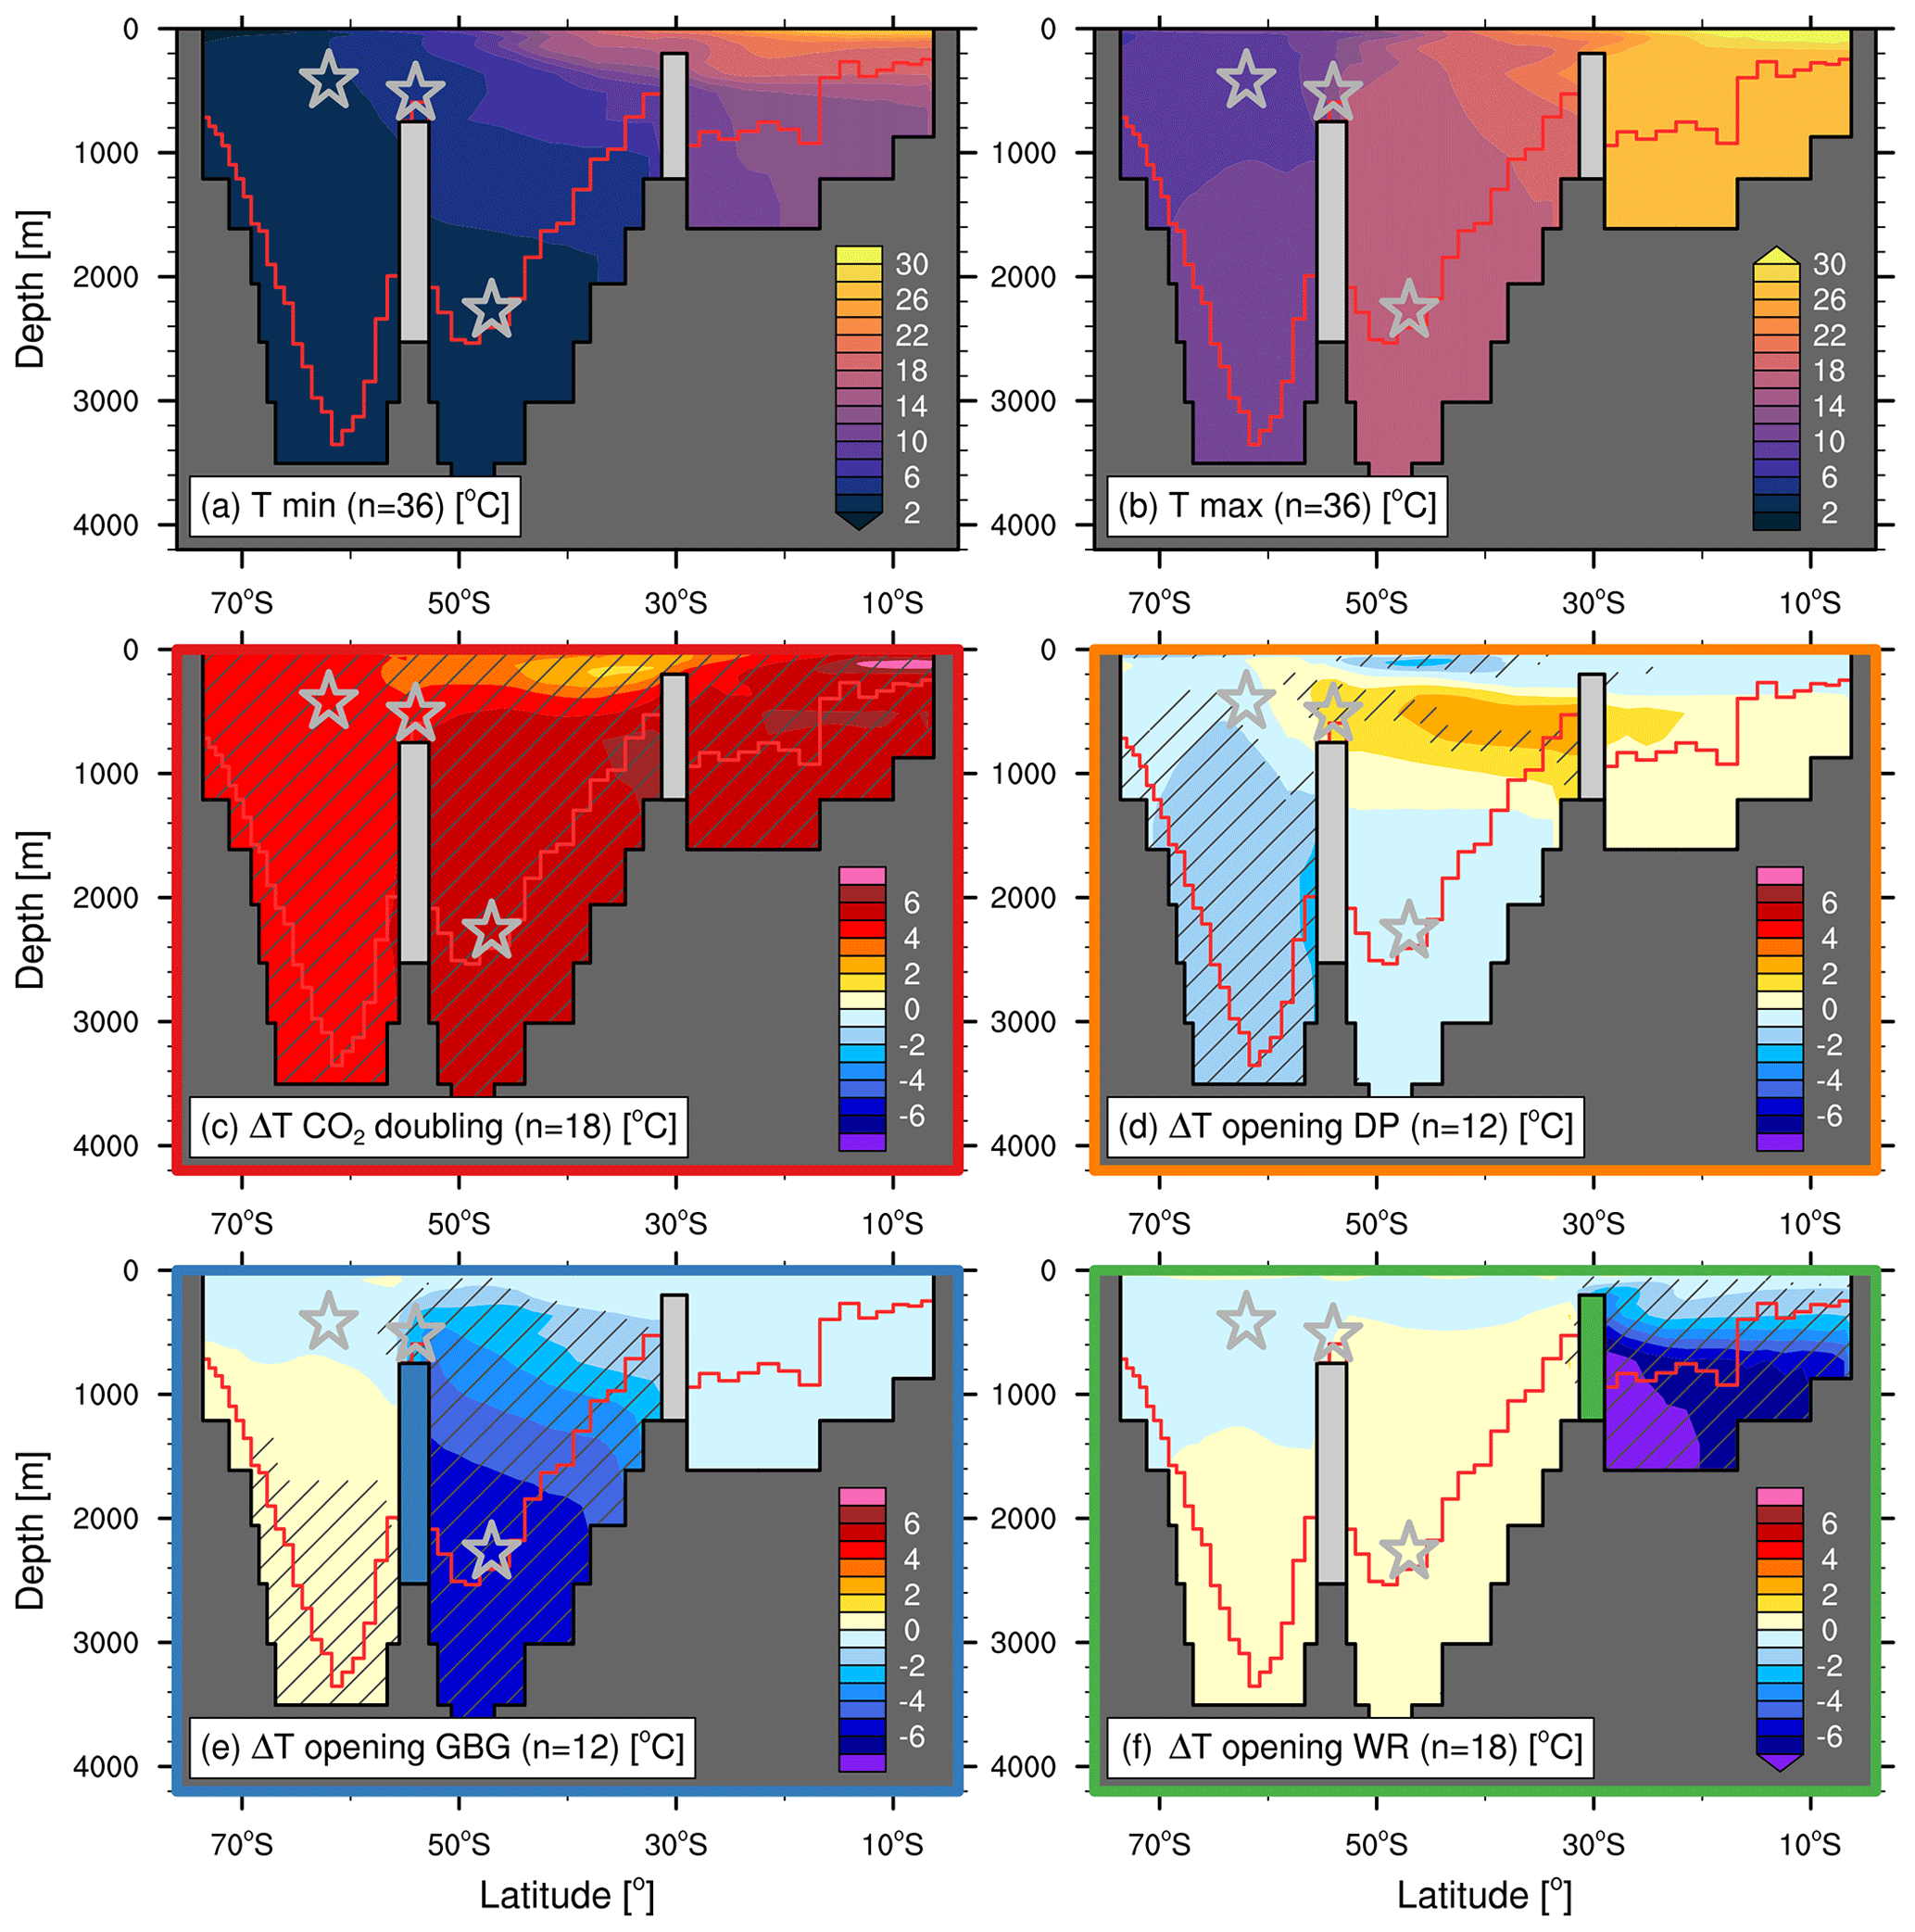
Figure 6Zonal mean temperature sections for the South Atlantic and Southern Ocean. Values are averaged between 30 and 10° W at the Falkland Plateau and between 30° W and 0° elsewhere. Panels show the (a) minimum and (b) maximum simulated value across all 36 ensemble members and (c–e) the mean change associated with the individual processes defined in Sect. 2.3. Hatching indicates areas where all the respective 12 or 18 model responses agree on the sign of the change. Red lines show the average water depth at the respective latitude.
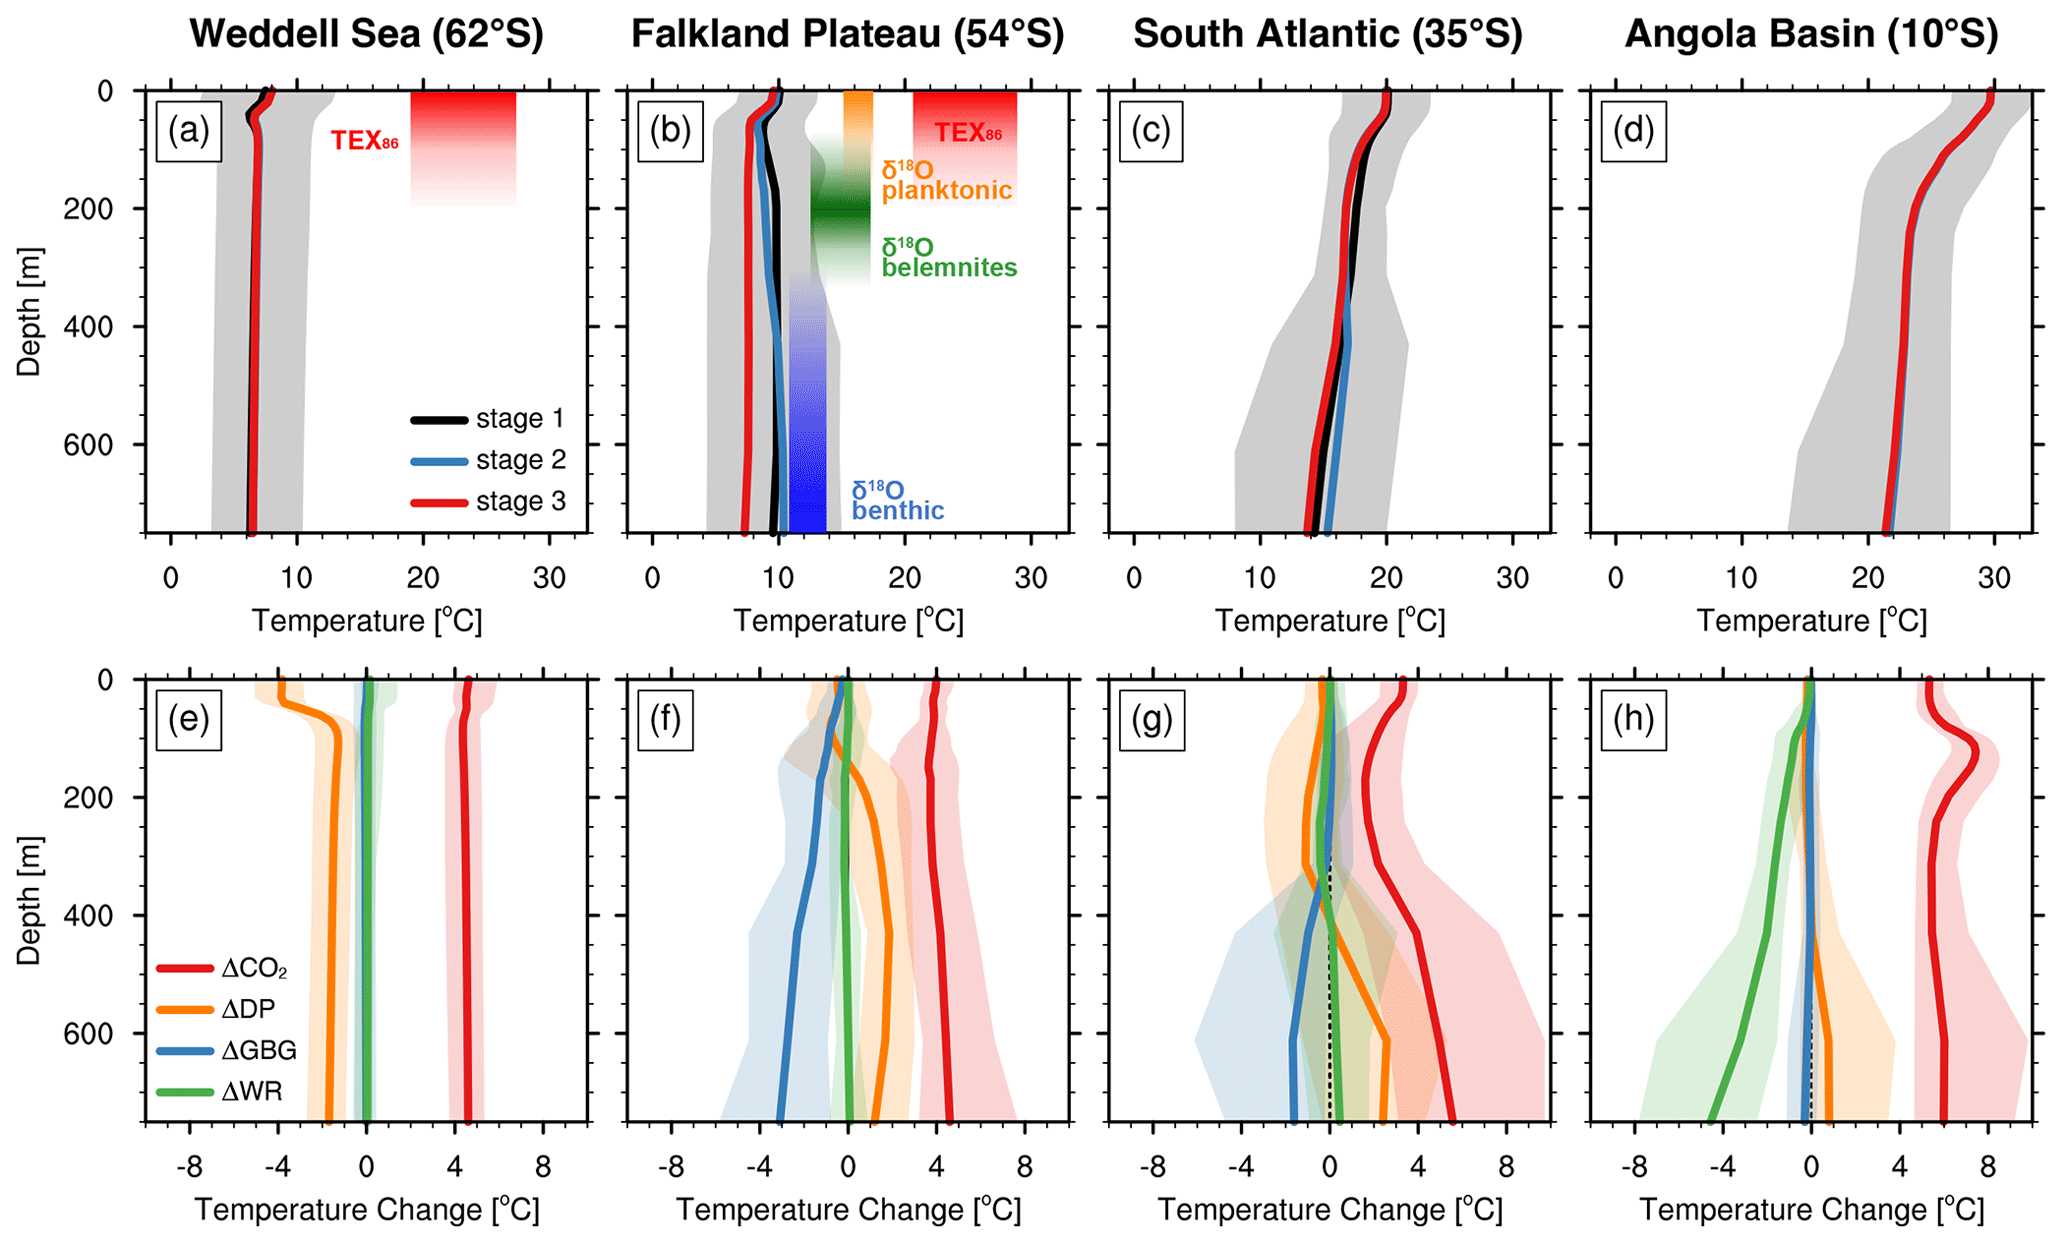
Figure 7Simulated and reconstructed ocean temperatures across the Southern Ocean and South Atlantic. Solid lines represent regional averages (areas shown in Fig. 1f), while the shading indicates the simulated maximum and minimum grid point values of the respective area across all simulations. The upper row represents the temporal changes during stages 1 to 3, while the lower row shows the respective temperature changes caused by the individual processes defined in Sect. 2.3. The area used for averaging across the Falkland Plateau basin in panels (b) and (f) moves westward for each consecutive model stage to allow comparison with the proxy record. Published ocean temperature estimates are based on TEX86 (Jenkyns et al., 2012; Steinig et al., 2020) and oxygen isotope data from foraminifera (Huber et al., 2018) and belemnites (Price and Gröcke, 2002). Minimum TEX86 temperatures are derived from a regional TEX calibration, following the discussion in (Steinig et al., 2020) and (Cavalheiro et al., 2021) for the Falkland Plateau and Weddell Sea, respectively, and are compared to maximum values from the global TEX calibration (Kim et al., 2010). All available Aptian–Albian data are included and shown as ±1 SD around the mean value at the approximate depth of signal formation. Foraminifera isotope data from the Aptian–Albian boundary interval at DSDP Site 511 are excluded due to a potential strong local freshwater influence (Huber et al., 2018).
The simulated temperature response to changing boundary conditions shows pronounced horizontal and vertical differences (Fig. 7). While ΔCO2 leads to a homogeneous warming of the upper Weddell Sea of 4–5 °C (Fig. 7e), the northern Angola Basin shows an enhanced mean subsurface warming of 7.5 °C between 100 and 200 m (Fig. 7h). In contrast, subsurface warming just south of the WR (Fig. 7g) is reduced to below 2 °C in the mean, with even a slight cooling at some grid points. The WR depth (ΔWR) only affects the Angola Basin temperatures (Fig. 7h) and salinities. The spread in simulated salinities increases considerably from south to north with values for the northern Angola Basin ranging between 36 and 42 (see Fig. S4). An open DP reduces the temperature (Fig. 7e) and salinity in the Weddell Sea throughout the water column. The sea surface temperature (SST) drop of 4 °C for ΔDP at DSDP Site 693 is of comparable magnitude as for ΔCO2. All ensemble members simulate a subsurface warming of 1–3 °C on the Falkland Plateau (200–800 m; Fig. 7f) and in the South Atlantic (400–800 m; Fig. 7g) in response to DP opening, which is caused by a higher production of warm and saline SAIW. This leads to simulated stage 2 bottom-water temperatures at DSDP Site 511 that are even slightly higher than those at the surface (Fig. 7b). The upper end of the simulated bottom-water temperatures on the Falkland Plateau coincides with palaeotemperature estimates derived from oxygen isotope data from benthic foraminifera (Huber et al., 2018) and belemnites (Price and Gröcke, 2002). Simulated SSTs range between 7 and 13 °C, while those derived from planktonic foraminifera (Huber et al., 2018) are higher by about 6 °C. Temperature estimates based on the TEX86 palaeothermometer (Jenkyns et al., 2012; Steinig et al., 2020) exceed the ensemble mean temperatures in the Weddell Sea and the Falkland Plateau by as much as 18 °C.
Vertical differences in the simulated responses of temperature and salinity influence the local water mass stratification (see Fig. S4). An open DP significantly increases Weddell Sea stratification around 50 m water depth, while it is decreased on the Falkland Plateau. On average, ΔCO2 slightly enhances upper-ocean stratification in the Weddell Sea and the South Atlantic. In the northern Angola Basin, on the other hand, higher CO2 increases especially the surface salinity and subsurface temperature, leading to a strongly reduced density stratification in the upper 100 m.
3.4 Meridional overturning circulation
We quantify basin-scale circulation differences in terms of changes in the meridional overturning circulation (MOC). Individual changes in the respective meridional and vertical velocity components are shown in Figs. S5 and S6. The ensemble mean MOC in the Cape–Argentine Basin (Fig. 8a) is dominated by the salinity-driven intermediate water formation described above. Positive values indicate northward flow at the surface, sinking at around 40° S, and a subsequent southward return flow represented by SAIW. The mean volume transport of 1.2 Sv (1 Sv = 106 m3 s−1) is limited by the basin dimensions, and its maximum is reached within the upper 200 m. Despite the large range of applied boundary conditions, all 36 ensemble members agree on the sign of this overturning in the upper 500–1000 m of the southern South Atlantic (Fig. 9a), making this SAIW cell a persistent feature across all stages (see Fig. S8). The vertical extent is limited to the Falkland Plateau sill depth, leading to highly stagnant conditions in the deeper Cape–Argentine Basin.
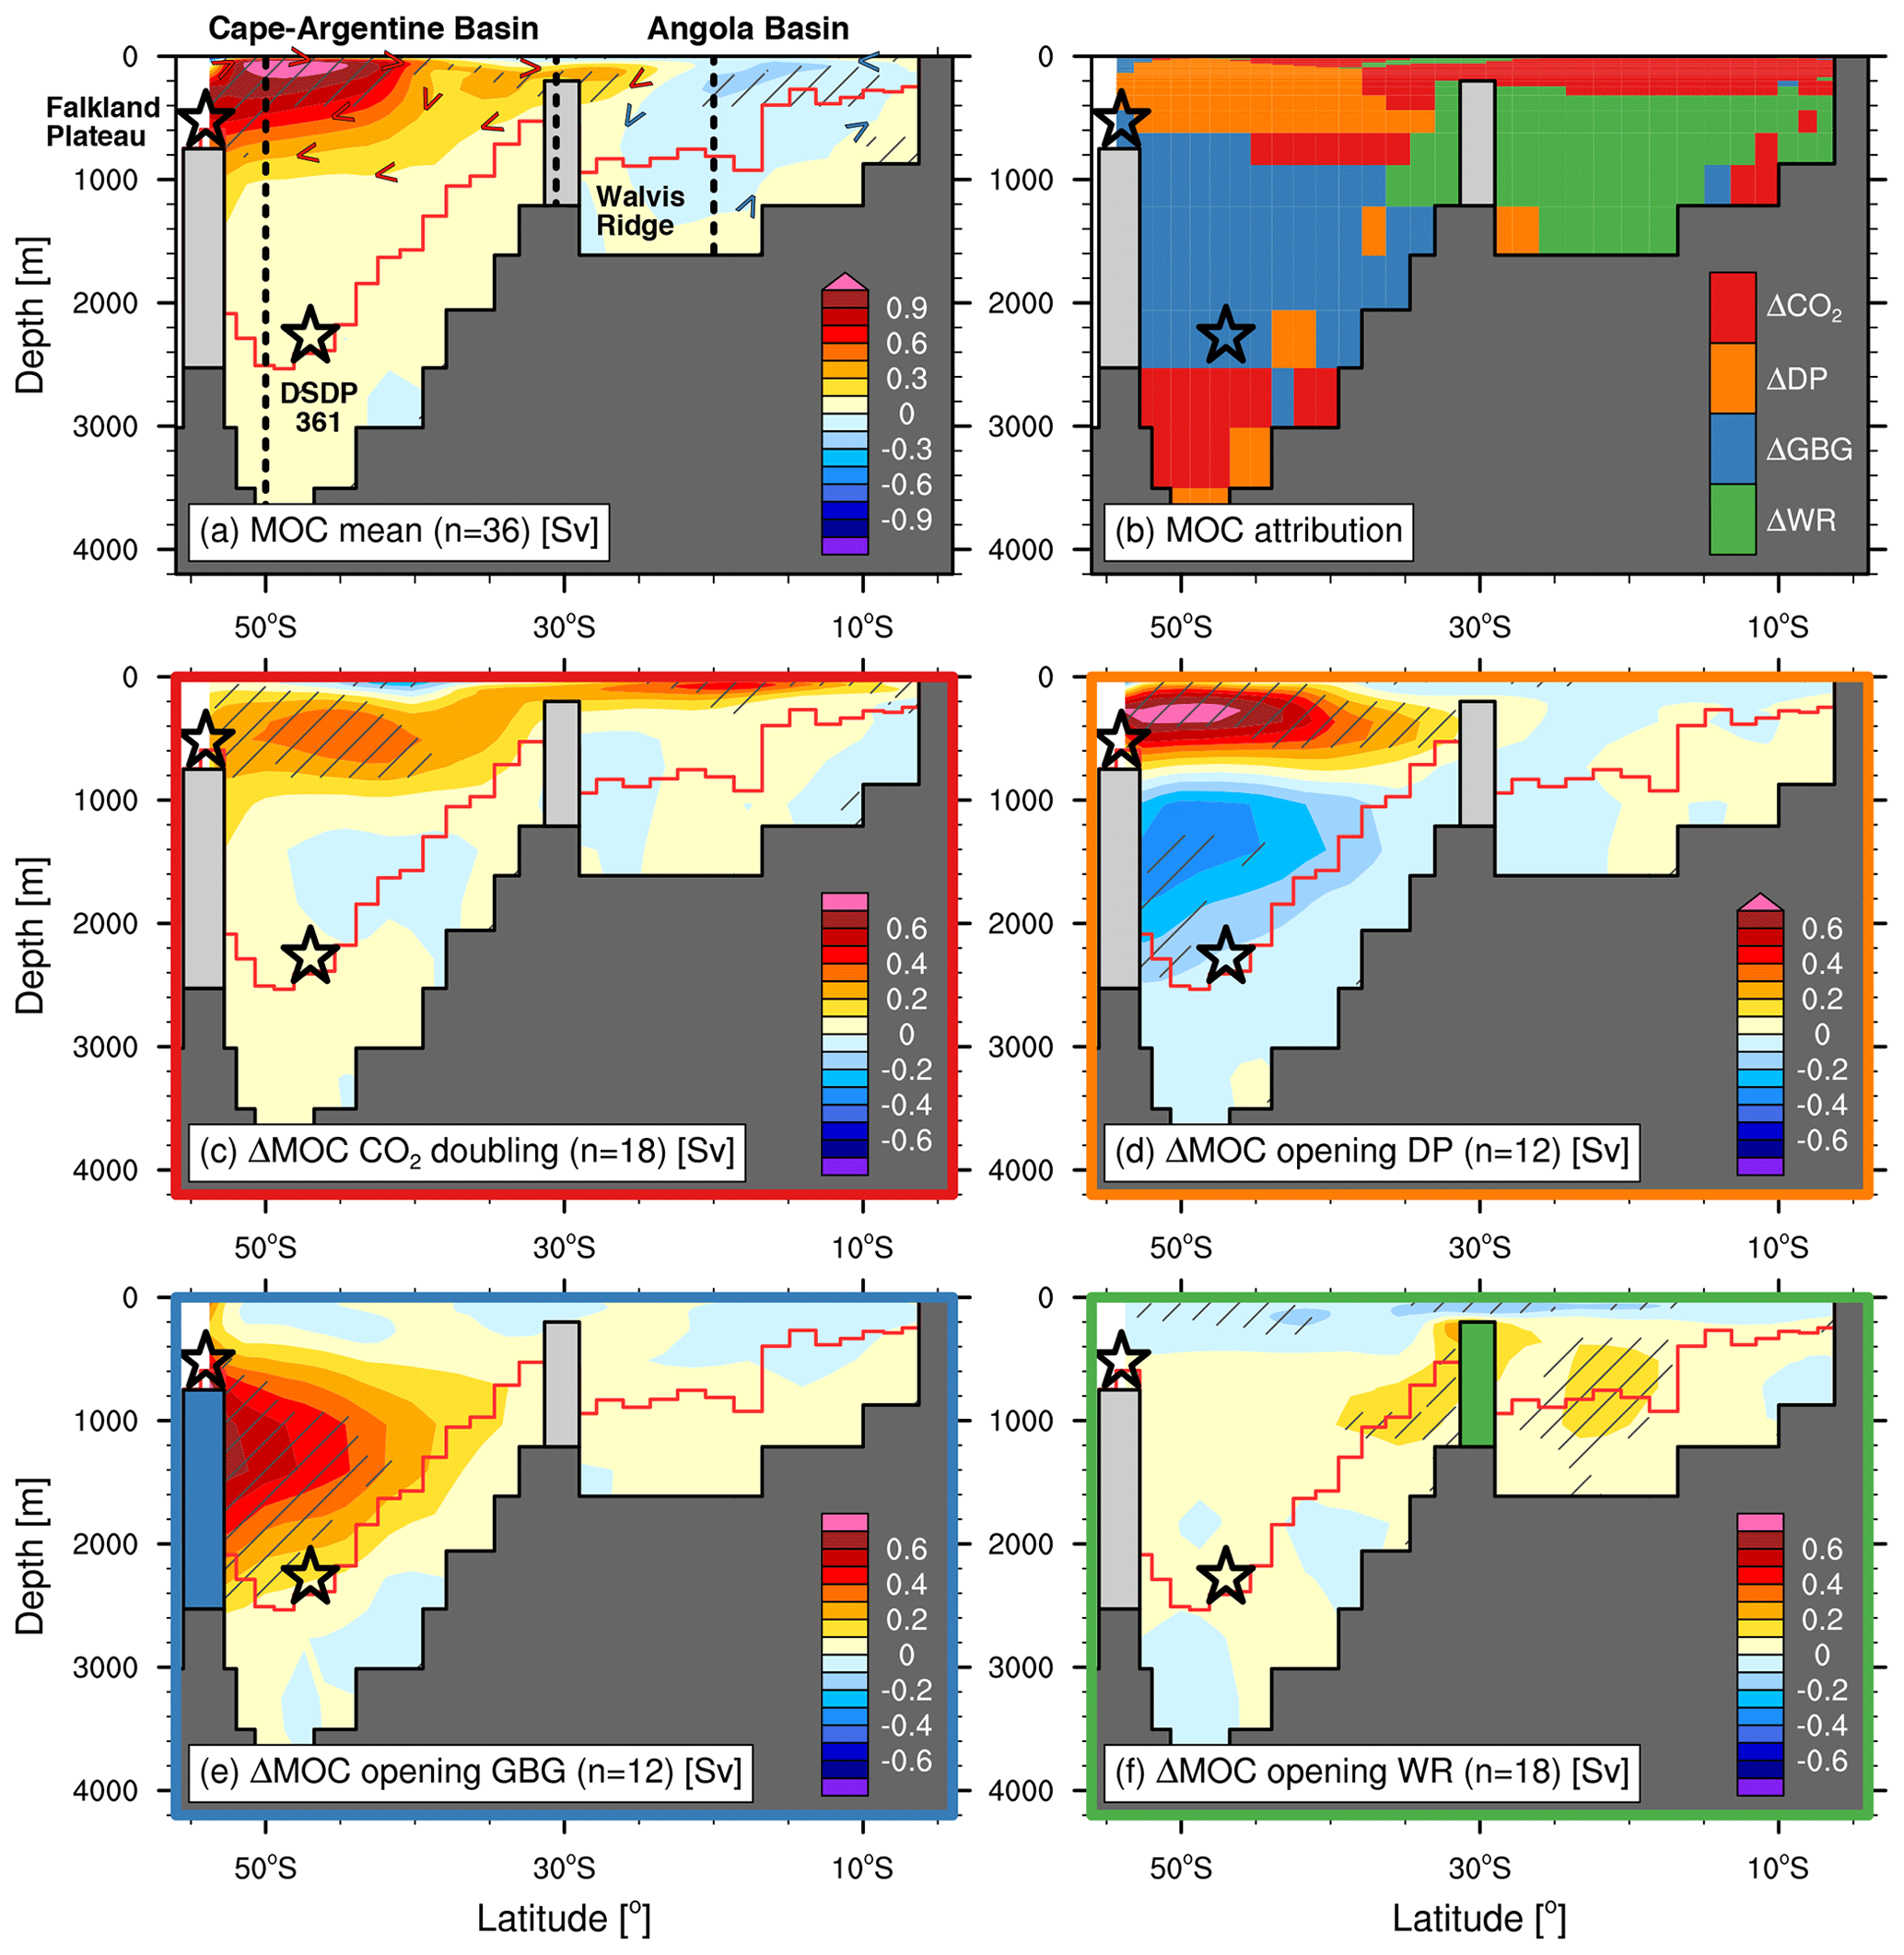
Figure 8South Atlantic meridional overturning circulation (MOC). Panels show the (a) ensemble mean, (b) the respective boundary condition resulting in the largest mean MOC change, and (c–f) individual MOC changes associated with the processes defined in Sect. 2.3. Values are in sverdrup (1 Sv = 106 m3 s−1). Positive (negative) values represent clockwise (anticlockwise) circulation. Hatching indicates regions where all ensemble members agree in terms of the sign of the circulation. Red lines show average water depth at the respective latitude. Dashed lines in panel (a) indicate vertical sections analysed in Fig. 9.
Further to the north, the WR cuts off the Angola Basin from the SAIW cell. Mean overturning in the Angola Basin is weak but driven by the evaporative formation of dense waters just north of the WR (Fig. 4d) and upwelling at its northern end. The saline and dense water filling the restricted Angola Basin eventually spills over the WR into the southern South Atlantic. This Walvis Ridge Overflow Water (WROW) is the densest water mass in the South Atlantic at the time and reaches the deepest parts of the Cape–Argentine Basin (Fig. 10), even for a shallow WR. Depth-integrated volume transport across the WR is weak and does not exceed 0.7 Sv (Fig. 9b), but it is always directed southward, i.e. export into the southern South Atlantic, for the densest water in the bottom layer (Fig. 10c, f). The circulation in the upper 200 m of the Angola Basin is highly sensitive to ΔCO2 (Fig. 9f). The northern end of the Angola Basin during stages 2 and 3 reaches the tropical regions (Fig. 1d, e), leading to locally enhanced precipitation rates and river runoff (Fig. 4c). This net surface freshwater input decreases the surface density and limits vertical mixing in the northern part of the basin at 600 ppmv CO2. The doubling of CO2 increases evaporation rates and, surprisingly, also reduces local precipitation (see Fig. S7). Evaporation in the northernmost Angola Basin strongly exceeds precipitation at 1200 ppmv CO2, while precipitation dominates at 600 ppmv CO2 north of 10° S (Fig. 11c, d). The resulting increased surface salinities at higher CO2 lead to denser surface waters and enable a shallow and clockwise MOC (Fig. 8c) associated with enhanced subsurface temperatures between 100 and 200 m depth (Fig. 7h) and a reduced density stratification. In contrast, the smaller Angola Basin during stage 1 is rather insensitive to freshwater balance changes (Fig. 11b). We note that the MOC anomalies associated with individual boundary condition changes in Fig. 8c–f are average changes across all 12 or 18 ensemble pairs, respectively. An analysis of whether these anomalies actually lead to a change in the sign of the overturning circulation between individual ensemble pairs, i.e. leading to a reversal of the circulation direction, is shown in Fig. S9.
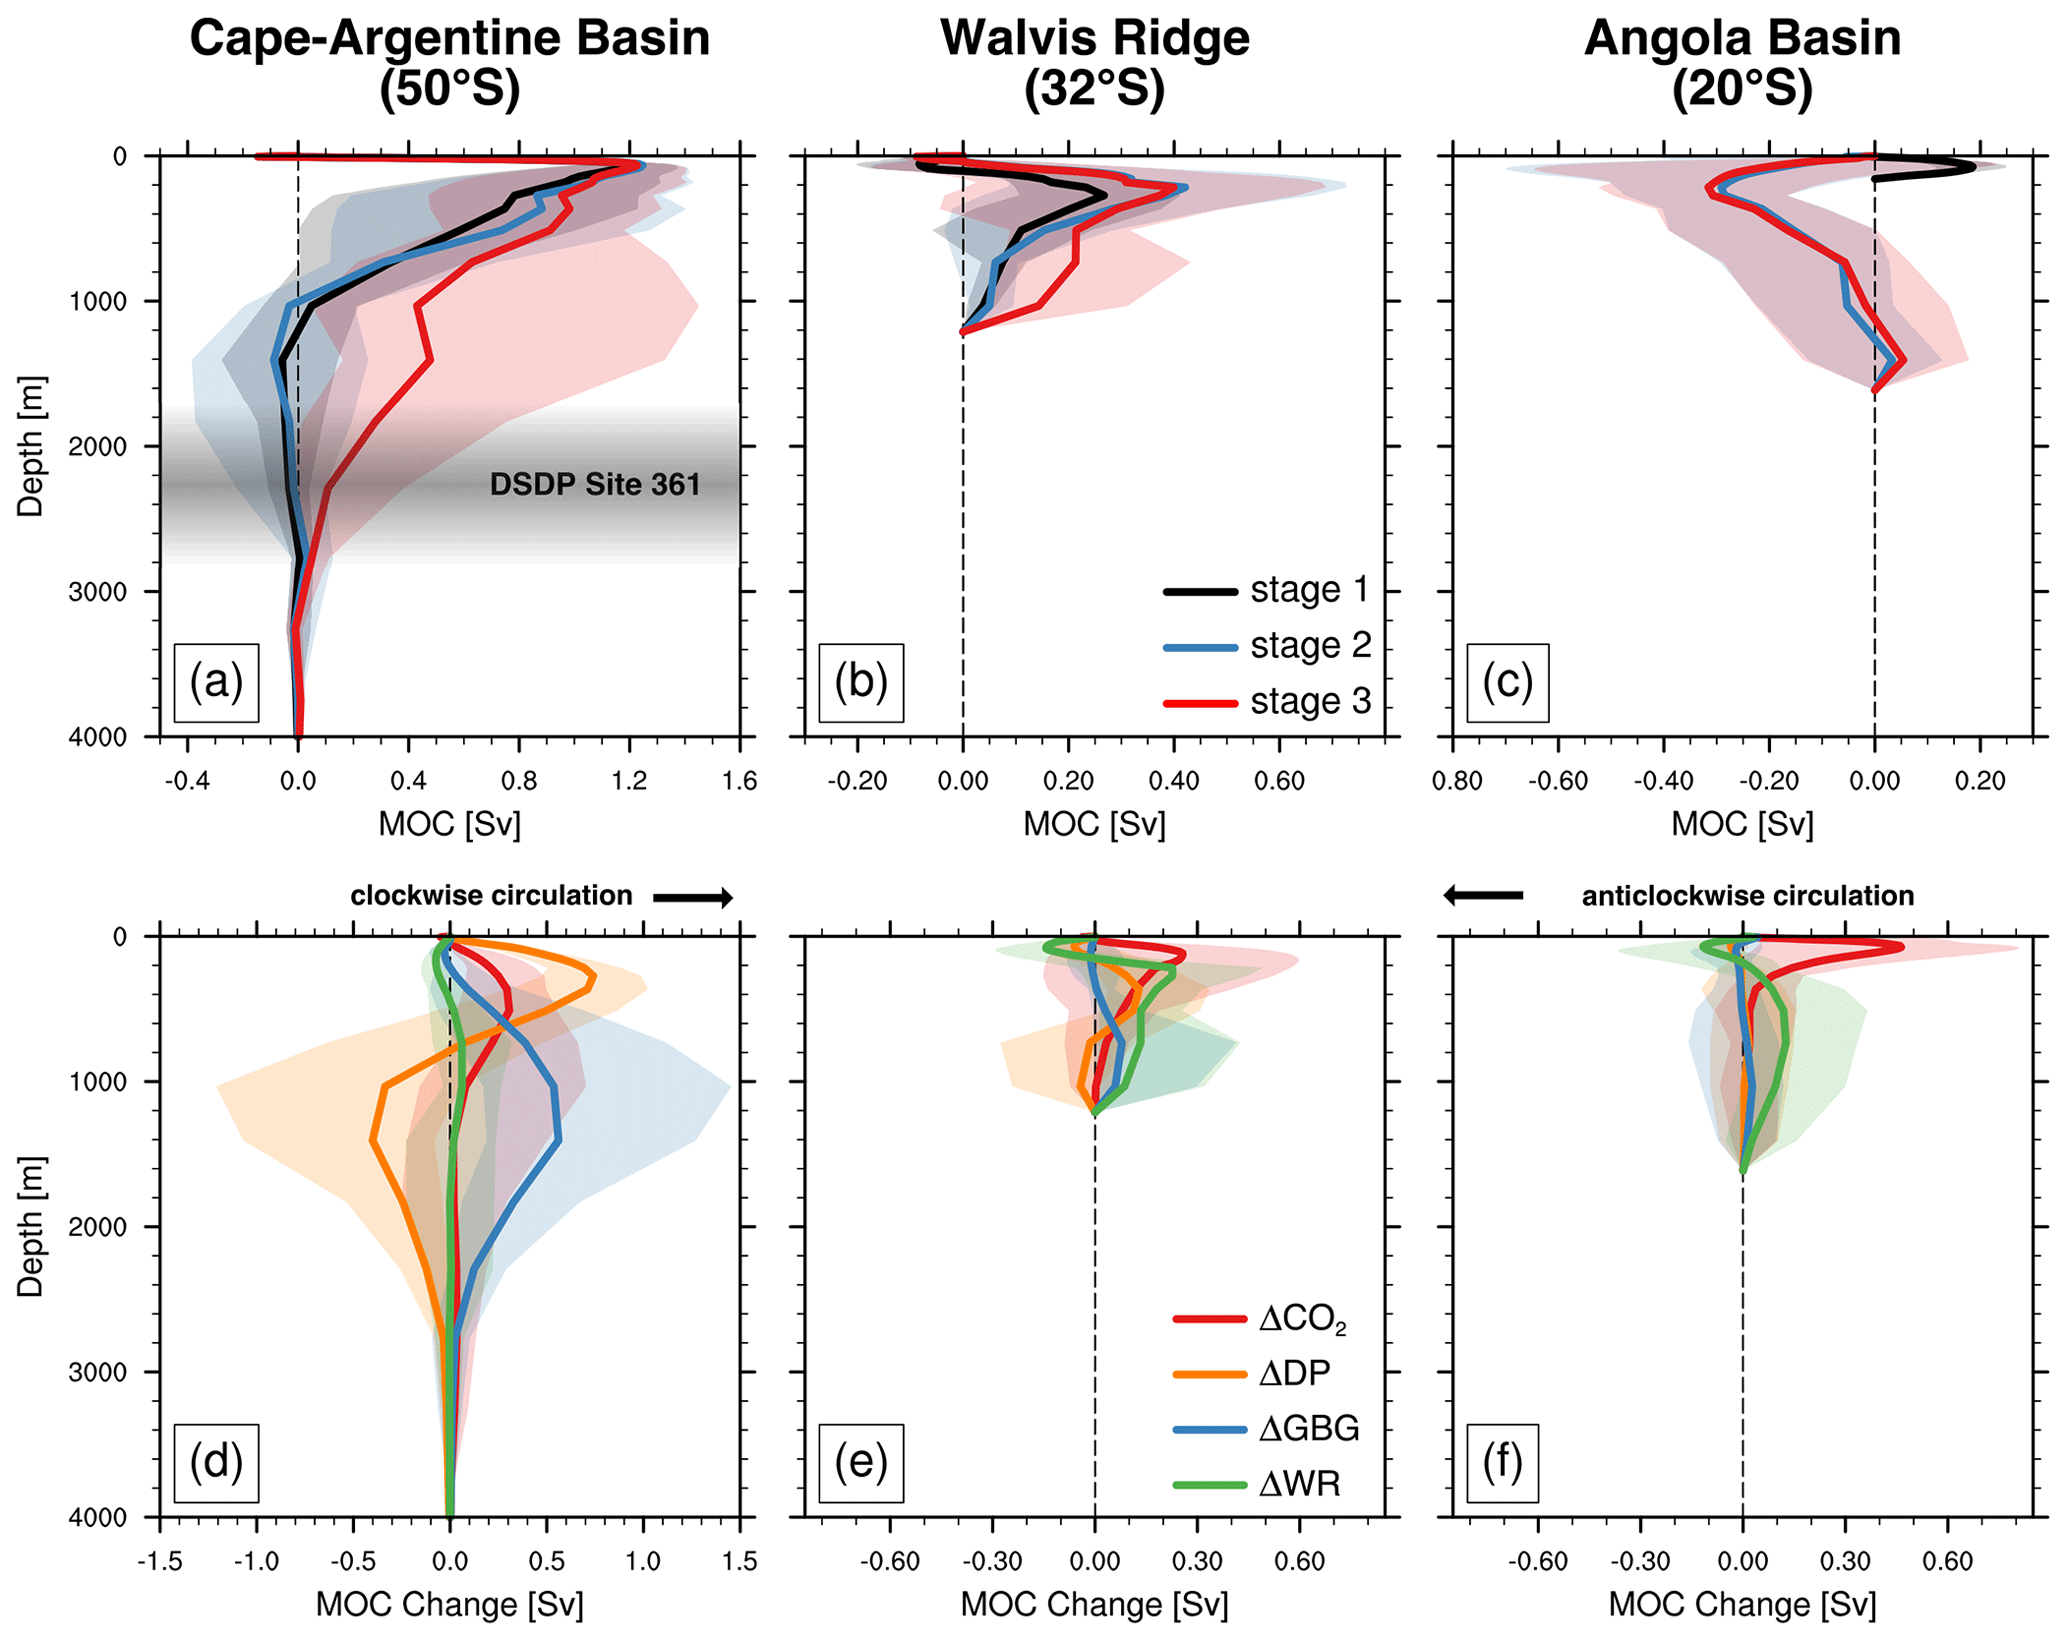
Figure 9Profiles of the South Atlantic meridional overturning circulation (MOC). Profiles are shown for (a, d) 50° S, (b, e) 32° S, and (c, f) 20° S (see Fig. 8a). The upper row represents the temporal changes associated with stages 1 to 3, while the lower row shows the respective MOC changes caused by the individual processes defined in Sect. 2.3. Shading represents the respective ensemble spread, with the ensemble mean indicated by solid lines. Values are in sverdrup (1 Sv = 106 m3 s−1). Positive (negative) values represent clockwise (anticlockwise) circulation.
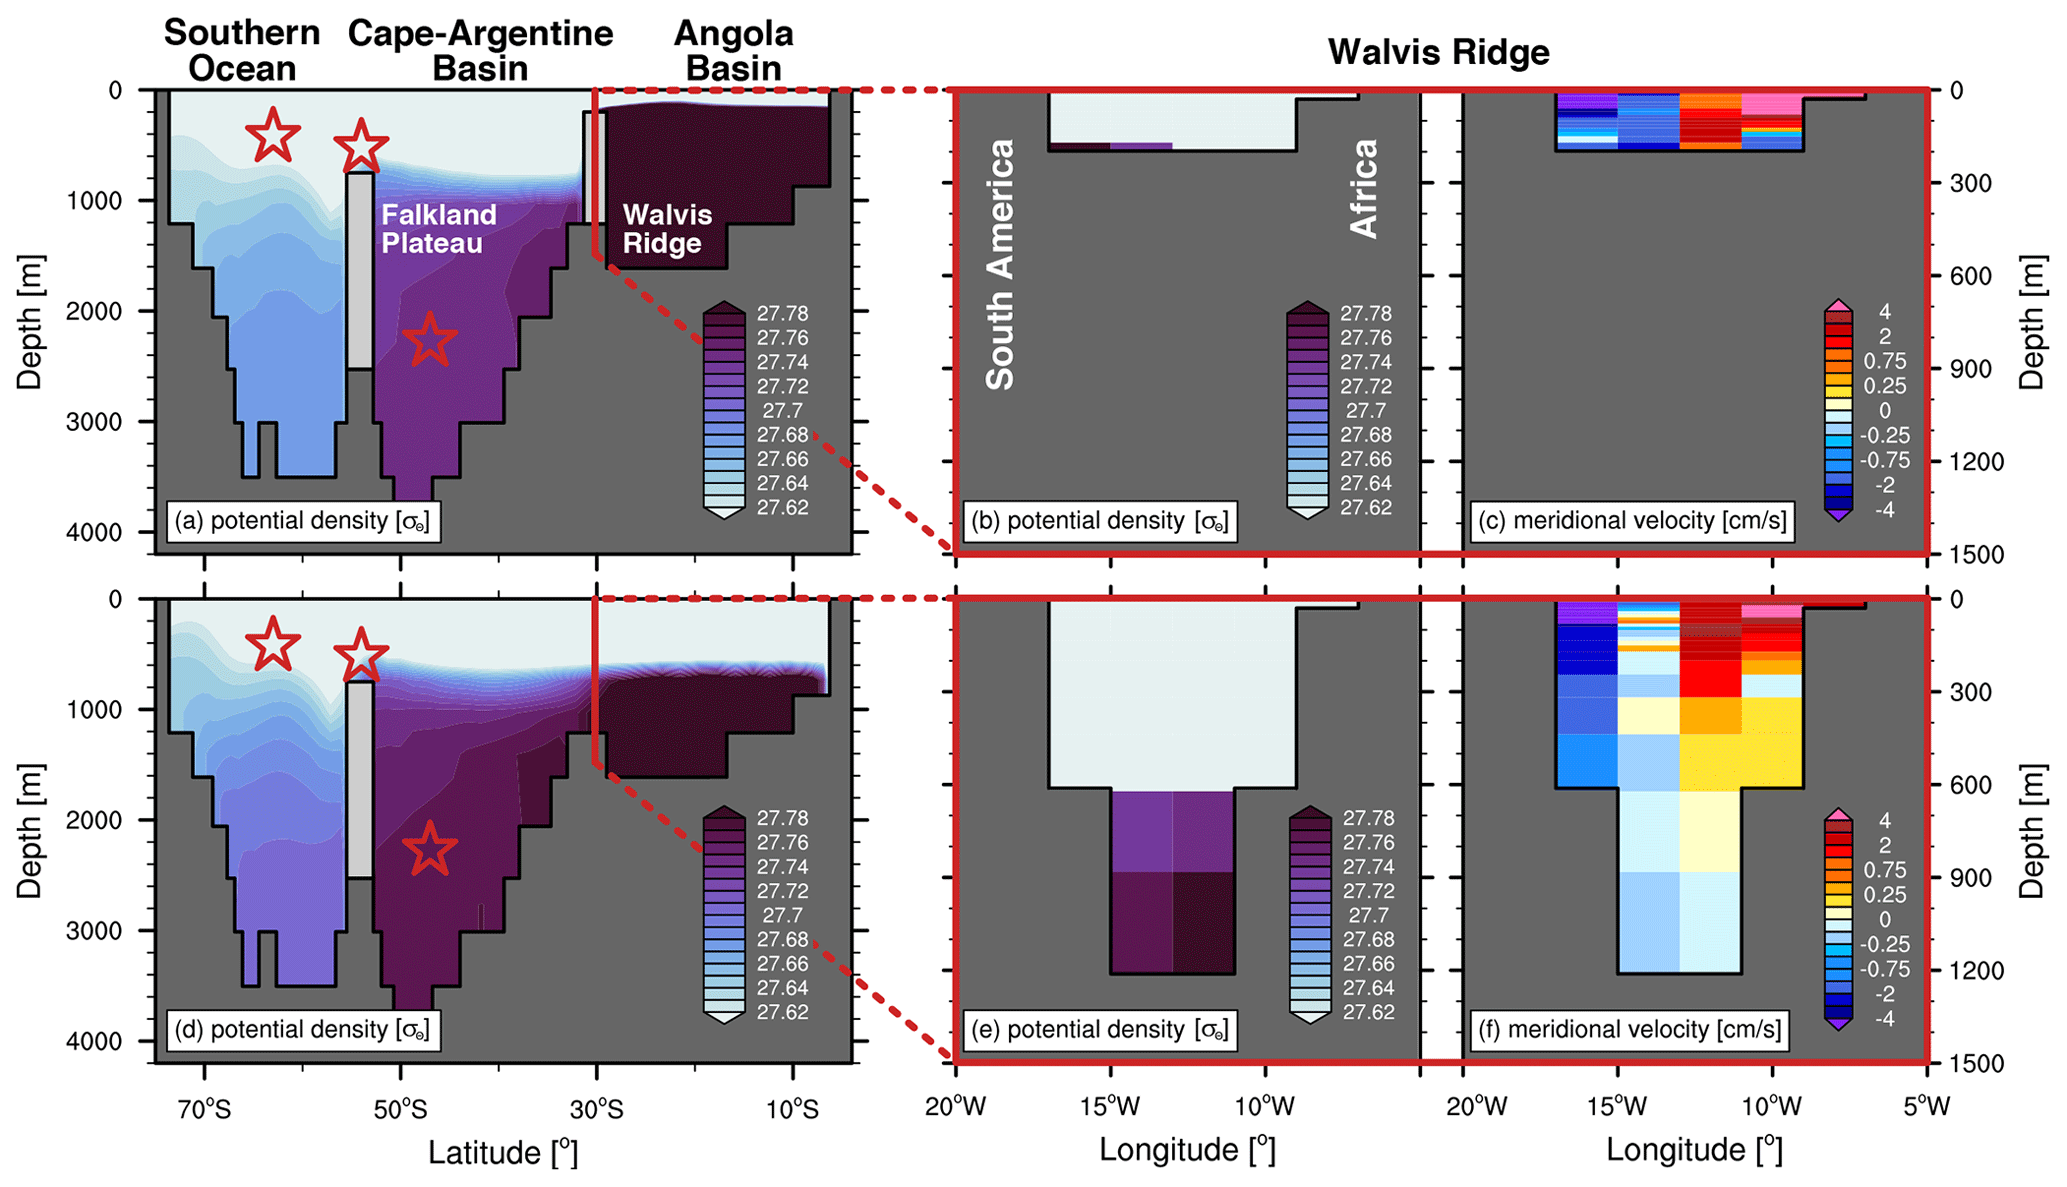
Figure 10Export of Walvis Ridge Overflow Water (WROW). Panels show the stage 2 ensemble mean (a, d) zonal mean potential density, as well as the (b, e) potential density and (c, f) meridional velocity across the Walvis Ridge. The upper row is averaged across the six ensemble members with a 200 m deep Walvis Ridge; the lower row shows results for the six ensemble members with a 1200 m water depth of the Walvis Ridge. Zonal mean values are averaged between 30 and 10° W at the Falkland Plateau and between 30° W and 0° elsewhere. The colour map for potential density only shows a small range of the data to focus on the WROW density interval. The contour intervals for the meridional velocity are nonlinear.
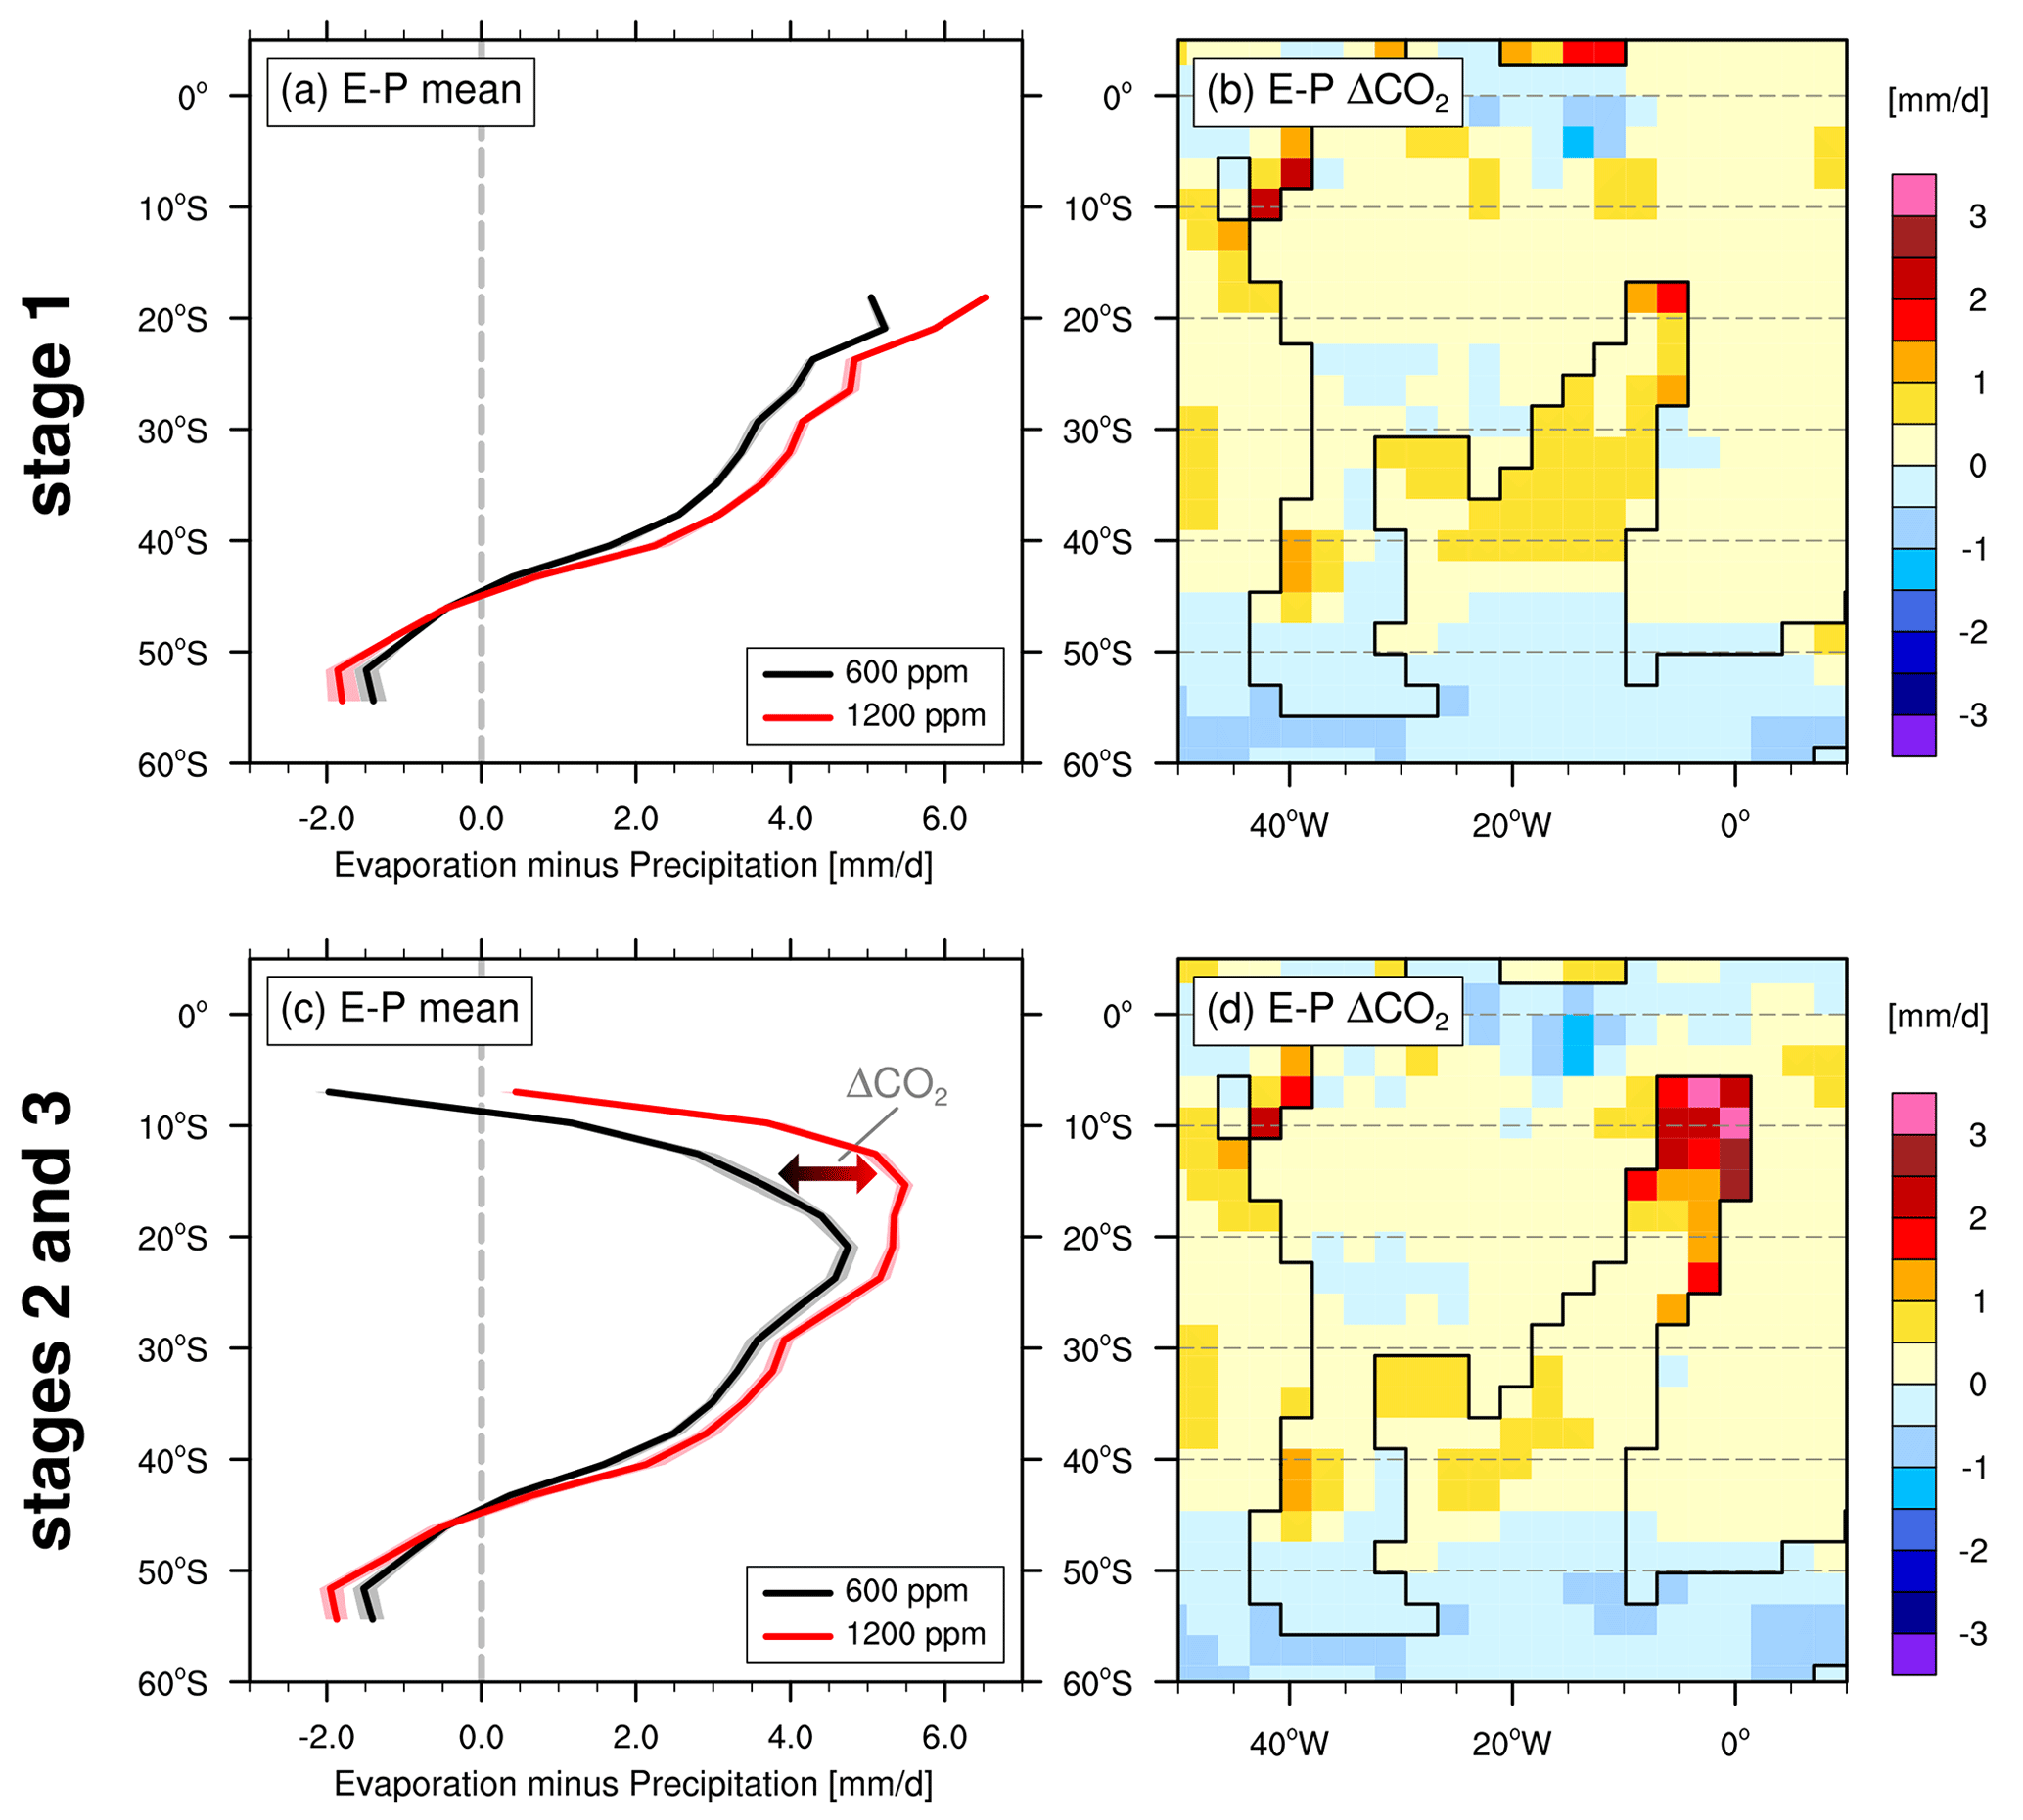
Figure 11South Atlantic freshwater balance. (a, c) Annual mean fluxes of evaporation minus precipitation zonally averaged over the South Atlantic (ocean only) and grouped by atmospheric CO2 concentration for the two different basin geometries. Solid lines represent the ensemble mean of all (a) n=6 and (c) n=12 experiments, with the ensemble spread indicated by the shading around the mean. (b, d) Maps of annual mean ΔCO2; i.e. the average change in the freshwater balance that is due to a doubling of atmospheric CO2. Positive values indicate a net freshwater flux from the ocean to the atmosphere. Global fields of precipitation and evaporation are shown in Fig. S7.
As the regional overturning is driven by strong evaporation, the doubling of CO2 leads to an overall amplification and downward extension of the SAIW cell (Fig. 8c). The opening of the DP creates the largest change in the upper-ocean MOC (Fig. 8b), with a mean increase of 0.7 Sv between 200 and 400 m (Fig. 8d). The largest change in the MOC in the deeper Cape–Argentine Basin is simulated for the opening of the GBG (Fig. 8b) as the positive SAIW cell during stage 3 extends down to the new maximum sill depth of 2500 m (Fig. 8e). The response to ΔGBG is positive for all ensemble members (Fig. 9d), but the ensemble spread is large. The strength of the stage 3 deep cell in the South Atlantic is significantly reduced for an open DP (Fig. 9d). Overall, the total southward volume transport of 0.3 Sv (range from 0.1–0.8 Sv) for depths below 2000 m is very low. WROW export increases for stage 3 (Fig. 9b) as this dense water mass contributes to the enhanced South Atlantic deep-water exchange.
Our ensemble approach reveals a fundamental control of the applied boundary conditions on the simulated regional circulation, while their relative contributions vary considerably between individual basins. Furthermore, we show that the simulated response to a forcing factor, e.g. ΔCO2, can be highly sensitive to the respective mean state and study region. In the following, we will discuss the dominant controls on the simulated circulation in two key regions and assess potential implications for the interpretation of local proxy records. In the end, we compare the analysed physical mechanisms with the proposed gateway opening and carbon burial history presented in Dummann et al. (2020).
4.1 Angola Basin sensitivity to atmospheric CO2
Strong evaporation and resulting elevated surface densities drive the local overturning circulation in the restricted Angola Basin. The highest surface densities and intermediate water formation are simulated just north of the Walvis Ridge between 20 and 25° S because local precipitation gradually increases towards the Intertropical Convergence Zone (ITCZ). This is consistent throughout all simulations and in agreement with simulated Early Albian mixed-layer depths in Uenzelmann-Neben et al. (2017). Ensemble members with more restricted basin geometries indicate that the entire basin, except for a thin surface layer, was filled with this dense water mass with maximum salinities exceeding 42. This agrees with biomarker reconstructions indicating a hypersaline environment (S>40) for large parts of the water column during the Aptian (Naafs and Pancost, 2014; Behrooz et al., 2018). While the applied WR depth influences absolute temperatures and salinities in the deeper parts of the Angola Basin, we find a dominant control of atmospheric CO2 on the circulation and related water column stratification for the upper 200 m during stages 2 and 3. These two later stages represent an Early Albian Angola Basin geometry with a northern extent up to 6° S (Sewall et al., 2007). Local precipitation exceeds evaporation in this part of the basin, which leads to locally reduced surface salinities and densities. Enhanced river runoff from tropical Africa amplifies the net surface freshwater gain, leading to an estuarine circulation with a southward surface flow in the low CO2 simulations. A somewhat surprising result is that the doubling of atmospheric CO2 does not only increase evaporation over the ocean but also reduces local precipitation over the northernmost grid points of the Angola Basin, resulting in a switch from a previously precipitation- to now evaporation-dominated region in response to a CO2 doubling. This is different compared to the “dry gets drier, wet gets wetter” pattern simulated for most of the ocean surface (Fig. S7). In our simulations, the northern Angola Basin is located at the southern edge of the ITCZ. An increase in CO2 leads to a narrowing of the ITCZ and therefore a reduction in local precipitation over the Angola Basin. The drier conditions further increase the positive evaporation–precipitation balance over the entire Angola Basin but particularly in the northern part. The higher surface densities drive a shallow, anti-estuarine circulation in the upper 100–200 m. The resulting increased mixing of heat and freshwater into the subsurface in turn diminishes the vertical density gradient in the northern Angola Basin.
Due to the restricted circulation, the magnitude of these stratification changes also depends on the strength of local river runoff and resulting surface freshening. While the ensemble mean salinity in the southern Angola Basin exceeds 40, it is reduced to 38–39 at its northern boundary. Chaboureau et al. (2012) show that this north–south gradient can increase sharply for a narrower Late Aptian basin geometry, elevated orography, or changed freshwater routing, with minimum surface salinities of as low as 20. This implies that our simulated influence river runoff on the northernmost basin is a conservative estimate. The proposed mechanism and its influence on upper-ocean stratification may therefore have been even more important during earlier, narrower stages of basin evolution. In support of that, Pérez-Díaz and Eagles (2017) showed that, within the reported uncertainty ranges, seafloor spreading in the Angola Basin could have reached latitudes of about 10° S as early as 120 Ma.
The sensitivity of local water column stratification to atmospheric changes has the potential to influence the reported Aptian black shale deposition (Stein et al., 1986; Bralower et al., 1994; Naafs and Pancost, 2014). Importantly, the proposed mechanism leads to an increased stratification in the Angola Basin at lower CO2 concentrations, contrary to the results simulated for the other basins. Behrooz et al. (2018) showed that organic carbon burial in the Angola Basin exhibits a pronounced cyclicity and concluded that orbitally driven variations in the hydrological cycle caused changes in nutrient availability and upper-ocean stratification that ultimately controlled local black shale deposition. Orbital variability also had the potential to trigger cyclic changes in the local oxygenation state of the Cretaceous Atlantic Ocean, driven by variations in the high-latitude deep-water formation and resulting background oxygen levels of the global ocean (Sarr et al., 2022). These changes in the local ocean ventilation had the potential to cause transient episodes of dysoxic to anoxic bottom waters and enhanced carbon burial. In addition, we show that similar changes in environmental conditions can also be caused by variations in atmospheric CO2. Wallmann et al. (2019) demonstrated that oscillations of atmospheric CO2 at a similar amplitude to that used in our study, although for a different mid-Cretaceous continental configuration, could arise entirely internally and be driven by a marine redox seesaw. This would provide a mechanism for changes in water column stratification and ventilation in the Angola Basin in addition to orbitally driven changes.
Our results add to the idea of a dominant influence of atmospheric dynamics on Early Cretaceous marine black shale deposition (Wagner et al., 2013). We show that the simulated turnover in upper-ocean circulation and stratification can be explained by large-scale shifts in the atmospheric circulation and a northward migration of tropical precipitation driven by atmospheric CO2 changes. We note that due to the prescribed land surface, our simulations potentially underestimate the full response of the hydrological cycle due to missing vegetation–atmosphere feedbacks of greenhouse climates (e.g. Upchurch et al., 1998; Levis et al., 2000; Zhou et al., 2012). Uncertainties in local orography and related changes in precipitation (Houze, 2012) are additional factors with demonstrated effects on the equatorial Aptian climate (Chaboureau et al., 2012). Nevertheless, the simulated narrowing of the ITCZ is a large-scale pattern across the Aptian–Albian South American and African continents. Furthermore, projections for the 21st century also show a consistent narrowing and intensification of the ITCZ in response to elevated atmospheric CO2 levels (Byrne et al., 2018), which is supported by the observational record (Wodzicki and Rapp, 2016). We conclude that the progressive northward opening of the Early Cretaceous Angola Basin not only changed the mean freshwater balance but also enhanced the regional sensitivity to global climate variability.
4.2 Comparison to temperature reconstructions
Independent validation of the simulated temperature distribution is difficult due to scarce quantitative proxy estimates for the study region and interval. To our knowledge, the only suitable Aptian–Albian oxygen isotope or TEX86 data come from the Weddell Sea and Falkland Plateau (see the overview in O'Brien et al., 2017). For the latter, absolute δ18O-derived surface temperatures from Aptian–Albian planktonic foraminifera (Huber et al., 2018) average 16 °C, which is 3.0 °C higher than maximum model SSTs. As the Falkland Plateau SSTs are mainly sensitive to ΔCO2, an unrealistic further doubling of atmospheric CO2 concentrations to ∼ 2400 ppmv would be needed to close the model–proxy misfit. Another possible solution would be an enhanced hydrological cycle with an associated lower δ18O of local seawater that would reduce reconstructed temperatures (Huber et al., 2018). In accordance to this, our 1200 ppmv CO2 simulations show that the net freshwater gain (precipitation exceeding evaporation) between 50 and 60° S was on average 24 % larger for the Cretaceous than in a comparable present-day simulation with the same model. The excess freshwater is advected across the Falkland Plateau as part of the surface limb of the described South Atlantic overturning circulation and may have influenced local carbonate chemistry and temperature reconstruction. We note that exceptionally low δ18O values at the Falkland Plateau have also been reported for the Turonian greenhouse climate (Bice et al., 2003).
As uncertainties in the local freshwater balance would primarily affect absolute temperature reconstructions for surface-dwelling species, we infer that the model–proxy comparison for subsurface and bottom-water temperatures is a more robust test. The warmest bottom-water temperatures on the Falkland Plateau are simulated for high CO2, an open DP, and a closed GBG. In addition to the direct radiative warming in response to higher CO2 concentrations, we show that all three factors lead to an enhanced subsurface advection of warm and saline SAIW into the Falkland Basin. This creates a subsurface temperature maximum during stage 2, when bottom-water temperatures exceed SSTs by up to 3 °C. The upper end of simulated bottom-water temperatures of up to 15 °C agrees with oxygen isotope-derived temperatures from Aptian–Albian benthic foraminifera (Huber et al., 2018) and Aptian belemnites (Price and Gröcke, 2002). Importantly, a closed DP reduces subsurface temperatures on the Falkland Plateau by up to 3 °C due to a reduction in the strength of SAIW formation. The resulting average temperatures, especially at lower CO2 levels, are therefore not consistent with the independent bottom-water temperature reconstructions, and our simulations indicate that an at least shallow-water connection across the DP as a more likely scenario.
Similar to the Angola Basin, the ΔCO2 temperature changes in the southern South Atlantic also vary over time, with overall higher sensitivity and larger spatial variability during stages 2 and 3 (Fig. 12). Furthermore, our ensemble simulations reveal that the ΔCO2 temperature response is also modulated by the DP configuration. While changes in the hydrological cycle control the Angola Basin ΔCO2 response, the width of the DP influences the local ocean dynamics in the southern South Atlantic via changes in the SAIW overturning strength. Both mechanisms illustrate the highly nonlinear interaction between palaeogeographic and radiative forcing mechanisms, which can only be fully captured by an ensemble approach. Our analysis shows that the export of SAIW during the early-opening phase was confined to the Falkland Basin, and the advection of this warm and salty water mass led to an inversion of the local vertical temperature gradient. Furthermore, changes in the Early Cretaceous palaeogeography alone likely caused substantial temperature variations on the Falkland Plateau (Lunt et al., 2016). The special oceanographic setting of this region therefore implies that conclusions from local temperature records should only be translated to global climatic changes with caution.
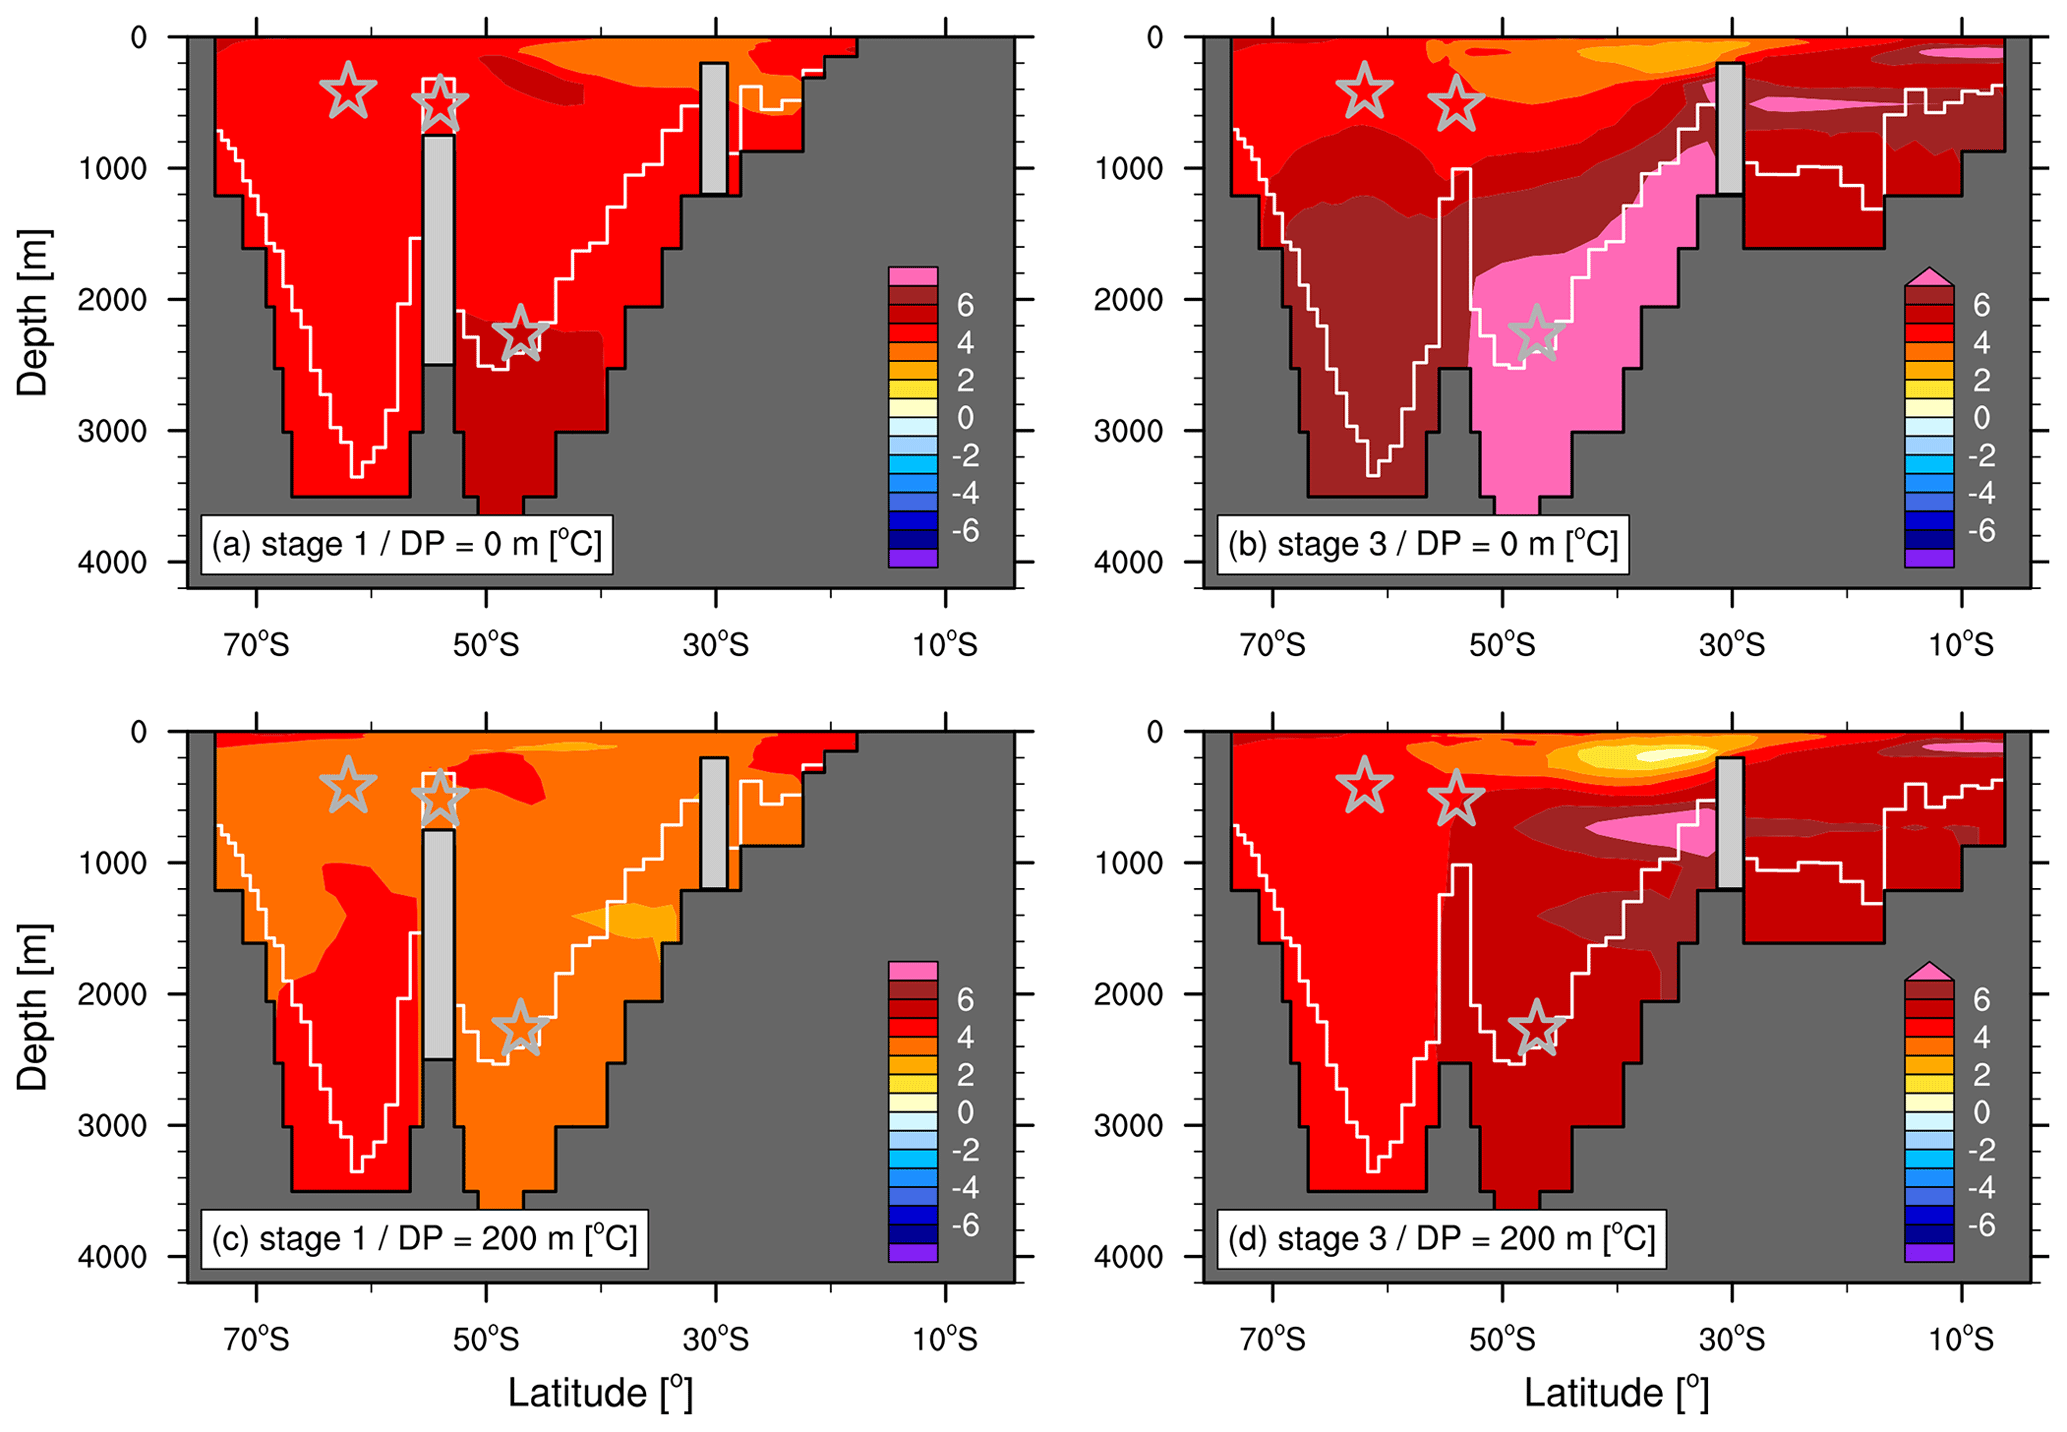
Figure 12Zonal mean sections of temperature changes associated with a CO2 doubling averaged across the South Atlantic and Southern Ocean. Panels show ΔCO2 for stages 1 and 3 for (a, b) a closed DP and (c, d) for a shallow DP opening. White lines show average water depth at the respective latitude and stage.
The difference between model-predicted and TEX86-reconstructed (Jenkyns et al., 2012; Steinig et al., 2020) temperatures of up to 18 °C cannot be reconciled, even when considering the large calibration uncertainties (O'Brien et al., 2017). The specific TEX86 export dynamics in the restricted Early Cretaceous Atlantic Ocean may have influenced the local TEX86–temperature relation (Steinig et al., 2020). Applying a regional TEX calibration from the modern Mediterranean and Red Sea (Kim et al., 2015; Steinig et al., 2020) reduces absolute reconstructed temperatures on the Falkland Plateau by ∼ 6°, thereby reducing, but not eliminating, the model–data misfit. In accordance with Steinig et al. (2020), who used the same model but with a different palaeobathymetry, our analysis shows remarkable similarities between the Aptian–Albian South Atlantic and the present-day Mediterranean Sea. Both are deep and restricted evaporative basins characterised by a salinity-driven, anti-estuarine circulation. Even the observed mean temperature of ∼ 13 °C and salinities above 38 (Borghini et al., 2014) are within the simulated Cretaceous ensemble range. Since the TEX86 warm bias is also found in the Mediterranean Outflow Water along the Portuguese continental margin (Kim et al., 2016), this region could be a potential modern analogue to partly explain the high TEX86-derived temperatures for the Early Cretaceous Falkland Plateau. The same mechanism has been used to explain model–data discrepancies and to improve consistency with other proxy techniques in the Valanginian Weddell Sea (Cavalheiro et al., 2021).
4.3 Integrated ocean circulation and carbon burial history
Our ensemble results allow us to test and to complement the hypotheses on the opening history of the Early Cretaceous South Atlantic presented in Dummann et al. (2020). Their reconstruction of regional water mass circulation and mixing is primarily based on the isotopic differences in seawater ϵNd(t) between more radiogenic SAIW (ϵNd(t) signatures between −3.2 and −2.5) and less radiogenic Pacific-sourced waters (ϵNd(t) signatures between −5.5 and −3.5). Therefore, one of our most important results is that the SAIW formation mechanism and region are consistent throughout all 36 ensemble members; i.e. radiogenic SAIW formation and export are independent of the boundary condition uncertainties used in this study. This result is also in agreement with the simulated formation of Atlantic Intermediate Water in a different climate model (Uenzelmann-Neben et al., 2017). As even the deeper WR significantly limits lateral water mass exchange with the Angola Basin, SAIW is formed in the area of local maxima in E−P (evaporation minus precipitation) fluxes in the northwestern Cape–Argentine Basin. The proposed radiogenic isotopic signature of SAIW, potentially derived from the erosional input of the Paraná large igneous province (Fig. 4a), is therefore a plausible end-member for tracing the regional water mass mixing during the Aptian to Albian. Due to the restricted and narrow basin, the overall mean volume transport of 1.2 Sv is an order of magnitude lower than the strength of the present-day Atlantic Meridional Overturning Circulation (McCarthy et al., 2015). In the following, we use the model-derived temporal changes in regional ocean circulation to complement the new stratigraphic framework and local gateway history (Fig. 13). It is important to note that this study focuses on the main drivers of the regional variability in temperature, salinity, and ocean circulation. Assessing the influence of these physical parameters on the local carbon burial, and therefore their possible expression in the sedimentary record, can only be done qualitatively. In addition, other drivers not included in this study, such as the possible variability in global ocean ventilation on orbital timescales (Sarr et al., 2022), may influence background oxygenation and can lead to changes in local bottom-water anoxia and carbon sequestration.
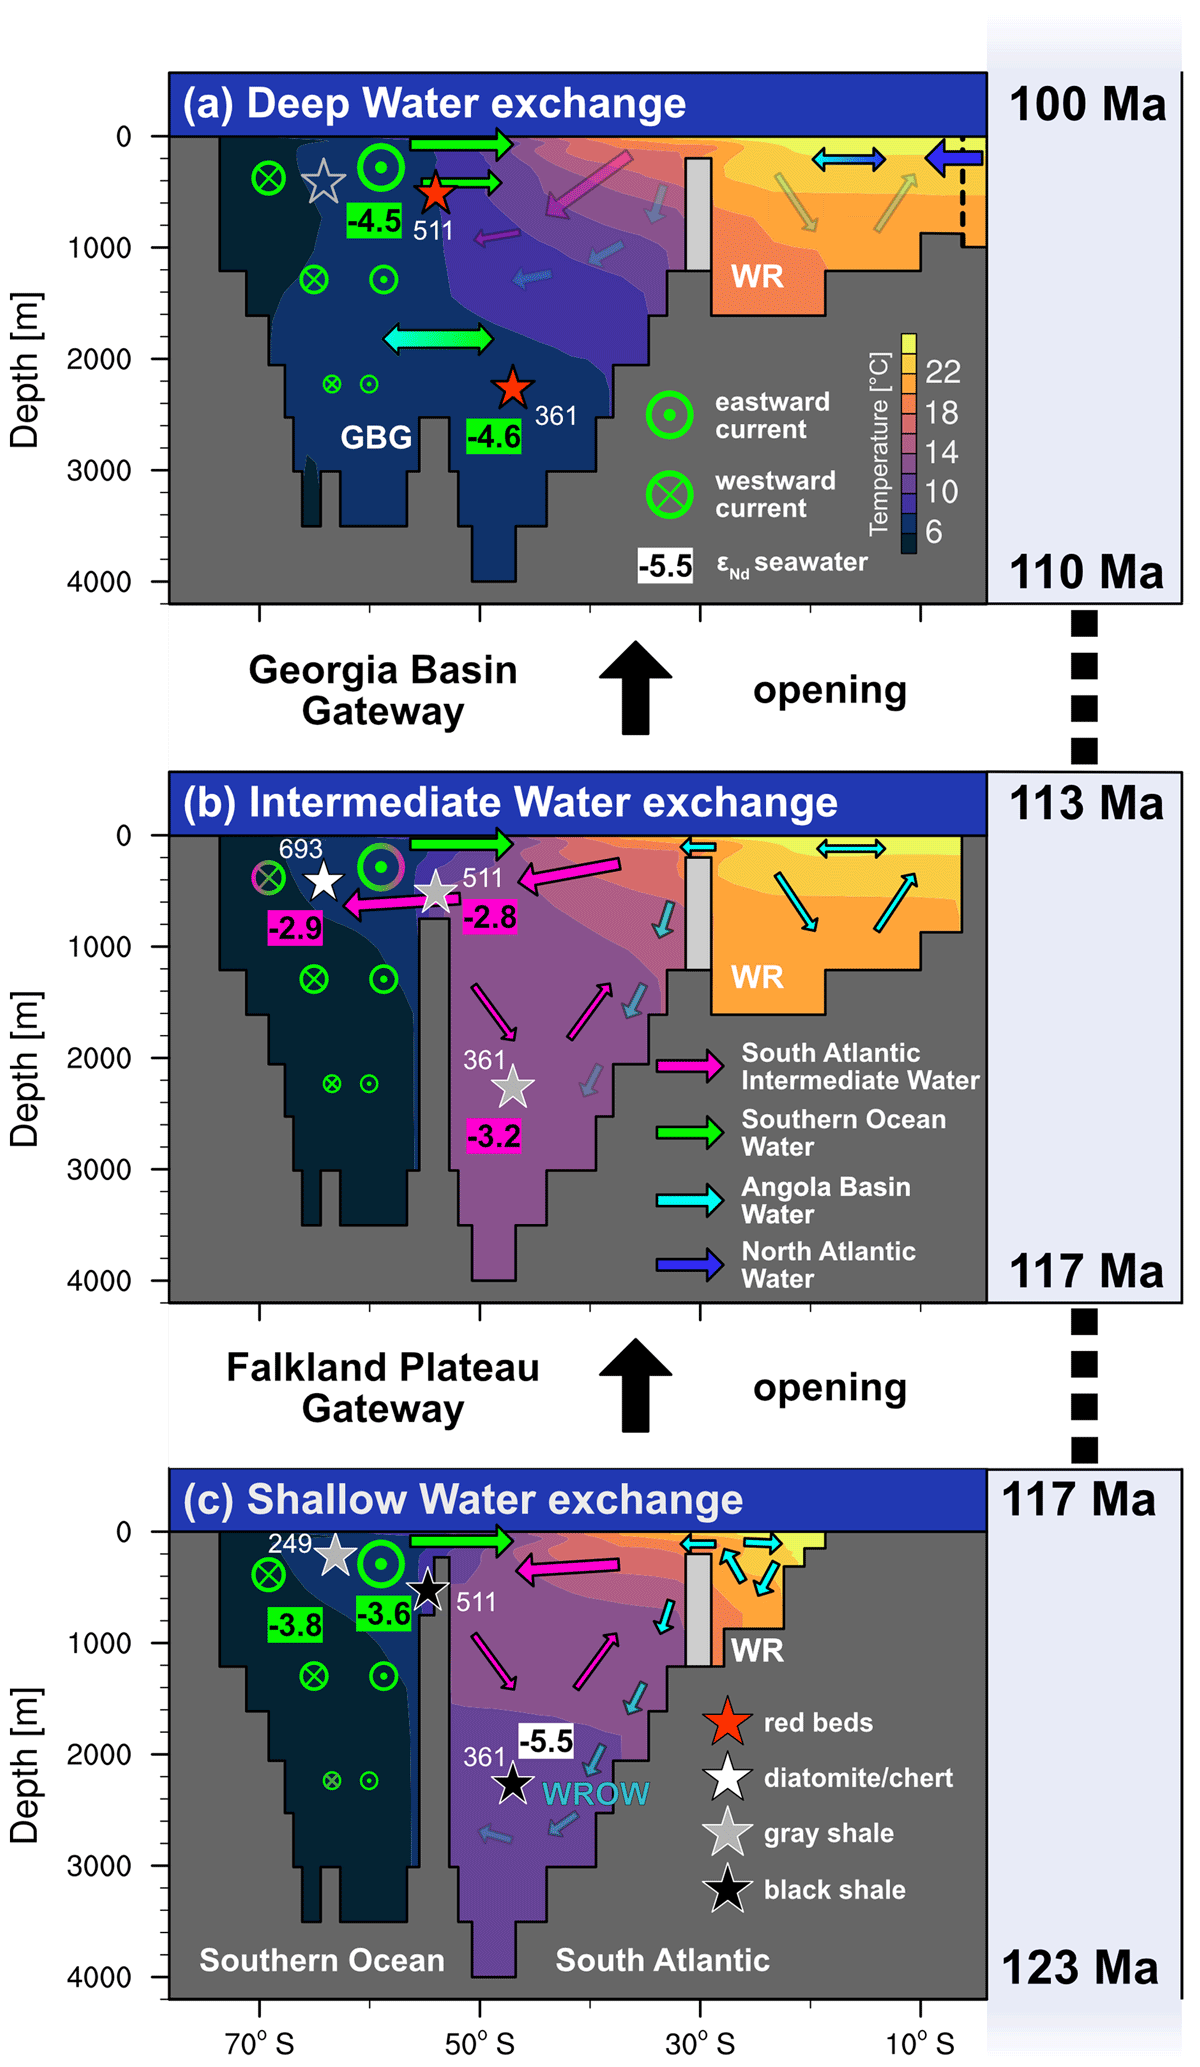
Figure 13Schematic of the proposed integration of the Aptian to Albian circulation evolution of the South Atlantic and Southern Ocean. Contours represent the ensemble mean zonal mean (30° W–0°) ocean temperature for (a) stage 3, (b) stage 2, and (c) stage 1. Arrows only qualitatively depict the proposed circulation. The colour code of the star symbols represents the main lithology at individual study sites, while the bold numbers show the average ϵNd(t) isotope signature for the respective time periods, as reported in Dummann et al. (2020) and shown in Fig. 1. The northern boundary of the Angola Basin at ∼ 5° S in panel (a) has been modified to visualise proposed onset of intermediate water exchange via Equatorial Atlantic gateway (Dummann et al., 2023).
The relatively unradiogenic ϵNd(t) values in the Weddell Sea (DSDP Site 249) and the Falkland Basin (DSDP Sites 327 and 511) during the latest Barremian to Early Aptian (∼ 123 to ∼ 117 Ma) are consistent with the simulated eastward advection of South Pacific water masses via the DP (Fig. 13c). During this time, the Falkland Basin formed a restricted, semi-enclosed basin that was shielded by the African continent in the north, favouring organic-rich black shale deposition (Dummann et al., 2021a). Due to the limited grid resolution and uncertain local palaeobathymetry, the model is not able to resolve the proposed restricted local circulation on the Falkland Plateau itself. However, the overall stronger influence of Southern Ocean Water for a more eastward position of the Falkland Plateau is clearly demonstrated. Black shales with total organic carbon (TOC) contents of up to 20 % are also found at DSDP Site 361 in the deep Cape Basin (Dummann et al., 2021b). In the model, the deep South Atlantic circulation is sluggish but influenced by saline Walvis Ridge Overflow Water (WROW; Fig. 13c) from the north. The combination of the most restricted environment with the highest evaporation and lowest precipitation forms the largest reservoir of dense water masses in the Angola Basin. In the model, this water mass eventually overflows the WR and sinks along the topography into the deepest parts of the Cape–Argentine Basin. Average WROW volume transport of ∼ 0.1 Sv is low, and vigorous entrainment of South Atlantic waters reduces the density differences on its way down the slope. The model results agree with earlier hypotheses that anoxic waters from the Angola Basin spilling over the WR increased stratification in the deep South Atlantic and promoted marine organic carbon burial (e.g. Natland, 1978; Arthur and Natland, 1979; Stein et al., 1986). Unradiogenic ϵNd(t) signatures at Site 361 support a disconnection of the deep basin from the overlying SAIW cell and could indicate an influence of the unusually unradiogenic Nd signatures of −12 found north of the WR (Dummann et al., 2023). We conclude that the production of WROW is physically plausible and consistent with available geochemical data, although it is still under debate how much, if any, water mass exchange was actually possible across the Walvis Ridge barrier (e.g. Heine et al., 2013; Pérez-Díaz and Eagles, 2017; Cui et al., 2023; Dummann et al., 2023).
TOC values at Site 361 decrease during stage 2 (Fig. 13b), indicating an enhanced ventilation of the deep Cape Basin between ∼ 117 and ∼ 113 Ma. Our idealised simulations reveal no significant changes in the region between stages 1 and 2, but the applied palaeogeographic changes are minimal by design. We therefore provide two hypotheses that could explain the reconstructed shift to a better ventilated, more radiogenic water mass in the deep Cape Basin. First, our simulations show that the depth of the SAIW cell was ultimately controlled by the sill depth of the Falkland Plateau. During the Aptian–Albian, the Falkland Plateau subsided from an initial shelf to an outer shelf to middle bathyal environment (see Sect. 2.2). Our simulations suggest that the maximum SAIW depth would have deepened in parallel, thereby increasing the oxygen content and radiogenic ϵNd(t) signature of the deeper South Atlantic. Second, due to the large uncertainty in palaeobathymetric estimates of the Early Cetaceous South Atlantic (Pérez-Díaz and Eagles, 2017), we used a constant Cape–Argentine Basin geometry for all three stages. In reality, the progressive opening would have led to a more gradual increase in the basin volume and, potentially, in the strength of the SAIW overturning cell. Furthermore, assuming that the advection of WROW was limited by the WR sill depth and relatively constant from the Early to the Late Aptian, the relative influence of locally formed and better-ventilated water masses would have increased compared to the poorly ventilated WROW. In either case, these Late Aptian palaeogeographic changes enabled a less restricted circulation in the deep Cape Basin. At the same time, intermediate water sites on the Falkland Plateau and in the Weddell Sea indicate the advection of more radiogenic SAIW because of the opening of the Falkland Plateau gateway (Dummann et al., 2020, 2021a).
The opening of the Georgia Basin gateway between ∼ 113 and ∼ 110 Ma represents the most profound shift in both the geochemical data and the ensemble simulations. Our model results show that the outflowing SAIW was confined to the southwestern tip of Africa for all stages. As the Falkland Plateau moves further to the west during stage 3, subsurface circulation in the entire Falkland Basin switched from an export of SAIW to an influx of cold Southern Ocean water, which is consistent with a gradual shift in ϵNd(t) in the Falkland Basin, reflecting an inflow of less radiogenic, Pacific-sourced water masses (Fig. 13a). The simultaneous onset of red bed deposition across the South Atlantic provides complementary evidence for an enhanced advection of cold, well-oxygenated water masses sourced at high latitudes. Data for DSDP Site 361 indicate the presence of a similarly unradiogenic and oxygenated southern-sourced water mass in the deep Cape Basin during the Albian. In contrast, our simulations show competing southward export of South Atlantic waters and northward advection of Southern Ocean waters, leading to a very weak net flow across the GBG during stage 3. We identify two processes that probably acted in concert as the most probable explanation for this difference. First, our simulated stage 3 is only represented by a minimal opening of the GBG, with a width of only two model grid points. An even less restricted deep-water exchange at a later time would likely lead to an increase in the contribution of northward flowing Southern Ocean deep waters. In accordance with this hypothesis, Donnadieu et al. (2016) show that the deep South Atlantic during the Cenomanian–Turonian boundary at ∼ 94 Ma was already characterised by a net northward transport of 4.2 Sv between 1200 and 2750 m. Second, we show that the enhanced salinity-driven formation of intermediate and deep waters in the South Atlantic was a direct consequence of the highly restricted environment of the young basins. We note that the densest water masses in our simulations are not formed by deep convection across the whole water column (like in the high-latitude Pacific Ocean) but rather due to density increases along the restricted shelf regions and subsequent sinking along the seafloor. In case of any water mass exchange across the WR, the gradual opening and deepening of the equatorial gateway to the North Atlantic would have increased the horizontal water mass exchange, reduced surface salinities, and therefore suppressed intermediate and overflow water formation in the South Atlantic (Poulsen et al., 2001). Dummann et al. (2023) show that intermediate water mass exchange across the Equatorial Atlantic gateway started at 107 Ma, and even deep-water exchange was already possible by ∼ 100 Ma. This could have led to a reduction in or termination of SAIW and WROW production and a gradual transition from a previously salinity-driven deep-water formation at low latitudes to a temperature-driven convection regime in the high-latitude Southern Ocean (Poulsen et al., 2001; Donnadieu et al., 2016).
We present an ensemble approach to deal with large uncertainties in deep-time palaeo-boundary conditions. Instead of dedicated sensitivity experiments, we use an ensemble of 36 climate model experiments to simulate the Barremian to Albian opening of the South Atlantic Ocean under full consideration of the uncertainties in available boundary conditions. This study serves as a test case to demonstrate the feasibility and benefits of such an approach to assess the fundamental controls on the Early Cretaceous ocean circulation and their temporal changes in the evolving South Atlantic. Through close integration of a regional stratigraphic framework and available geochemical data, we conclude the following:
-
Excessive evaporation and restricted circulation led to the salinity-driven formation of intermediate waters in the early evolutionary stages of the subtropical South Atlantic under all boundary conditions. The southward export of these warm and saline intermediate waters was balanced by the wind-driven advection of cold and fresh high-latitude Southern Ocean waters and can be used to track water mass exchange with the Southern Ocean.
-
Increasing geographical restrictions towards the northern end of the South Atlantic produced the densest water masses in the silled Angola Basin. These saline and presumably anoxic waters may have entered the South Atlantic via overflow across the Walvis Ridge and potentially promoted the deposition of organic-rich black shales in the deep Cape Basin during the Early Aptian.
-
Palaeogeography was at least as important as CO2 in driving temperature and salinity changes for most parts of the restricted South Atlantic and must therefore be considered in any reconstruction of the local temperature evolution. Limitations in available boundary conditions lead to Aptian–Albian ocean temperature uncertainties of up to 15 °C, especially in the deep Cape–Argentine and Angola basins.
-
The consecutive opening of marine gateways in the southern and equatorial Atlantic led to a stepwise transition from the initial influence of warm, oxygen-depleted intermediate and deep waters produced at subtropical latitudes to a dominance of high-latitude convection forming cold and oxygenated deep waters in the Southern Ocean. This turnover in regional deep-water ventilation ultimately controlled the end of the enhanced organic carbon burial during the Early Albian.
-
Our ensemble approach reveals significant nonlinearities between individual forcing mechanisms. Progressive northward rifting enhanced the sensitivity of the Angola Basin circulation and stratification to changes in atmospheric CO2 via large-scale shifts in tropical precipitation. The DP modulates the mean strength of the meridional SAIW cell and its sensitivity to ΔCO2, with an improved model–data fit for subsurface temperatures on the Falkland Plateau for a shallow- to intermediate-DP depth. These interrelated changes in atmospheric and ocean dynamics cannot be identified with traditional single sensitivity experiments and highlight the benefits of an ensemble approach.
Model data for all 36 simulations used in this study have been deposited in an open-access Zenodo repository (https://doi.org/10.5281/zenodo.11386834, Steinig et al., 2024).
The supplement related to this article is available online at: https://doi.org/10.5194/cp-20-1537-2024-supplement.
PH, SF, and TW conceived the overall project and acquired funding. SeS, SF, and WP designed the modelling experiments. SeS carried out the simulations and led the analysis. WD, PH, MF, and TW led the interpretation of the geochemical data. SeS wrote the paper with contributions from all authors.
The contact author has declared that none of the authors has any competing interests.
Publisher’s note: Copernicus Publications remains neutral with regard to jurisdictional claims made in the text, published maps, institutional affiliations, or any other geographical representation in this paper. While Copernicus Publications makes every effort to include appropriate place names, the final responsibility lies with the authors.
Model integrations were conducted at the Computing Center of Kiel University. We thank Jens Herrle for helping with the interpretation of the geochemical data and Stefan Hagemann for constructing the parameters for the hydrological discharge model.
This research has been supported by the Deutsche Forschungsgemeinschaft (grant nos. FL378/1-1, FL378/1-2, HO2188/9, and Collaborative Research Centre 754 (sub-project A7)).
The article processing charges for this open-access publication were covered by the GEOMAR Helmholtz Centre for Ocean Research Kiel.
This paper was edited by Yannick Donnadieu and reviewed by two anonymous referees.
Arthur, M. A. and Natland, J. H.: Carbonaceous Sediments in the North and South Atlantic: The Role of Salinity in Stable Stratification of Early Cretaceous Basins, in: Deep Drilling Results in the Atlantic Ocean: Continental Margins and Paleoenvironment, American Geophysical Union (AGU), 375–401, ISBN 978-1-118-66583-1, 1979. a
Barron, E. J. and Washington, W. M.: The role of geographic variables in explaining paleoclimates: results from Cretaceous climate model sensitivity studies, J. Geophys. Res., 89, 1267–1279, https://doi.org/10.1029/JD089iD01p01267, 1984. a
Basov, I. and Krasheninnikov, V.: Benthic Foraminifers in Mesozoic and Cenozoic Sediments of the Southwestern Atlantic As an Indicator of Paleoenvironment, Deep Sea Drilling Project Leg 71, in: Initial Reports of the Deep Sea Drilling Project, 71, U.S. Government Printing Office, https://doi.org/10.2973/dsdp.proc.71.128.1983, 1983. a
Behrooz, L., Naafs, B. D., Dickson, A. J., Love, G. D., Batenburg, S. J., and Pancost, R. D.: Astronomically Driven Variations in Depositional Environments in the South Atlantic During the Early Cretaceous, Paleoceanography and Paleoclimatology, 33, 894–912, https://doi.org/10.1029/2018PA003338, 2018. a, b
Bice, K. L., Huber, B. T., and Norris, R. D.: Extreme polar warmth during the Cretaceous greenhouse? Paradox of the late Turonian δ18O record at Deep Sea Drilling Project Site 511, Paleoceanography, 18, 2002PA000848, https://doi.org/10.1029/2002PA000848, 2003. a
Blakey, R. C.: Gondwana paleogeography from assembly to breakup – A 500 m.y. odyssey, in: Special Paper 441: Resolving the Late Paleozoic Ice Age in Time and Space, vol. 441, Geological Society of America, 28 pp., ISBN 978-0-8137-2441-6, https://doi.org/10.1130/2008.2441(01), 2008. a
Blöhdorn, J.: Klima und Ozeanzirkulation der Frühen Kreide im Kiel Climate Model, PhD thesis, Christian-Albrechts-Universität Kiel, https://macau.uni-kiel.de/receive/diss_mods_00012103 (last access: 13 July 2024), 2013. a, b
Bodin, S., Meissner, P., Janssen, N. M., Steuber, T., and Mutterlose, J.: Large igneous provinces and organic carbon burial: Controls on global temperature and continental weathering during the Early Cretaceous, Global Planet. Change, 133, 238–253, https://doi.org/10.1016/j.gloplacha.2015.09.001, 2015. a
Borghini, M., Bryden, H., Schroeder, K., Sparnocchia, S., and Vetrano, A.: The Mediterranean is becoming saltier, Ocean Sci., 10, 693–700, https://doi.org/10.5194/os-10-693-2014, 2014. a
Bralower, T. J., Schlanger, S. O., Sliter, W. V., Allard, D. J., Leckie, R. M., and Arthur, M. A.: Timing and Paleoceanography of Oceanic Dysoxia/Anoxia in the Late Barremian to Early Aptian (Early Cretaceous), Palaios, 9, 335–369, https://doi.org/10.2307/3515055, 1994. a, b
Byrne, M. P., Pendergrass, A. G., Rapp, A. D., and Wodzicki, K. R.: Response of the Intertropical Convergence Zone to Climate Change: Location, Width, and Strength, Current Climate Change Reports, 4, 355–370, https://doi.org/10.1007/s40641-018-0110-5, 2018. a
Cao, W., Zahirovic, S., Flament, N., Williams, S., Golonka, J., and Müller, R. D.: Improving global paleogeography since the late Paleozoic using paleobiology, Biogeosciences, 14, 5425–5439, https://doi.org/10.5194/bg-14-5425-2017, 2017. a, b, c
Cavalheiro, L., Wagner, T., Steinig, S., Bottini, C., Dummann, W., Esegbue, O., Gambacorta, G., Giraldo-Gómez, V., Farnsworth, A., Flögel, S., Hofmann, P., Lunt, D. J., Rethemeyer, J., Torricelli, S., and Erba, E.: Impact of global cooling on Early Cretaceous high pCO2 world during the Weissert Event, Nat. Commun., 12, 5411, https://doi.org/10.1038/s41467-021-25706-0, 2021. a, b, c
Chaboureau, A.-C., Donnadieu, Y., Sepulchre, P., Robin, C., Guillocheau, F., and Rohais, S.: The Aptian evaporites of the South Atlantic: a climatic paradox?, Clim. Past, 8, 1047–1058, https://doi.org/10.5194/cp-8-1047-2012, 2012. a, b, c, d, e
Cui, X., Wignall, B., Freeman, K. H., and Summons, R. E.: Early Cretaceous marine incursions into South Atlantic rift basins originated from the south, Communications Earth Environment, 4, 6, https://doi.org/10.1038/s43247-022-00668-3, 2023. a, b
Dingle, R. V.: Walvis Ridge barrier: its influence on palaeoenvironments and source rock generation deduced from ostracod distributions in the early South Atlantic Ocean, Geological Society, London, Special Publications, 153, 293–302, https://doi.org/10.1144/GSL.SP.1999.153.01.18, 1999. a
Donnadieu, Y., Pucéat, E., Moiroud, M., Guillocheau, F., and Deconinck, J.-F.: A better-ventilated ocean triggered by Late Cretaceous changes in continental configuration, Nat. Commun., 7, 10316, https://doi.org/10.1038/ncomms10316, 2016. a, b, c
Dummann, W., Steinig, S., Hofmann, P., Flögel, S., Osborne, A. H., Frank, M., Herrle, J. O., Bretschneider, L., Sheward, R. M., and Wagner, T.: The impact of Early Cretaceous gateway evolution on ocean circulation and organic carbon burial in the emerging South Atlantic and Southern Ocean basins, Earth Planet. Sc. Lett., 530, 115890, https://doi.org/10.1016/j.epsl.2019.115890, 2020. a, b, c, d, e, f, g, h
Dummann, W., Hofmann, P., Herrle, J. O., Wennrich, V., and Wagner, T.: A refined model of Early Cretaceous South Atlantic–Southern Ocean gateway evolution based on high-resolution data from DSDP Site 511 (Falkland Plateau), Palaeogeogr. Palaeocl., 562, 110113, https://doi.org/10.1016/j.palaeo.2020.110113, 2021a. a, b, c
Dummann, W., Steinig, S., Hofmann, P., Lenz, M., Kusch, S., Flögel, S., Herrle, J. O., Hallmann, C., Rethemeyer, J., Kasper, H. U., and Wagner, T.: Driving mechanisms of organic carbon burial in the Early Cretaceous South Atlantic Cape Basin (DSDP Site 361), Clim. Past, 17, 469–490, https://doi.org/10.5194/cp-17-469-2021, 2021b. a
Dummann, W., Hofmann, P., Herrle, J. O., Frank, M., and Wagner, T.: The early opening of the Equatorial Atlantic gateway and the evolution of Cretaceous peak warming, Geology, 51, 476–480, https://doi.org/10.1130/G50842.1, 2023. a, b, c, d, e
Eagles, G.: The age and origin of the central Scotia Sea, Geophys. J. Int., 183, 587–600, https://doi.org/10.1111/j.1365-246X.2010.04781.x, 2010. a, b
Frank, M.: Radiogenic isotopes: Tracers of past ocean circulation and erosional input, Rev. Geophys., 40, 1001, https://doi.org/10.1029/2000RG000094, 2002. a
Gibbons, A. D., Whittaker, J. M., and Müller, R. D.: The breakup of East Gondwana: Assimilating constraints from Cretaceous ocean basins around India into a best-fit tectonic model, J. Geophys. Res.-Sol. Ea., 118, 808–822, https://doi.org/10.1002/jgrb.50079, 2013. a
Golonka, J.: Phanerozoic Paleoenvironment and Paleolithofacies Maps, Mesozoic, Geologia, 33, 211–264, 2007. a
Hagemann, S. and Dümenil, L.: A parametrization of the lateral waterflow for the global scale, Clim. Dynam., 14, 17–31, https://doi.org/10.1007/s003820050205, 1998. a
Harris, W. K., Sliter, W. V., Survey, U. S. G., and Park, M.: Site 327, in: Initial Reports of the Deep Sea Drilling Project, 36, U.S. Government Printing Office, https://doi.org/10.2973/dsdp.proc.36.103.1977, 1977. a
Hay, W. W., DeConto, R. M., Wold, C. N., Wilson, K. M., Voigt, S., Schulz, M., Wold, A. R., Dullo, W.-C., Ronov, A. B., Balukhovsky, A. N., and Söding, E.: Alternative global Cretaceous paleogeography, Special Paper 332: Evolution of the Cretaceous Ocean-Climate System, 47 pp., https://doi.org/10.1130/0-8137-2332-9.1, 1999. a, b
Heine, C., Zoethout, J., and Müller, R. D.: Kinematics of the South Atlantic rift, Solid Earth, 4, 215–253, https://doi.org/10.5194/se-4-215-2013, 2013. a, b, c
Holbourn, A., Kuhnt, W., and Soeding, E.: Atlantic paleobathymetry, paleoproductivity and paleocirculation in the late Albian: The benthic foraminiferal record, Palaeogeogr. Palaeocl., 170, 171–196, https://doi.org/10.1016/S0031-0182(01)00223-1, 2001. a
Houze, R. A.: Orographic effects on precipitating clouds, Rev. Geophys., 50, RG1001, https://doi.org/10.1029/2011RG000365, 2012. a
Huber, B. T., MacLeod, K. G., Watkins, D. K., and Coffin, M. F.: The rise and fall of the Cretaceous Hot Greenhouse climate, Global Planet. Change, 167, 1–23, https://doi.org/10.1016/j.gloplacha.2018.04.004, 2018. a, b, c, d, e, f, g
Jenkyns, H. C.: Transient cooling episodes during Cretaceous Oceanic Anoxic Events with special reference to OAE 1a (Early Aptian), Philos. T. R. Soc. A, 376, 1–26, https://doi.org/10.1098/rsta.2017.0073, 2018. a
Jenkyns, H. C., Schouten-Huibers, L., Schouten, S., and Sinninghe Damsté, J. S.: Warm Middle Jurassic–Early Cretaceous high-latitude sea-surface temperatures from the Southern Ocean, Clim. Past, 8, 215–226, https://doi.org/10.5194/cp-8-215-2012, 2012. a, b, c
Jing, D. and Bainian, S.: Early Cretaceous atmospheric CO2 estimates based on stomatal index of Pseudofrenelopsis papillosa (Cheirolepidiaceae) from southeast China, Cretaceous Res., 85, 232–242, https://doi.org/10.1016/j.cretres.2017.08.011, 2018. a, b
Kim, J. H., van der Meer, J., Schouten, S., Helmke, P., Willmott, V., Sangiorgi, F., Koç, N., Hopmans, E. C., and Damsté, J. S. S.: New indices and calibrations derived from the distribution of crenarchaeal isoprenoid tetraether lipids: Implications for past sea surface temperature reconstructions, Geochim. Cosmochim. Ac., 74, 4639–4654, https://doi.org/10.1016/j.gca.2010.05.027, 2010. a
Kim, J. H., Schouten, S., Rodrigo-Gámiz, M., Rampen, S., Marino, G., Huguet, C., Helmke, P., Buscail, R., Hopmans, E. C., Pross, J., Sangiorgi, F., Middelburg, J. B. M., and Sinninghe Damsté, J. S.: Influence of deep-water derived isoprenoid tetraether lipids on the TEX paleothermometer in the Mediterranean Sea, Geochim. Cosmochim. Ac., 150, 125–141, https://doi.org/10.1016/j.gca.2014.11.017, 2015. a
Kim, J. H., Villanueva, L., Zell, C., and Sinninghe Damsté, J. S.: Biological source and provenance of deep-water derived isoprenoid tetraether lipids along the Portuguese continental margin, Geochim. Cosmochim. Ac., 172, 177–204, https://doi.org/10.1016/j.gca.2015.09.010, 2016. a
Kochhann, K. G. D., Koutsoukos, E. A. M., and Fauth, G.: Aptian–Albian benthic foraminifera from DSDP Site 364 (offshore Angola): A paleoenvironmental and paleobiogeographic appraisal, Cretaceous Res., 48, 1–11, https://doi.org/10.1016/j.cretres.2013.11.009, 2014. a
Ladant, J.-B., Poulsen, C. J., Fluteau, F., Tabor, C. R., MacLeod, K. G., Martin, E. E., Haynes, S. J., and Rostami, M. A.: Paleogeographic controls on the evolution of Late Cretaceous ocean circulation, Clim. Past, 16, 973–1006, https://doi.org/10.5194/cp-16-973-2020, 2020. a, b
Lagabrielle, Y., Goddéris, Y., Donnadieu, Y., Malavieille, J., and Suarez, M.: The tectonic history of Drake Passage and its possible impacts on global climate, Earth Planet. Sc. Lett., 279, 197–211, https://doi.org/10.1016/j.epsl.2008.12.037, 2009. a
Levis, S., Foley, J. A., and Pollard, D.: Large-Scale Vegetation Feedbacks on a Doubled CO2 Climate, J. Climate, 13, 1313–1325, https://doi.org/10.1175/1520-0442(2000)013<1313:LSVFOA>2.0.CO;2, 2000. a
Lunt, D. J., Farnsworth, A., Loptson, C., Foster, G. L., Markwick, P., O'Brien, C. L., Pancost, R. D., Robinson, S. A., and Wrobel, N.: Palaeogeographic controls on climate and proxy interpretation, Clim. Past, 12, 1181–1198, https://doi.org/10.5194/cp-12-1181-2016, 2016. a, b, c
Madec, G. and the NEMO System Team: NEMO Ocean Engine Reference Manual, Zenodo, https://doi.org/10.5281/zenodo.8167700, 2023. a
McAnena, A., Flögel, S., Hofmann, P., Herrle, J. O., Griesand, A., Pross, J., Talbot, H. M., Rethemeyer, J., Wallmann, K., and Wagner, T.: Atlantic cooling associated with a marine biotic crisis during the mid-Cretaceous period, Nat. Geosci., 6, 558–561, https://doi.org/10.1038/ngeo1850, 2013. a, b
McCarthy, G., Smeed, D., Johns, W., Frajka-Williams, E., Moat, B., Rayner, D., Baringer, M., Meinen, C., Collins, J., and Bryden, H.: Measuring the Atlantic Meridional Overturning Circulation at 26° N, Prog. Oceanogr., 130, 91–111, https://doi.org/10.1016/j.pocean.2014.10.006, 2015. a
Murphy, D. P. and Thomas, D. J.: The evolution of Late Cretaceous deep-ocean circulation in the Atlantic basins: Neodymium isotope evidence from South Atlantic drill sites for tectonic controls, Geochem. Geophy. Geosy. 14, 5323–5340, https://doi.org/10.1002/2013GC004889, 2013. a
Müller, R. D., Sdrolias, M., Gaina, C., Steinberger, B., and Heine, C.: Long-term sea-level fluctuations driven by ocean basin dynamics, Science, 319, 1357–1362, https://doi.org/10.1126/science.1151540, 2008. a
Müller, R. D., Cannon, J., Williams, S., and Dutkiewicz, A.: PyBacktrack 1.0: A Tool for Reconstructing Paleobathymetry on Oceanic and Continental Crust, Geochem., Geophy. Geosy., 19, 1898–1909, https://doi.org/10.1029/2017GC007313, 2018. a
Naafs, B. D. A. and Pancost, R. D.: Environmental conditions in the South Atlantic (Angola Basin) during the Early Cretaceous, Org. Geochem., 76, 184–193, https://doi.org/10.1016/j.orggeochem.2014.08.005, 2014. a, b
Natland, J.: Composition, Provenance, and Diagenesis of Cretaceous Clastic Sediments Drilled on the Atlantic Continental Rise off Southern Africa, DSDP Site 361 – Implications for the Early Circulation of the South Atlantic, in: Initial Reports of the Deep Sea Drilling Project, 40, U.S. Government Printing Office, https://doi.org/10.2973/dsdp.proc.40.130.1978, 1978. a
O'Brien, C. L., Robinson, S. A., Pancost, R. D., Sinninghe Damsté, J. S., Schouten, S., Lunt, D. J., Alsenz, H., Bornemann, A., Bottini, C., Brassell, S. C., Farnsworth, A., Forster, A., Huber, B. T., Inglis, G. N., Jenkyns, H. C., Linnert, C., Littler, K., Markwick, P., McAnena, A., Mutterlose, J., Naafs, B. D. A., Püttmann, W., Sluijs, A., van Helmond, N. A., Vellekoop, J., Wagner, T., and Wrobel, N. E.: Cretaceous sea-surface temperature evolution: Constraints from TEX86 and planktonic foraminiferal oxygen isotopes, Earth-Sci. Rev., 172, 224–247, https://doi.org/10.1016/j.earscirev.2017.07.012, 2017. a, b, c
Park, W. and Latif, M.: Ensemble global warming simulations with idealized Antarctic meltwater input, Clim. Dynam., 52, 3223–3239, https://doi.org/10.1007/s00382-018-4319-8, 2019. a
Park, W., Keenlyside, N., Latif, M., Ströh, A., Redler, R., Roeckner, E., and Madec, G.: Tropical Pacific Climate and Its Response to Global Warming in the Kiel Climate Model, J. Climate, 22, 71–92, https://doi.org/10.1175/2008JCLI2261.1, 2009. a
Poulsen, C. J., Barron, E. J., Arthur, M. A., and Peterson, W. H.: Response of the Mid-Cretaceous global oceanic circulation to tectonic and CO2 forcings, Paleoceanography, 16, 576–592, https://doi.org/10.1029/2000PA000579, 2001. a, b
Price, G. D. and Gröcke, D. R.: Strontium-isotope stratigraphy and oxygen- and carbon-isotope variation during the Middle Jurassic-Early Cretaceous of the Falkland Plateau, South Atlantic, Palaeogeogr. Palaeocl. 183, 209–222, https://doi.org/10.1016/S0031-0182(01)00486-2, 2002. a, b, c
Pérez-Díaz, L. and Eagles, G.: South Atlantic paleobathymetry since early Cretaceous, Sci. Rep., 7, 11819, https://doi.org/10.1038/s41598-017-11959-7, 2017. a, b, c, d, e, f, g, h
Robinson, S. A., Murphy, D. P., Vance, D., and Thomas, D. J.: Formation of “Southern Component Water” in the Late Cretaceous: Evidence from Nd-isotopes, Geology, 38, 871–874, https://doi.org/10.1130/G31165.1, 2010. a
Roeckner, E., Bäuml, G., Bonaventura, L., Brokopf, R., Esch, M., Giorgetta, M., Hagemann, S., Kirchner, I., Kornblueh, L., Manzini, E., Rhodin, A., Schlese, U., Schulzweida, U., and Tompkins, A.: The atmospheric general circulation model ECHAM 5. PART I: Model description, Max Planck Institute for Meteorology Report No. 349, https://pure.mpg.de/rest/items/item_995269_4/component/file_995268/content (last access: 13 July 2024), 2003. a
Sarr, A., Donnadieu, Y., Laugié, M., Ladant, J., Suchéras‐Marx, B., and Raisson, F.: Ventilation Changes Drive Orbital‐Scale Deoxygenation Trends in the Late Cretaceous Ocean, Geophys. Res. Lett., 49, e2022GL099830, https://doi.org/10.1029/2022GL099830, 2022. a, b
Sewall, J. O., van de Wal, R. S. W., van der Zwan, K., van Oosterhout, C., Dijkstra, H. A., and Scotese, C. R.: Climate model boundary conditions for four Cretaceous time slices, Clim. Past, 3, 647–657, https://doi.org/10.5194/cp-3-647-2007, 2007. a, b, c, d, e, f, g, h, i
Sloan, L. C. and Rea, D. K.: Atmospheric carbon dioxide and early Eocene climate: A general circulation modeling sensitivity study, Palaeogeogr., Palaeocl., 119, 275–292, https://doi.org/10.1016/0031-0182(95)00012-7, 1996. a
Stein, R., Rullkötter, J., and Welte, D. H.: Accumulation of organic-carbon-rich sediments in the Late Jurassic and Cretaceous Atlantic Ocean – A synthesis, Chem. Geol., 56, 1–32, https://doi.org/10.1016/0009-2541(86)90107-5, 1986. a, b, c
Steinig, S., Dummann, W., Park, W., Latif, M., Kusch, S., Hofmann, P., and Flögel, S.: Evidence for a regional warm bias in the Early Cretaceous TEX86 record, Earth Planet. Sc. Lett., 539, 116184, https://doi.org/10.1016/j.epsl.2020.116184, 2020. a, b, c, d, e, f, g, h, i
Steinig, S., Dummann, W., Hofmann, P., Frank, M., Park, W., Wagner, T., and Flögel, S.: Early Cretaceous climate model output from the Kiel Climate Model (from Steinig et al., 2024), Zenodo [data set], https://doi.org/10.5281/zenodo.11386834, 2024. a
Torsvik, T. H., Rousse, S., Labails, C., and Smethurst, M. A.: A new scheme for the opening of the South Atlantic Ocean and the dissection of an Aptian salt basin, Geophys. J. Int., 177, 1315–1333, https://doi.org/10.1111/j.1365-246X.2009.04137.x, 2009. a
Trabucho-Alexandre, J., Hay, W. W., and de Boer, P. L.: Phanerozoic environments of black shale deposition and the Wilson Cycle, Solid Earth, 3, 29–42, https://doi.org/10.5194/se-3-29-2012, 2012. a
Uenzelmann-Neben, G., Weber, T., Grützner, J., and Thomas, M.: Transition from the Cretaceous ocean to Cenozoic circulation in the western South Atlantic – A twofold reconstruction, Tectonophysics, 716, 225–240, https://doi.org/10.1016/j.tecto.2016.05.036, 2017. a, b, c, d, e
Upchurch, G. R., Otto-Bliesner, B. L., and Scotese, C.: Vegetation–atmosphere interactions and their role in global warming during the latest Cretaceous, Philos. T. R. Soc. B, 353, 97–112, https://doi.org/10.1098/rstb.1998.0194, 1998. a
Wagner, T., Hofmann, P., and Flögel, S.: Marine black shale deposition and Hadley Cell dynamics: A conceptual framework for the Cretaceous Atlantic Ocean, Mar. Petrol. Geol., 43, 222–238, https://doi.org/10.1016/j.marpetgeo.2013.02.005, 2013. a
Wallmann, K., Flögel, S., Scholz, F., Dale, A. W., Kemena, T. P., Steinig, S., and Kuhnt, W.: Periodic changes in the Cretaceous ocean and climate caused by marine redox see-saw, Nat. Geosci., 12, 456–461, https://doi.org/10.1038/s41561-019-0359-x, 2019. a
Wang, Y., Huang, C., Sun, B., Quan, C., Wu, J., and Lin, Z.: Paleo-CO2 variation trends and the Cretaceous greenhouse climate, Earth-Sci. Rev., 129, 136–147, https://doi.org/10.1016/j.earscirev.2013.11.001, 2014. a, b
Weissert, H.: C-Isotope stratigraphy, a monitor of paleoenvironmental change: A case study from the early cretaceous, Surv. Geophys., 10, 1–61, https://doi.org/10.1007/BF01901664, 1989. a
Wodzicki, K. R. and Rapp, A. D.: Long-term characterization of the Pacific ITCZ using TRMM, GPCP, and ERA-Interim, J. Geophys. Res., 121, 3153–3170, https://doi.org/10.1002/2015JD024458, 2016. a
Zhou, J., Poulsen, C. J., Rosenbloom, N., Shields, C., and Briegleb, B.: Vegetation-climate interactions in the warm mid-Cretaceous, Clim. Past, 8, 565–576, https://doi.org/10.5194/cp-8-565-2012, 2012. a