the Creative Commons Attribution 4.0 License.
the Creative Commons Attribution 4.0 License.
 | 27 Jun 2024
A series of climate oscillations around 8.2 ka revealed through multi-proxy speleothem records from North China
Pengzhen Duan
Hanying Li
Zhibang Ma
Jingyao Zhao
Xiyu Dong
Ashish Sinha
Peng Hu
Haiwei Zhang
Youfeng Ning
Guangyou Zhu
Hai Cheng
The 8.2 ka event has been extensively investigated as a remarkable single event but rarely considered as a part of multi-centennial climatic evolution. Here, we present absolutely dated speleothem multi-proxy records spanning 9.0–7.9 ka from Beijing in North China, near the northern limit of the East Asian summer monsoon (EASM) and thus sensitive to climate change, to provide evidence of the intensified multi-decadal climatic oscillations since 8.52 ka. Three extreme excursions characterized by inter-decadal consecutive δ18O excursions exceeding ±1σ are identified from 8.52 ka in our speleothem record. The earlier two are characterized by enriched 18O at ∼8.50 and 8.20 ka, respectively, suggesting a prolonged arid event, which is supported by the positive trend in δ13C values, increased trace element ratios, and lower growth rate. Following the 8.2 ka event, an excessive rebound immediately emerges in our δ18O and trace element records but moderate in the δ13C, probably suggesting pluvial conditions and nonlinear response of the local ecosystem. Following two similar severe droughts at 8.50 and 8.20 ka, the different behavior of δ13C suggests the recovering degree of resilient ecosystem responding to different rebounded rainfall intensity. A comparison with other high-resolution records suggests that the two droughts–one pluvial pattern between 8.52 and 8.0 ka is of global significance instead of being a regional phenomenon, and is causally linked to the slowdown and acceleration of the Atlantic Meridional Overturning Circulation that was further dominated by the freshwater injections in the North Atlantic.
- Article
(1612 KB) - Full-text XML
-
Supplement
(1204 KB) - BibTeX
- EndNote


The overall warming during 9.0–7.9 ka (thousands of years before present, where the present is 1950 CE) was punctuated by several inter-decadal to centennial climate fluctuations in the Northern Hemisphere (NH). The 8.2 ka event, as the most prominent abrupt cold event registered in the Greenland ice core records within the Holocene (Thomas et al., 2007), has been widely revealed by a large number of marine and terrestrial archives and dated to between 8.3 and 8.0 ka with a duration of 150–200 years (Fig. S1 in the Supplement) (e.g., Alley et al., 1997; Thomas et al., 2007; Kobashi et al., 2007; Cheng et al., 2009; Liu et al., 2013; Morrill et al., 2013; P. Duan et al., 2021).
With deeper investigation, the “cold event” at 8.2 ka is evidenced likely to be a part of larger “set” of cold climate anomalies between 8.6 and 8.0 ka (e.g., Rohling and Pälike, 2005). According to marine records, the freshwater drainage(s) of the proglacial Lake Agassiz–Ojibway (LAO) into the North Atlantic, which has commonly been thought to trigger the 8.2 ka event (e.g., Alley et al., 1997; Barber et al., 1999) through weakening the Atlantic Meridional Overturning Circulation (AMOC) and resultant global impact, is supposed to be characterized by two (Ellison et al., 2006; Roy et al., 2011; Godbout et al., 2019, 2020) or multiple outbursts (e.g., Teller et al., 2002; Kleiven et al., 2008; Jennings et al., 2015). The first pulse of freshwater may have induced the freshening of the North Atlantic at 8.55–8.45 ka (Lochte et al., 2019), the abrupt sea level jump (Törnqvist and Hijma, 2012; Lawrence et al., 2016), the detrital carbonate peak at ∼8.6 ka (Jennings et al., 2015), and deposition of a red-sediment bed in Hudson Strait at ∼8.26–8.69 ka (Kerwin, 1996; Lajeunesse and St-Onge, 2008). The superimposed effect of two or more successive freshwater drainages, or probably coupled with meltwater flux from the ice sheet (Morrill et al., 2014; Matero et al., 2017), finally led to severe and dramatic cooling events in the NH (Teller et al., 2002; Ellison et al., 2006). This is consistent with the view that the 8.2 ka event commenced at ∼8.5 ka and persisted until ∼8.0 ka (Rohling and Pälike, 2005) with more than one multi-decadal or centennial perturbation (e.g., Daley et al., 2009; Domínguez-Villar et al., 2009; Tan et al., 2020; W. Duan et al., 2021). However, some terrestrial records, such as the Greenland ice cores (Thomas et al., 2007) and European lake sediments (Von Grafenstein et al., 1999; Andersen et al., 2017), have only documented a remarkable climate event at ∼8.2 ka, whereas the counterpart to the preceding perturbation is not registered.
On the other hand, the aforementioned multi-decadal or centennial perturbations trended not only in the cold and dry direction in the NH but also extremely warm and humid conditions that have been evidenced in the immediate aftermath of the 8.2 ka event (Andersen et al., 2017; P. Duan et al., 2023). In particular, the post-event excessive rebound suggests a major pluvial episode prevailing across a large part of North China (Duan et al., 2023). However, using only one proxy, speleothem δ18O (Duan et al., 2023), is insufficient, and thus multi-proxy evidence about the overshoot is necessary, especially from the Asian summer monsoon (ASM) domain, where the climate change has a fast atmospheric teleconnection with the high-latitude North Atlantic (Cheng et al., 2020, 2022), to complement our understanding of the dynamics of rapid climatic changes, their underlying mechanisms, and the local ecosystem response.
In the context of high greenhouse gas emissions at present, the melted Greenland ice sheet will inject a huge quantity of freshwater into the North Atlantic in the next millennium, which is analogous to the sea level rising scenario during 9.0–7.9 ka (e.g., Aguiar et al., 2021). Therefore, it is important to elucidate the climate variations in response to the freshwater injections in the past to provide a potential analogy for future behavior, especially in North China where the ecosystem and economic development are highly dependent on hydroclimatic changes. Importantly, our study area is located near the northern fringe of the East Asian summer monsoon (EASM) and thus sensitively responds to the variations in EASM intensity (Duan et al., 2014; Li et al., 2017; Ma et al., 2012). Here we provide high-temporal-resolution speleothem multi-proxy records, including δ18O, δ13C, , , and , from Beijing in North China to reconstruct the hydroclimatic variations over the Circum-Bohai Sea region (CBSR) between 9.0 and 7.9 ka. Two climate anomalous events occurring before and at 8.2 ka, as well as a post-8.2 ka rebound, are investigated to show the general climate pattern around the abrupt cold event from its triggering, response, and ensuing feedback, and we further examine the relationship between the ASM and the North Atlantic.
2.1 Regional settings and modern climatology
Situated at ∼60 km southwest of Beijing in North China, the Huangyuan Cave (39°42′ N, 115°54′ E, altitude 610 m a.s.l. – above sea level) developed in a Mesoproterozoic dolomite and adjacent to Kulishu (39°41′ N, 115°39′ E) and Shihua (39°47′ N, 115°56′ E) caves (Fig. S1). The vegetation above the cave is dominated by secondary-growth deciduous broadleaf trees and shrubs (Ma et al., 2012; Duan et al., 2014). According to the meteorological station's observed data between 1998 and 2010 CE, the average annual air temperature and precipitation in the study area are 12.2 °C and 540 mm, respectively, with cold dry winters and warm wet summers (Fig. 1). The regional precipitation is highly seasonal and is mainly concentrated in the summer season with more than 420 mm occurring from June to September. It has been demonstrated (Duan et al., 2016, 2023; Li et al., 2017) that the summer precipitation δ18O (δ18Op) is negatively correlated with the summer rainfall amount over the study area and positively correlated with δ18Op over almost the entire EASM domain, the latter of which is normally related to the EASM intensity.
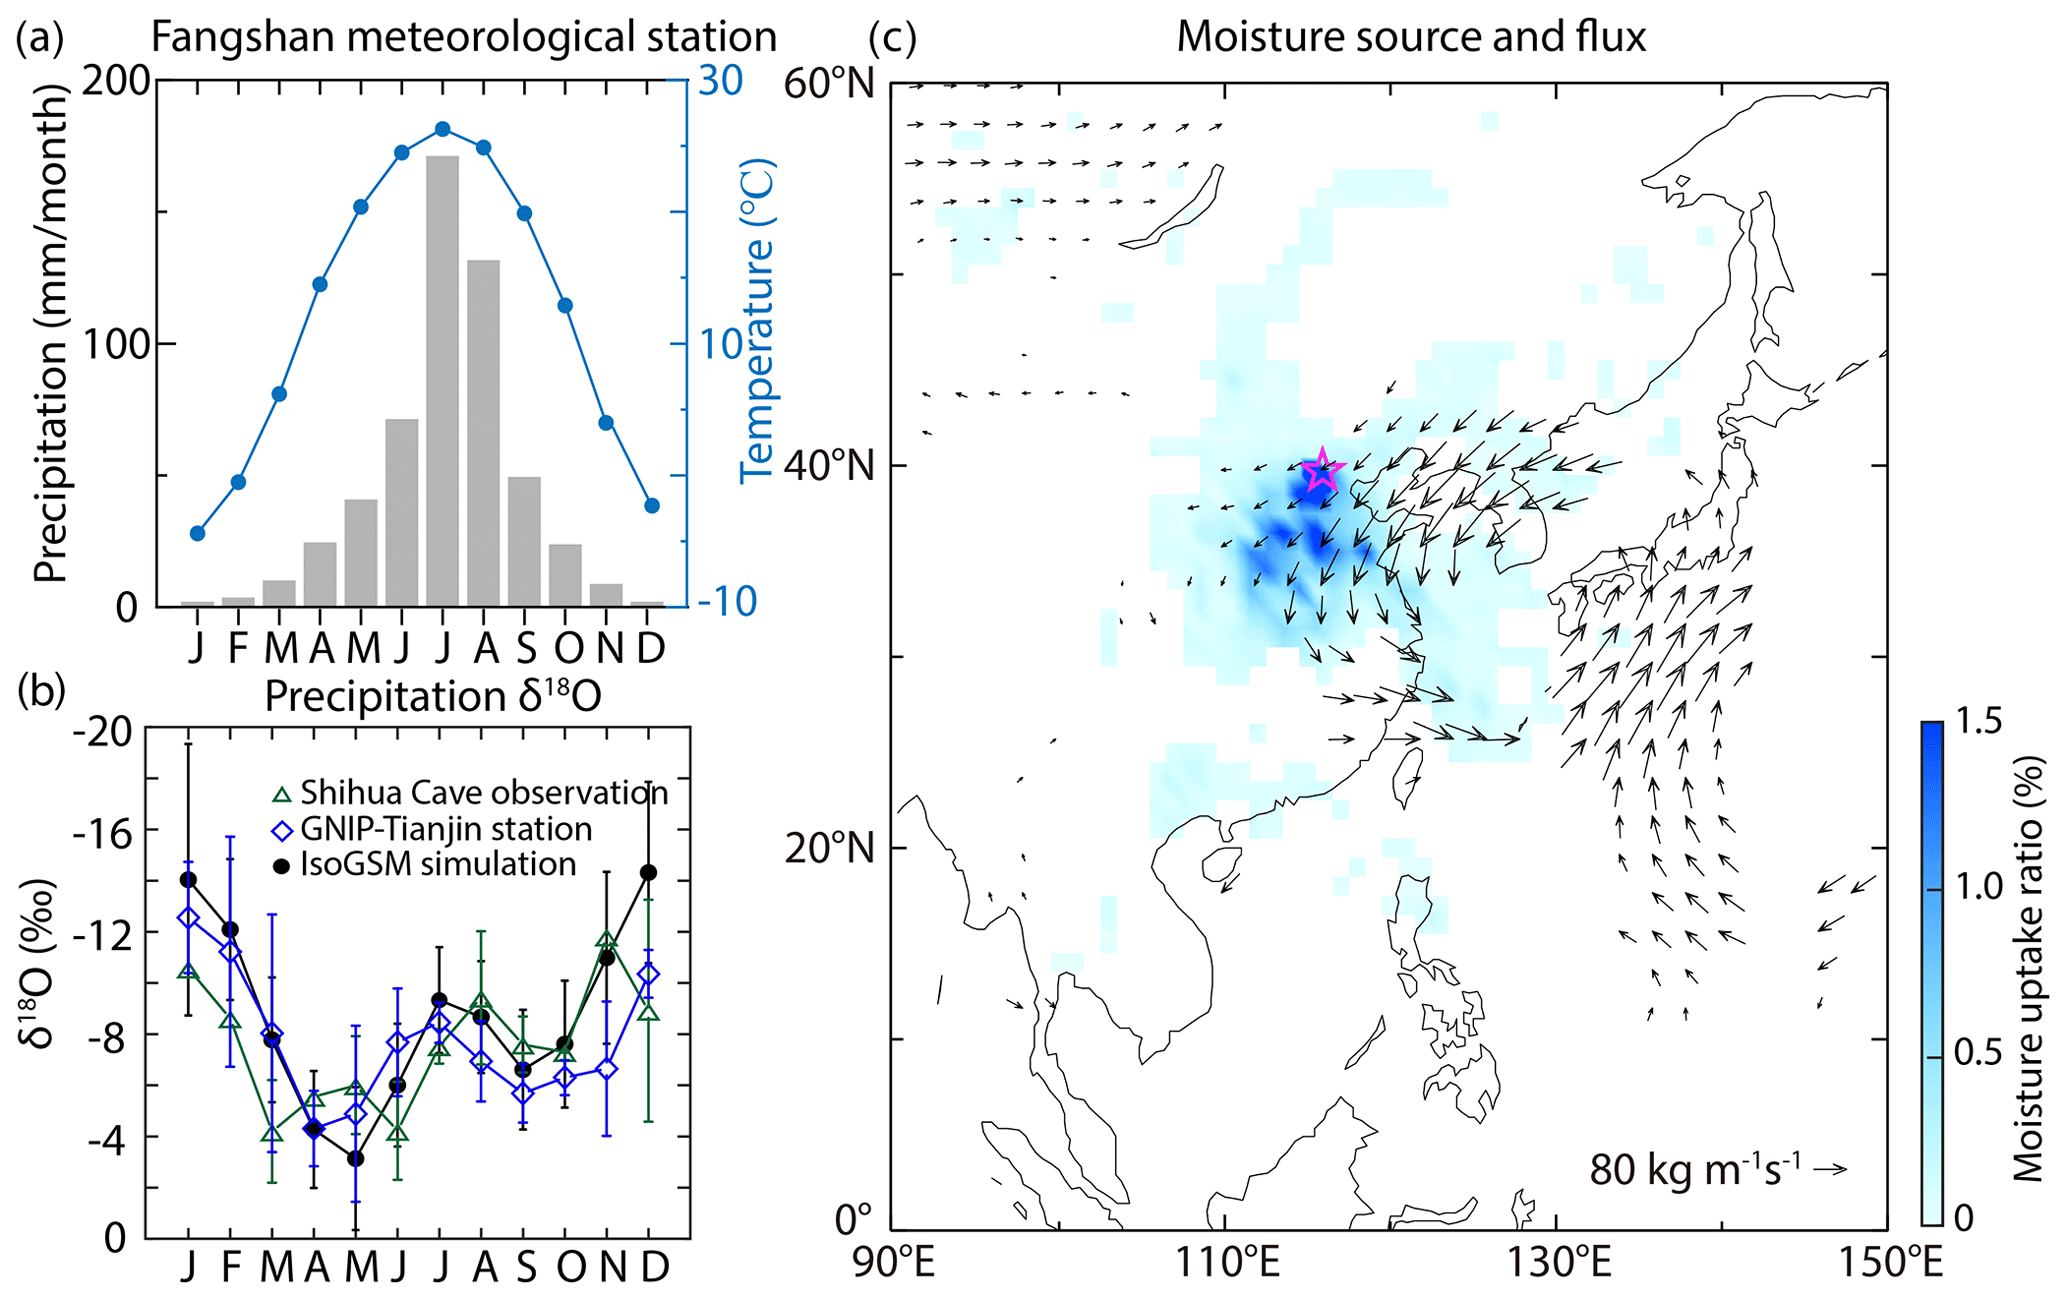
Figure 1Climatology and locations. (a) Climographs of precipitation amount (gray bars) and temperature (blue dots connected with lines) at Fangshan station (39°46′ N, 116°28′ E) near the study site, based on Chinese Meteorological Administration data (http://www.cma.gov.cn/, last access: 16 September 2022). (b) Annual cycle comparison of δ18Op from observations of Global Network of Isotopes in Precipitation (GNIP) Tianjin station (https://www.iaea.org/services/networks/gnip, last access: 21 June 2023) (1988–2002 CE with absent data covering 1993–2000 CE, blue triangles), Shihua Cave (Duan et al., 2016) (2011–2014 CE, green diamonds), and IsoGSM simulation data (Yoshimura et al., 2008) (1979–2017 CE, black dots) at the Huangyuan Cave. Error bars represent the 1σ uncertainty in δ18Op values for each month. (c) Mean July–August (JA) moisture source region (blue shading) the Hybrid Single Particle Lagrangian Integrated Trajectory (HYSPLIT) model version 4.0 (Stein et al., 2015) based on the NOAA-NCEP/NCAR reanalysis global meteorological field data of 2010–2020 CE (Sodemann et al., 2008; Krklec and Dominguez-Villar, 2014) and water vapor flux (arrow) from the European Centre for Medium-Range Weather Forecasts Reanalysis fifth-generation dataset (ERA5) (Hersbach et al., 2020) between 1980 and 2015 CE.
Speleothem BH-2, collected from Huangyuan Cave, is ∼17 cm in length and ∼5 cm in width (Fig. 2a). The candlestick shape of speleothem without macroscopic bias of the growth axis signifies that it was deposited under relatively stable conditions (Baker et al., 2007). The δ18O results for top 15–48 mm section of the sample, corresponding to 8.38–8.06 ka, have been reported in a previous investigation (Duan et al., 2023). In this study, the multi-proxy results of the entire sample are presented, spanning 9.0–7.9 ka.
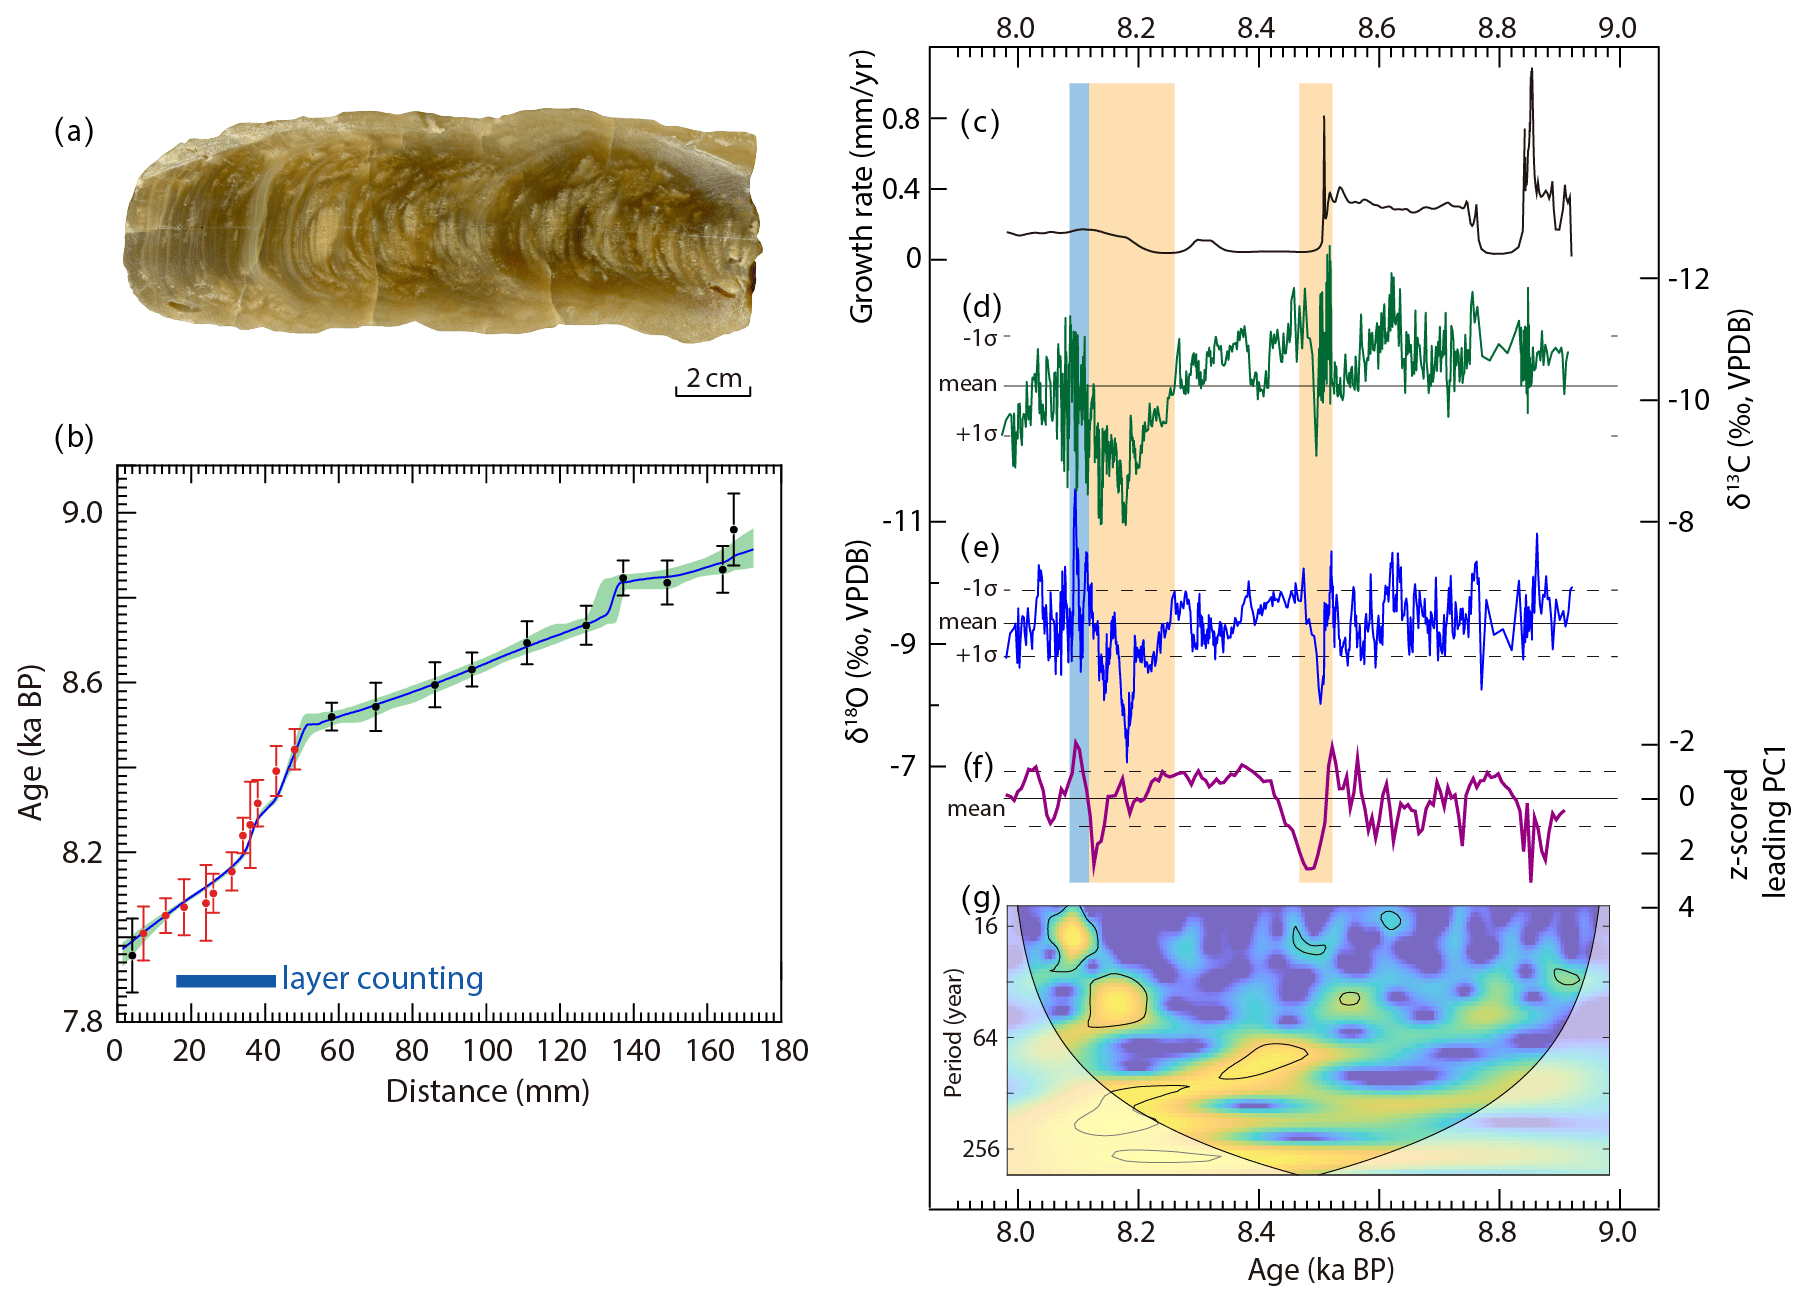
Figure 2Age model and proxy profiles of speleothem BH-2. (a) Scanned image of speleothem BH-2. The scale of the sample is similar to the x axis of the subpanel (b). (b) StalAge-derived age model (red, Scholz and Hoffmann, 2011) with 95 % confidence interval (light blue shading). Error bars on 230Th dates represent 2σ analytical errors. The red dates indicate the published results of Duan et al. (2023). The horizontal blue bar marks the range with layer counting. (c) The inferred growth rate of the BH-2 based on the chronology in (b). Panels (d) and (e) show δ18O (dark blue) and δ13C (green) profiles, respectively. The mean (solid) and the ±1σ values (dashed) for each entire record are indicated by the horizontal lines. (f) 30-year loess filtered z-scored leading PC1 record of trace element ratios of , , and (see Fig. S3). The mean value of the PC1 record is presented. (g) Wavelet periodicity analysis result of δ18O. The 10 % significance level against red noise is shown as a thick contour. The vertical yellow bars in the right subpanel mark the anomalously positive episodes and the light blue bar indicates the subsequent δ18O overshoot after the 8.2 ka event.
2.2 230Th dating, stable isotope, and trace element analysis
A total of 22 230Th dates (Table S1 in the Supplement) were performed at University of Minnesota, USA, using Thermo-Finnigan Neptune multi-collector inductively coupled plasma mass spectrometers (MC-ICP-MS, Thermo Scientific). The methods are described in detail in Cheng et al. (2013). We followed standard chemistry procedures to separate uranium and thorium for instrument analysis (Edwards et al., 1987). A triple-spike (229Th–233U–236U) isotope dilution method was employed to correct instrumental fractionation and determine isotopic ratios and concentrations. Uncertainties in isotopic data were calculated offline at 2σ level. The chronology for the section of 15 to 48 mm is based on the combination of annual banding and 230Th dates as reported in previous study (Duan et al., 2023).
The stable oxygen and carbon isotopes (δ18O and δ13C) of speleothem BH-2 were determined on a Thermo Scientific MAT-253 isotope ratio mass spectrometer equipped with an online carbonate device (Kiel IV) at the Institute of Geology and Geophysics, Chinese Academy of Sciences and Isotope Laboratory of Xi'an Jiaotong University. The powdered subsamples weighing ∼30 µg were drilled along the central growth axis using a Micromill device and then reacted with ∼103 % phosphoric acid at 70 °C. The stable oxygen and carbon isotopic compositions of the generated CO2 gas were measured with working CO2 standard gas whose values have been calibrated by two international standards, NBS18 and IAEA-603. All results are reported as the per mil deviation relative to the Vienna Pee Dee Belemnite (VPDB). The reported precision of both δ18O and δ13C at 1σ level is better than 0.1 ‰.
Trace element ratios (, , ), of which the intensity ratio of emission lines are 285.2 nm (Mg), 407.8 nm (Sr), and 493.4 nm (Ba) relative to 373.7 nm (Ca), were measured using laser-induced breakdown spectroscopy (LIBS) following the detailed description in Li et al. (2018). In brief, analyses were performed by pulsing and focusing a yttrium aluminum garnet (Nd: YAG) laser beam to 0.1 mm. Emitted plasma from the stalagmite surface was collected by optical fibers and sent to a four-passage spectrometer (Ocean Optics MX500+) to obtain a spectrum within the 200 to 580 nm range. These data were determined through the intensity of the characteristic spectral line for each element, and then the intensity ratio of each trace element signal to Ca element was calculated and output as the final result for each point. The obtained record is the median intensity ratio based on 20 pulses at each sampling site after five laser shots to pre-clean the surface. The measurements were performed continuously along the speleothem's growth axis at a 0.3 mm increment and a total of 565 data were obtained. The accuracy of data was ensured through the excellent replicability between two-time measurements instead of inset standard materials because of the overwhelming quantity of Ca relative to trace elements in the speleothem. The original spectral data were processed using an interface created in MATLAB (2020). The typical standard deviation for the average intensity ratio is less than 0.02 (unitless).
3.1 230Th dates and age model
The 230Th dating results of the BH-2 are presented in Table S1, which shows that the BH-2 covers the interval between 9.0 and 7.9 ka. Almost all dates are in stratigraphic order within uncertainties. The average dating uncertainty is ±57 years at 2σ level. For the period from 8.25 to 8.11 ka, we present the speleothem record from Duan et al. (2023), which is based on the combination of the annual lamina counting and 230Th dates. In addition, here we use an updated chronology of the BH-2 based on the StalAge algorithm (Scholz and Hoffmann, 2011), which includes 11 additional ages from the remnant sections (Figs. 2b and S2). In detail, the fitted age and error for each annual band between 16 and 43 mm were obtained based on the least square method (Duan et al., 2023). To establish a consecutively composite chronology for the entire record, all these fitting results in 16–43 mm (corresponding to 8.077–8.324 ka) with uncertainties and the other 15 230Th dates in the remnant study section were input to StalAge algorithm. In this way, the seven 230Th dates drilled from 16–43 mm were only used in the layer band counting procedure but not the StalAge age model. The output results of StalAge were adopted as the reconstructed chronology for isotope and trace element records.
3.2 Stable isotopic compositions and growth rate
The BH-2 record contains 663 pairs of δ18O and δ13C data with a mean temporal resolution of ∼1.6 years. The δ18O values range from −7.1 ‰ to −11.5 ‰ with a mean of −9.3 ‰, and δ13C values vary from −8.0 ‰ to −12.1 ‰ with an average value of −10.2 ‰ (Fig. 2d and e). It can be seen that the δ13C profile follows the same general patterns as the δ18O (r=0.63, p<0.01). Compared to the later stage, although some fluctuations are included, the δ13C and δ18O profiles are relatively invariable before 8.52 ka. In contrast, the δ18O record exhibits a remarkable positive shift at ∼8.52–8.48 ka, during which period the δ13C record shifts less prominently in the positive direction but with a fluctuating increasing trend. The rebound from the positive shift in δ13C and δ18O profiles is followed by a less variable episode spanning 8.48–8.26 ka. Afterward, as the most remarkable feature, both records show extremely positive excursions spanning ∼8.26–8.14 ka (Fig. 2). The positive anomaly is followed by a shift to the opposite extreme to reach the most negative stage in the δ18O record during 8.14–8.05 ka, which is not conspicuous in the δ13C record.
The growth rate of the BH-2 established based on the reconstructed chronology (Figs. 2c and S2) is highly variable, with two peaks of more than 0.8 mm yr−1 at 8.85 and 8.51 ka. It is apparent that speleothem BH-2 was contiguously deposited without a visible growth hiatus, and the growth rate during 8.51–8.16 ka (<0.15 mm yr−1) is apparently lower relative to other intervals (>0.15 mm yr−1 on average). Specifically, there are obvious transitions from higher to lower growth rates at ∼8.51 ka and the opposite trend at ∼8.16 ka.
3.3 Trace element ratios
The trace element ratio records of two-time measurements are replicable, suggesting the robustness of the LIBS technique (Fig. S3). As can be seen, the signals in the records are quite variable (Figs. 2 and S3). The correlation coefficients (r) for pairs of and , of and , and of and are 0.24 (p<0.01), 0.49 (p<0.01), and 0.47 (p<0.01), respectively. Similar to δ18O and δ13C records, all of the , , and records display positive excursions at ∼8.50 and 8.20 ka despite the relative ambiguity of the former event in and the latter event in , respectively. In addition, there is another more positive excursion at ∼8.88–8.82 ka in the ratio record, which is absent in the other two records. After principal component analysis of the three records, the excursions at ∼8.50 and 8.20 ka are especially conspicuous (Fig. 2f). Different from the δ18O and δ13C variability, the PC1 result of the trace element ratio fluctuates frequently with considerable magnitude and shows a general decreasing trend before 8.52 ka. In the duration of 8.52–8.48 ka, it exhibits a fluctuating positive trend and a rapid rebound. Afterwards, the values remain relatively stable until ∼8.23 ka, when another positive excursion commences. In this excursion, the PC1 values culminate at ∼8.12 ka followed by a rapid rebound, which indicates the termination of this excursion. The values remain relatively stable after 8.10 ka.
4.1 Proxy interpretations
The replication test of δ18O records between the BH-2 from Huangyuan Cave and the KLS12 from nearby Kulishu Cave (W. Duan et al., 2021) by using the ISCAM (Intra-site Correlation Age Modeling) algorithm (Fohlmeister, 2012) show a significantly positive correlation (r=0.62, p<0.05) during 9.0–7.9 ka (Fig. S4), strongly suggesting that the influence of kinetic fractionation is likely insignificant and the carbonate deposition process is close to equilibrium (Dorale and Liu, 2009). Hence, the BH-2 δ18O signals reflect the changes in drip water δ18O, which in turn inherit from δ18Op related to the regional hydroclimate variations in general. Notably, the study site is located along the summer monsoon fringe with relatively low annual precipitation, and thus the thermodynamics variations in EASM in the areas can significantly bias the mean annual δ18O value, e.g., the summer rainfall amount. Indeed, modern observations (Duan al., 2016) and reanalysis results (Cheng et al., 2019; Zhang et al., 2019; He et al., 2021; Duan et al., 2023; Zhao et al., 2023) have proved that speleothem δ18O in the study area can be used as a reliable proxy to indicate the regional precipitation variations and the dynamic changes in the summer monsoon circulation; that is, depleted 18O corresponds to increased rainfall over the study area and strengthened EASM, and vice versa.
Under the equilibrium fractionation conditions, the carbon isotope ratios (δ13C) of speleothem carbonate reflect a mixture of three carbon sources: plant root-respired CO2 in the soil zone, atmospheric CO2, and dissolution of bedrock carbonate (McDermott, 2004), in which the plant-related CO2 is the most important for the variability in speleothem δ13C (Fairchild et al., 2006; Y. Li et al., 2020). It has been suggested that changes in the density of vegetative cover and biomass activity exert a critical impact on the speleothem δ13C variations in the study region, instead of the relative ratio of C3 (woody taxa) and C4 (grasses) plants (Duan et al., 2014). This is consistent with our observation that the δ13C values of speleothem BH-2 fall between −8 ‰ and −12 ‰, which is within the typical range for the C3-dominant plant coverage (McDermott, 2004; Fairchild et al., 2006). Although climate-induced changes in the karst system, like pCO2 degassing, water infiltration, and prior calcite precipitation (PCP) could also contribute to the δ13C changes (Fairchild and Treble, 2009; H. Li et al., 2020), the significant covariance of δ13C and δ18O in the BH-2 and the minor effect of kinetic fractionations, as mentioned, and the unbiased δ18O signal inherited from precipitation strongly suggest that the density of vegetative cover, the biomass activity, and the vadose of seepage solution dominated by regional hydroclimatic conditions could play a crucial role in the decadal-scale to centennial-scale variations in δ13C in speleothem BH-2. In addition to rainfall amount, the impact of temperature variations are non-negligible for the growth of plant and biomass activity as well.
The influence of PCP can be inferred from trace element concentrations such that strong (weak) PCP normally induces a high (low) trace element content relative to the calcium in the speleothem calcite (Johnson et al., 2006; Fairchild and Treble, 2009). In general, higher trace element ratio values indicate overall drier conditions when reduced infiltration and increased residence time in the epikarst above the cave favors faster CO2 degassing and PCP, inducing relatively higher trace element content in the cave drip water due to the preferential loss of Ca2+ along the deposition path; the opposite processes occur in wetter conditions (e.g., Cruz et al., 2007; Griffiths et al., 2010; Zhang et al., 2018). On the other hand, water–rock interaction may have been enhanced in the aquifer during drier conditions because of the prolonged residence time of fluid in the pathway, which tends to favor the leaching of Mg and Sr elements from the dolomite host rock (Fairchild et al., 2000) and eventually leads to the two elements' enrichment in drip water and hence in the speleothem. Apparently, both of the above mechanisms indicate that the trace element ratios can be used as a reliable proxy for local wetness conditions. Regarding the speleothem growth rate, the sharp drops and persistent lower values in this proxy corresponding to major positive δ18O and δ13C excursions signify that it most likely was controlled by a sufficient or insufficient supply of drip water and hence the local rainfall amount (e.g., Polyak et al., 2004; Banner et al., 2007).
The discrepancy among proxies could suggest that different factors exert influence on these signals in the meteoric water/cave aquifer/drip water/carbonate precipitation processes. One thing that should be emphasized here is that although both speleothem δ18O and trace element PC1 in this study are interpreted to reflect local rainfall amount, this does not mean that these two parameters are linearly related. In other words, strict correlation between two proxies cannot be always expected. In addition, the δ18O from original precipitation can be elevated in the processes from the earth surface to seepage due to possible evaporation loss, broadly resembling the impact of PCP on trace element ratios. Due to the resilience of the ecosystem to some degree, plant cover and biomass activity could exhibit more stable patterns relative to the δ18O and PC1 proxies and thus delayed or muted signals. Therefore, in this study, proxies are interpreted as follows: the speleothem δ18O variations mainly reflect the change in large-scale atmospheric circulation and are consistent over the entire EASM region following a pattern; trace element ratios mainly come from the change in precipitation amount, which further is related to, instead of strictly following, the atmospheric circulation pattern; the speleothem δ13C values record the fluctuation in vegetation cover and biomass activity dominated by hydroclimatic conditions. In summary, the broad similarity of multi-proxies (δ18O, δ13C, trace element ratios, and growth rate) in speleothem BH-2 suggests that all of them document changes in hydroclimatic characteristics (Fairchild and Treble, 2009), that is, the intensity of the EASM and associated rainfall amount presumably dominating the hydroclimatic variabilities over and in the cave in the study area.
4.2 Climate fluctuations between 9.0 and 7.9 ka in Beijing
The variability in the BH-2 δ18O record reveals inter-decadal to multi-decadal dry () or pluvial () oscillations from 9.0 to 7.9 ka without a distinct long-term trend (Fig. 2). One noticeable feature of our δ18O record is a switch from relatively muted to highly variable episodes divided at ∼8.52 ka, consistent with the absence and dominance of centennial to inter-decadal periodicity before and after 8.52 ka, respectively (Fig. 2g). The mechanism responsible for this phenomenon could be that, in the background of overall strengthened ASM during 9.0–8.0 ka, a series of abnormal climate events originating from the northern high latitudes led to relatively more-frequent high-amplitude oscillations in δ18O profiles and hence more prominent periodicity.
The first persistent drought, indicated by a positive δ18O excursion exceeding +1σ values for more than 15 years, initially started at 8.52 ka and terminated at 8.48 ka (8.5 ka event herein). The entire event is characterized by a saw-tooth structure with a dramatic 2.5 ‰ increase within ∼20 years and a 2.2 ‰ rebound within 20 years, indicating a fast weakened EASM and thus reduced precipitation in the study area. These arid conditions are supported by the contemporaneous trace element records, which show a remarkable positive shift that seems to strictly resemble the δ18O record regarding both the shape and duration, pointing to the changed dynamic process in the cave in response to the decreased precipitation water supply. Additionally, the high-to-low transition of growth rate commencing ∼8.52 ka presumably results from less drip water supply and further, in turn, reduced precipitation over the cave, marking the start of the EASM weakening. However, the change in vegetation indicated by the δ13C proxy is not immediate. It seems that the increasing δ13C trend begins later than other proxies and only exhibits a short excursion, probably indicating the nonlinear response of vegetation evolution to the hydroclimate change, especially in a short-time climate event. This could be related to the delayed shortage of subsurface water for plant growth and a muted response of ecological processes to the hydroclimatic variability in a relatively wet context as indicated by low δ18O and trace element values surrounding this excursion (P. Duan et al., 2021).
Following the end of the above arid excursion, another centennial oscillation in much temperate mode persisted to ∼8.25 ka. Subsequently, the BH-2 δ18O exhibited the most remarkable droughts with centennial positive excursions between ∼8.26 and 8.11 ka, conservatively corresponding to the 8.2 ka event (Duan et al., 2023). This drought event is also proved in the trace element records via the increased values, in concert with the decreased seepage water and hence enhanced PCP. In detailed structure, these trace element ratio records commonly show prominent positive excursions at ∼8.20 and 8.14 ka, the latter of which is especially elevated. However, the slowly increased pattern in the trace element ratio records from 8.26 to 8.18 ka is quite distinct from the δ18O record, in which its values dramatically increase in the first 70 years, suggesting the probably nonlinear relationship between regional climate (δ18O) and local hydroclimatic conditions (trace element ratios). Moreover, in this event, the δ13C exhibits a prominent positive shift, pointing to the decay of the ecosystem in this severe drought event. It is noteworthy that the variation pattern of δ13C in the 8.2 ka event is more similar to the δ18O relative to the 8.5 ka event. This absence of muted δ13C signal suggests the close relationship between the vegetation and regional hydroclimatic conditions in a long duration and more severe climatic deterioration. Intriguingly, the lower excursion of growth rate somehow predates other proxies. This inter-proxy discrepancy suggests that there are other potential factors, such as the temperature (Wong et al., 2015), controlling the cave dynamic processes, and the growth rate could be a more qualitative indicator to broadly constrain the hydroclimatic conditions in combination with other proxies.
Afterward, the hydroclimatic conditions go to the reverse side of the extreme, manifesting in a multi-decadal excessive rebound (i.e., overshoot), attaining the lowest δ18O values (−11.5 ‰) of the entire record, suggesting the strongest pluvial event (Duan et al., 2023). This overshoot is additionally supported by a trace element ratio record, which shows quite low values relative to the period before 8.52 ka. However, the rebound of the δ13C during the post-8.2 ka event is not as conspicuous as the δ18O overshoot and only reaches the mean level of that preceding the 8.5 ka event. These features further illustrate the aforementioned nonlinear relationship among the variabilities of regional climate, local hydrological conditions, and ecosystem. In other words, the coverage of vegetation and soil microbiological activity during the overshoot event did not recover to the initial conditions before the 8.2 ka event.
The different behavior of δ13C after two similar severe droughts at 8.50 and 8.20 ka suggests the ecosystem had a degree of resilience to the different rebound rainfall intensity. For the 8.5 ka event, the subsequent rebound of δ13C to its prior value suggests the high-level resilience of the plant community to environmental variations under the moderate precipitation amount as indicated by the δ18O and trace element ratio records. In contrast, the suddenly excessive increase in precipitation after the 8.2 ka event, which was much more than that before the event, could have suppressed the recovery of vegetation and soil biological activity and thus the moderate rebound of δ13C values. Theoretically, the longer weakened atmospheric circulation during the 8.2 ka event and reduced precipitation presumably induced deteriorated vegetation as well as poorly developed soil. However, it seems that the precipitation intensity after the 8.2 ka event exerted a key role in the recovery of vegetation density and soil productivity. Specifically, the severe 8.2 ka drought event had a profoundly negative impact on the vegetation–soil system and led them to become more vulnerable under the water shortage conditions. On the other hand, the excessive precipitation after this drought could cause soil erosion and further ecological damage, suppressing the ecosystem recovery above the cave as well as the δ13C signals in the speleothem. Conclusively, the ecosystem in this karst region was quite vulnerable and the variability in the vegetation–soil system here was tied to local hydrologic conditions with both high and low thresholds.
To summarize, akin to the δ18O record, other proxy records of the BH-2 (Fig. 2) delineate two major drought events, indicated by prominent excursions centered at 8.50 and 8.20 ka, respectively, suggesting vegetation degeneration (Duan et al., 2014) and elevated prior calcite precipitation (PCP) arising from the longer residence time of the solution in the karst aquifer (e.g., Johnson et al., 2006; Fairchild and Treble, 2009), both of which responded to the deteriorated hydroclimatic conditions. The discrepancy between them suggest that drivers other than only hydroclimatic conditions could have played a non-negligible role in the processes of speleothem formation. In particular, the intensity of the EASM (δ18O) and the precipitation amount (trace element ratio) over the study area presumably were correlated in a broad pattern but did not necessarily exactly follow each other.
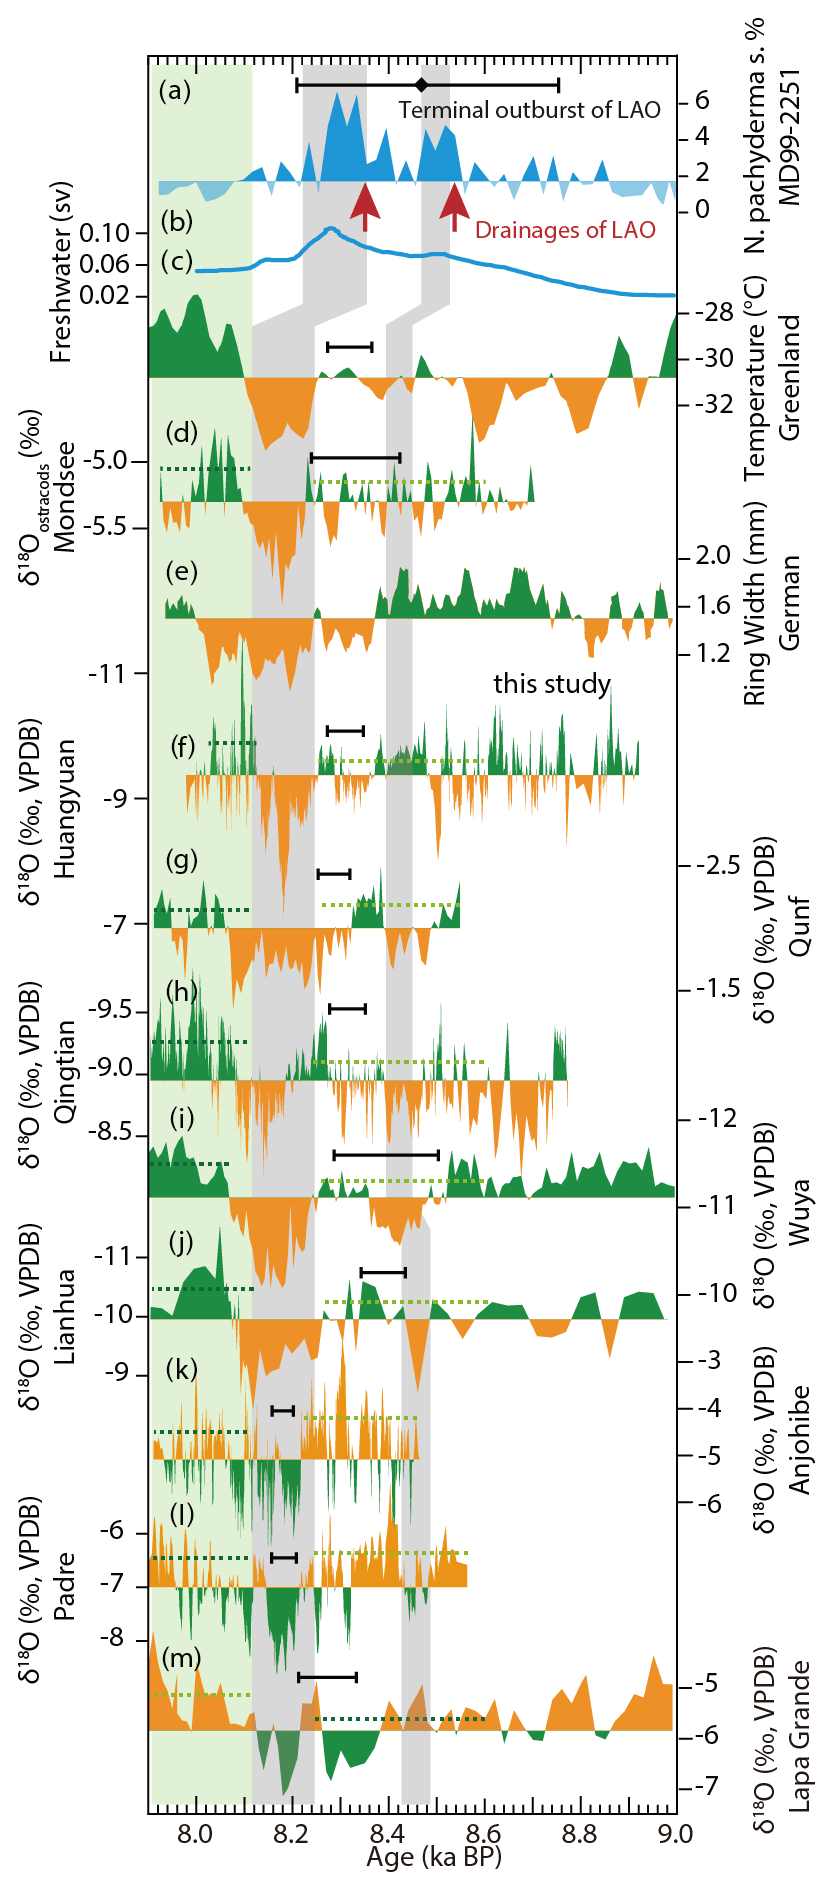
Figure 3Comparisons of the BH-2 δ18O record with records from circum-North Atlantic, ASM domain, and South America. (a) N. pachyderma abundance record from MD03-2665, North Atlantic (Ellison et al., 2006). The black diamond and error bar on the top indicate the dating of terminal outburst of LAO (Barber et al., 1999). The red arrows point to the two-step drainages of LAO into the North Atlantic. (b) Modeled freshwater flux from Laurentide Ice Sheet in units of sverdrups (Sv) (Matero et al., 2020). (c) Reconstructed temperature in Greenland (Kobashi et al., 2017). (d) δ18Oostracods record from Mondsee, Austria (Andersen et al., 2017). (e) Ring width of tree from Germany (Spurk et al., 2002). (f) The BH-2 δ18O record from Huangyuan Cave, Beijing (this study). (g) High-resolution δ18O record (Fleitmann et al., 2003) from Qunf Cave with more precise ages (Cheng et al., 2009) (h) δ18O record from Qingtian Cave, China (Liu et al., 2015). (i) δ18O record from Wuya Cave, northwest China (Tan et al., 2020). (j) δ18O record from Lianhua Cave, North China (Dong et al., 2018). (k) δ18O record from Anjohibe Cave, northwest Madagascar (P. Duan et al., 2021). (l) High-resolution δ18O record from Padre Cave, Brazil, on the OxCal-derived chronology based on the 230Th dates of Cheng et al. (2009). (m) High-resolution δ18O record from Lapa Grande Cave, Brazil (Stríkis et al., 2011). The δ18O scale of (k)–(m) is inverse to other speleothem records. The vertical gray shading bars indicate the events centered at 8.5 and 8.2 ka and the green shading bar marks the post-8.2 ka event. The δ18O value lower than the mean value of the entire records from the Northern Hemisphere and the Greenland reconstructed temperature record higher than the mean value of the entire record are shaded in green. The δ18O values higher than the mean value of the entire records from the Southern Hemisphere are shaded in brown. The horizontal dashed green lines in each record indicate the mean δ18O values for the age range they cover before (8.60–8.22 ka) and after (8.10–7.90 ka) the 8.2 ka event. The typical errors in dating are shown as a black bar in each curve.
4.3 Spatial patterns for the two droughts–one pluvial pattern and underlying mechanisms
This two droughts–one pluvial pattern from 8.52 to 8.0 ka in speleothem BH-2 represents global-scale climate disturbance signals rather than a regional phenomenon since these climate excursions have been widely documented (Figs. 3 and S1). In the ASM domain, speleothem records from caves such as Lianhua (Dong et al., 2018) and Wuya (Tan et al., 2020) in North and northwest China and Qingtian Cave (Liu et al., 2015) in central China exhibit structure consistent with the BH-2 at around 8.2 ka. In particular, a broad anomaly spanning ∼340 years between 8.46 and 8.12 ka has been revealed (Tan et al., 2020), and we find the post-8.2 ka overshoot is also distinguishable (Fig. 3) in the speleothem δ18O record from the western Chinese Loess Plateau, which is situated in the northern limit of the ASM. Unlike these north-located records, although a prominent 8.2 ka event is documented in a speleothem of Heshang Cave in central China (Liu et al., 2013), the preceded excursion is ambiguous and the post-8.2 ka event anomaly is absent. Coincidently, a similar phenomenon seems to occur in the central monsoon domain, like in Dongge Cave in South China (Cheng et al., 2009) and Tham Doun Mai Cave in northern Laos (Wood et al., 2023). This probably suggests that, compared to the low latitudes, the climate in the north part (or the margin area) of the ASM is more sensitive to the climate perturbation signals originating from the high northern latitude regions. Through affecting the westerly changes, high northern latitude climate variations can finally strongly influence the EASM (Chiang et al., 2015; Duan et al., 2016; Tan et al., 2020).
In the low latitudes of the Indian summer monsoon realm, the speleothem δ18O record from Hoti Cave is remarkably consistent with the pattern in our record. Specifically, Hoti Cave record shows positive δ18O excursions by ∼2 ‰ in amplitude, centering on ∼8.42 ka, and a growth hiatus at 8.2 ka surrounded by enriched 18O, pointing to the drought conditions due to the weakened Indian summer monsoon attendant with a southward shift of the intertropical convergence zone (ITCZ). After the growth resumption, an overshoot can be identified (Cheng et al., 2009). It happens that the two positive excursions are quite pronounced in nearby Qunf Cave (Fig. 3) (Cheng et al., 2009), whereas the overshoot is absent. Collectively, records from more sensitive areas in the ASM domain preserved intact the two droughts–one pluvial pattern, while the pre-8.2 ka event or the overshoot is missed in records from insensitive regions.
In the North Atlantic region, Greenland ice core δ18O (Thomas et al., 2007) and reconstructed temperature based on argon and nitrogen isotopes (Kobashi et al., 2017) captured both the 8.2 ka event and ensuing overshoot, and the pre-8.2 ka event is apparent in the temperature profile but ambiguous or slightly excursed (Jennings et al., 2015) in the δ18O records. Indeed, the atmospheric circulation over Greenland has substantially changed since ∼8.5 ka as suggested by increased potassium and calcium ions, indicators of dust supply to Greenland, as well as decreased snow-accumulation rate (Rohling and Pälike, 2005; Kobashi et al., 2017; Burstyn et al., 2019). The absent signal of the pre-8.2 ka event in δ18O records could be attributed to the compensation of other processes like precipitation seasonality and summer warming (He et al., 2021). The prolonged climate anomalies around 8.2 ka are further supported by two negative anomalies in speleothem δ18O records from Italy (Domínguez-Villar et al., 2009) and Hungary (Demény et al., 2023), lower tree ring width from 8.42 to 8.0 ka in Germany (Spurk et al., 2002), and degraded climate conditions between 8.45 and 8.10 ka revealed by speleothem proxies from Père Noël Cave in Belgium (Allan et al., 2018). All of these collectively suggest that a series of pronounced climate oscillations between 8.5 and 8.0 ka, instead of merely the 8.2 ka event, is of hemispheric significance (Rohling and Pälike, 2005). In North America, multi-proxy speleothem records manifest a more sustained increase in precipitation in both the precursor and 8.2 ka event responding to the increased North Pacific storm in California (de Wet et al., 2021).
Similar but antiphase patterns are observed in the records from the Southern Hemisphere. For example, it appears that the speleothem record from Lapa Grand Cave in east Brazil (Stríkis et al., 2011) captured the two pluvial-one drought structure (Fig. 3). Intriguingly, although the speleothem record from Padre Cave (Cheng et al., 2009) fails to preserve a remarkable pre-8.2 ka event (Fig. 3), two negative short excursions and a seemingly negative trend can be observed from 8.34 to 8.23 ka. In addition, the beginning deposit of speleothem in Padre Cave at ∼8.5 ka, coeval with the reduced precipitation in the ASM domain, likely reflects more favorable hydroclimatic conditions due to more precipitation, which in turn could arise from an intensified South American summer monsoon associated with the southward displacement of the ITCZ (Wang et al., 2004), suggesting the possible occurrence of the pre-8.2 ka event there. Coincidently, the speleothem growth resumption after a long hiatus (P. Duan et al., 2021), together with the negative trend of the speleothem δ18O record (Voarintsoa et al., 2019) in northwest Madagascar commenced at ∼8.5 ka and persisted until the end of the 8.2 ka event, indicative of more precipitation in response to the southward ITCZ shift, suggesting the extent of the pre-8.2 ka event to within the East Africa monsoon domain. However, the post-8.2 ka event was not clearly identified by the northwest Madagascar record and thus more evidence is needed.
The two droughts–one pluvial pattern revealed in our BH-2 records could mainly correspond to the waxing and waning of drainages of Lake Agassiz–Ojibway (LAO) (Barber et al., 1999; Ellison et al., 2006) and contemporary ice sheet melted freshwater flux (Matero et al., 2017, 2020) (Fig. 3), both of which are causally related to the AMOC strength dynamics. Firstly, the major two-step outburst of the LAO (e.g., Ellison et al., 2006; Kleiven et al., 2008; Jennings et al., 2015; Lochte et al., 2019; Godbout et al., 2019, 2020) and the continuous Laurentide Ice Sheet (LIS) melting together contributed to the increase in total freshwater flux (e.g., Morrill et al., 2014; Matero et al., 2017, 2020), inducing the observed sea level rise in North Atlantic commencing at ∼8.5 ka (Hijma and Cohen, 2010), leading to cooler conditions initially in the circum-North Atlantic region and extending into other areas through fast atmospheric propagations (Cheng et al., 2009, 2020; Liu et al., 2013; Buizert et al., 2018; P. Duan et al., 2021). Coincident with enriched 18Op in most ASM domains, the intensity of the East Asian summer monsoon was weakened (Cheng et al., 2009) and less precipitation fell in the Beijing area (Duan et al., 2023). In contrast, due to the southward displacement of the ITCZ in response to the hemispheric thermal contrast, the Southern Hemisphere, like northeast Madagascar and east Brazil, received more precipitation (i.e., stronger monsoon) and thus speleothem records there exhibit depleted 18Op. Further, the simulated smaller freshwater flux peak at ∼8.5 ka relative to the second one at 8.2 ka (Fig. 3) (Matero et al., 2020) could provide a potential explanation for the lower amplitude and shorter duration of the pre-8.2 ka event relative to the 8.2 ka event in our record and the absence of the pre-8.2 ka event in other records. Additionally, the 8.2 ka event is preceded by a remarkable reduction in solar activity, by ∼1 W m−2, with a duration of ∼150 years, beginning at ∼8.45 ka (Rohling and Pälike, 2005; Steinhilber et al., 2009; Wanner et al., 2011; Burstyn et al., 2019), and an increase in the magnitude and frequency of volcanic eruptions (Kobashi et al., 2017; Burstyn et al., 2019), both of which are also thought to contribute to the prolonged climate disturbance via different impacts on atmospheric processes.
On the other hand, the overshoot in the ASM domain could be remotely related to the higher temperature in the North Atlantic (Kobashi et al., 2017; Andersen et al., 2017) (Fig. 3) which in turn possibly arose from the remarkably sped-up AMOC (Ellison et al., 2006; Renold et al., 2010; Mjell et al., 2015; Andersen et al., 2017). The accelerated AMOC led to more heat release in the North Atlantic and anomalously strengthened ASM. Meanwhile, the ITCZ and associated rain belt were displaced northwards, causing less precipitation in east Brazil as evidenced by positive δ18O excursion of speleothem from Lapa Grande Cave (Fig. 3).
The multi-proxy records of speleothem BH-2 from Beijing, North China, document the multi-decadal to centennial-scale hydroclimate changes with two arid episodes at ∼8.5 and 8.2 ka, and an immediately ensuing excessive rebound after the 8.2 ka event. A comparison with other paleoclimate records suggests that these prominent climate fluctuations with a two droughts–one pluvial pattern should be a global signal instead of a regional phenomenon. We propose that the slowdown and resumption of the AMOC controlled by the freshwater flux into the North Atlantic and the resultant reorganization of the atmospheric circulation during the study stage mainly contribute to the arid and pluvial excursions, and the influence of volcanic outbursts and reduced solar activity are also non-negligible.
All data needed to evaluate the conclusions in the paper are presented in the paper. The data can be downloaded from the NOAA National Climate Data Center (https://www.ncdc.noaa.gov/data-access/paleoclimatology-data, 2024).
The supplement related to this article is available online at: https://doi.org/10.5194/cp-20-1401-2024-supplement.
PD, HL, and HC designed the research and experiments. PD wrote the first draft of the paper. HL, HC, and AS revised the paper. ZM did the fieldwork and collected the samples. ZM and HC conducted the 230Th dating. ZM, HC, and PD conducted the multi-proxy measurements. All authors discussed the results and provided inputs to the paper.
The contact author has declared that none of the authors has any competing interests.
Publisher's note: Copernicus Publications remains neutral with regard to jurisdictional claims made in the text, published maps, institutional affiliations, or any other geographical representation in this paper. While Copernicus Publications makes every effort to include appropriate place names, the final responsibility lies with the authors.
We especially thank Ming Tan and Wuhui Duan from the Institute of Geology and Geophysics, Chinese Academy of Sciences for their helpful suggestions. We also thank Haibo Wang, Lijuan Sha and Jiayu Lu for their help in the sample measurements and data curation. We thank the editor Russell Drysdale, two anonymous referees, and Xing Cheng for their constructive suggestions and comments.
This research has been supported by the National Natural Science Foundation of China grants (grant nos. 42488201 and 42150710534 to Hai Cheng, 42230812 to Guangyou Zhu, and 42102229 to Hanying Li) and the China Postdoctoral Science Foundation (grant no. 2021M692522).
This paper was edited by Russell Drysdale and reviewed by two anonymous referees.
Aguiar, W., Meissner, K. J., Montenegro, A., Prado, L., Wainer, I., and Carlson, A. E.: Magnitude of the 8.2 ka event freshwater forcing based on stable isotope modelling and comparison to future Greenland melting, Sci. Rep., 11, 1–10, https://doi.org/10.1038/s41598-021-84709-5, 2021.
Allan, M., Fagel, N., van der Lubbe, H. J. L., Vonhof, H. B., Cheng, H., Edwards, R. L., and Verheyden, S.: High-resolution reconstruction of 8.2-ka BP event documented in Père Noël cave, southern Belgium, J. Quaternary Sci., 33, 840–852, https://doi.org/10.1002/jqs.3064, 2018.
Alley, R. B., Mayewski, P. A., Sowers, T., Stuiver, M., Taylor, K. C., and Clark, P. U.: Holocene climatic instability: a prominent, widespread event 8200 yr ago, Geology, 25, 483–486, https://doi.org/10.1130/0091-7613(1997)025<0483:HCIAPW>2.3.CO;2, 1997.
Andersen, N., Lauterbach, S., Erlenkeuser, H., Danielopol, D. L., Namiotko, T., and Hüls, M.: Evidence for higher-than-average air temperatures after the 8.2 ka event provided by a Central European δ18O record, Quaternary Sci. Rev., 172, 96–108, https://doi.org/10.1016/j.quascirev.2017.08.001, 2017.
Baker, A., Asrat, A., Fairchild, I. J., Leng, M. J., Wynn, P. M., Bryant, C., Genty, D., and Umer, M.: Analysis of the climate signal contained within δ18O and growth rate parameters in two Ethiopian stalagmites, Geochim. Cosmochim. Ac., 71, 2975–2988, https://doi.org/10.1016/j.gca.2007.03.029, 2007.
Banner, J. L., Guilfoyle, A., James, E. W., Stern, L. A., and Musgrove, M.: Seasonal variations in modern speleothem calcite growth in central Texas, USA, J. Sediment. Res., 77, 615–622, https://doi.org/10.2110/jsr.2007.065, 2007.
Barber, D. C., Dyke, A., Hillaire-Marcel, C., Jennings, A. E., Andrews, J. T., and Kerwin, M. W.: Forcing of the cold event of 8,200 years ago by catastrophic drainage of Laurentide lakes, Nature, 400, 344–348, https://doi.org/10.1038/22504, 1999.
Buizert, C., Sigl, M., Severi, M., Markle, B. R., Wettstein, J. J., and McConnell, J. R.: Abrupt ice-age shifts in southern westerly winds and Antarctic climate forced from the north, Nature, 563, 681–685, https://doi.org/10.1038/s41586-018-0727-5, 2018.
Burstyn, Y., Martrat, B., Lopez, J. F., Iriarte, E., Jacobson, M. J., Lone, M. A., and Deininger, M.: Speleothems from the Middle East: an example of water limited environments in the SISAL database, Quaternary, 2, 16, https://doi.org/10.3390/quat2020016, 2019.
Cheng, H., Fleitmann, D., Edwards, R. L., Wang, X., Cruz, F. W., and Auler, A. S.: Timing and structure of the 8.2 kyr B.P. event inferred from δ18O records of stalagmites from China, Oman, and Brazil, Geology, 37, 1007–1010, https://doi.org/10.1130/G30126A.1, 2009.
Cheng, H., Edwards, R. L., Shen, C. C., Polyak, V. J., Asmerom, Y., and Woodhead, J.: Improvements in 230Th dating, 230Th and 234U half-life values, and U-Th isotopic measurements by multi-collector inductively coupled plasma mass spectrometry, Earth. Planet. Sc. Lett., 371–372, 82–91, https://doi.org/10.1016/j.epsl.2013.04.006, 2013.
Cheng, H., Zhang, H., Spotl, C., Baker, J., Sinha, A., and Li, H.: Timing and structure of the Younger Dryas event and its underlying climate dynamics, P. Natl. Acad. Sci. USA., 117, 23408–23417, https://doi.org/10.1073/pnas.2007869117, 2020.
Cheng, H., Li, H., Sha, L., Sinha, A., Shi, Z., Yin, Q., Lu, Z., Zhao, D., Cai, Y., Hu, Y., Hao, Q., Tian, J., Kathayat, G., Dong, X., Zhao, J., and Zhang, H.: Milankovitch theory and monsoon, Innovation, 3, 100338, https://doi.org/10.1016/j. xinn.2022.100338, 2022.
Chiang, J. C., Fung, I. Y., Wu, C. H., Cai, Y., Edman, J. P., Liu, Y., and Labrousse, C. A.: Role of seasonal transitions and westerly jets in East Asian paleoclimate, Quaternary Sci. Rev., 108, 111–129, https://doi.org/10.1016/j.quascirev.2014.11.009, 2015.
Cruz, F., Burns, S., Jercinovic, M., Karmann, I., Sharp, W., and Vuille, M.: Evidence of rainfall variations in Southern Brazil from trace element ratios ( and ) in a Late Pleistocene stalagmite, Geochem. Cosmochim. Ac., 71, 2250–2263, https://doi.org/10.1016/j.gca.2007.02.005, 2007.
Daley, T. J., Street-Perrott, F. A., Loader, N. J., Barber, K. E., Hughes, P. D., Fisher, E. H., and Marshall, J. D.: Terrestrial climate signal of the “8200 yr BP cold event” in the Labrador Sea region, Geology, 37, 831–834, https://doi.org/10.1130/G30043A.1, 2009.
Demény, A., Czuppon, G., Kern, Z., Hatvani, I. G., Topál, D., Karlik, M., and May, Z.: A speleothem record of seasonality and moisture transport around the 8.2 ka event in Central Europe (Vacska Cave, Hungary), Quat. Res., 118, 195–210, https://doi.org/10.1017/qua.2023.33, 2023.
de Wet, C. B., Erhardt, A. M., Sharp, W. D., Marks, N. E., Bradbury, H. J., Turchyn, A. V., and Oster, J. L.: Semiquantitative estimates of rainfall variability during the 8.2 kyr event in California using speleothem calcium isotope ratios, Geophys. Res. Lett., 48, e2020GL089154, https://doi.org/10.1029/2020GL089154, 2021.
Domínguez-Villar, D., Fairchild, I. J., Baker, A., Wang, X., Edwards, R. L., and Cheng, H.: Oxygen isotope precipitation anomaly in the North Atlantic region during the 8.2 ka event, Geology, 37, 1095–1098, https://doi.org/10.1130/G30393A.1, 2009.
Dong, J., Shen, C. C., Kong, X., Wu, C. C., Hu, H. M., Ren, H., and Wang, Y.: Rapid retreat of the East Asian summer monsoon in the middle Holocene and a millennial weak monsoon interval at 9 ka in northern China, J. Asian Earth Sci., 151, 31–39, https://doi.org/10.1016/j.jseaes.2017.10.016, 2018.
Dorale, J. A. and Liu, Z.: Limitations of Hendy test criteria in judging the paleoclimatic suitability of speleothems and the need for replication, J. Caves Karst Stud., 71, 73–80, 2009.
Duan, P., Li, H., Sinha, A., Voarintsoa, N. R. G., Kathayat, G., Hu, P., and Cheng, H.: The timing and structure of the 8.2 ka event revealed through high-resolution speleothem records from northwestern Madagascar, Quaternary Sci. Rev., 268, 107104, https://doi.org/10.1016/j.quascirev.2021.107104, 2021.
Duan, P., Li, H., Ma, Z., Zhao, J., Dong, X., Sinha, A., and Cheng, H.: Interdecadal to centennial climate variability surrounding the 8.2 ka event in North China revealed through an annually resolved speleothem record from Beijing, Geophys. Res. Lett., 50, e2022GL101182, https://doi.org/10.1029/2022GL101182, 2023.
Duan, W., Tan, M., Ma, Z., and Cheng, H.: The palaeoenvironmental significance of δ13C of stalagmite BH-1 from Beijing, China during Younger Dryas intervals inferred from the grey level profile, Boreas, 43, 243–250, https://doi.org/10.1111/bor.12034, 2014.
Duan, W., Ruan, J., Luo, W., Li, T., Tian, L., and Zeng, G.: The transfer of seasonal isotopic variability between precipitation and drip water at eight caves in the monsoon regions of China, Geochim. Cosmochim. Ac., 183, 250–266, https://doi.org/10.1016/j.gca.2016.03.037, 2016.
Duan, W., Ma, Z., Tan, M., Cheng, H., Edwards, R. L., and Wen, X.: Timing and structure of early-Holocene climate anomalies inferred from north Chinese stalagmite records, Holocene, 31, 1777–1785, https://doi.org/10.1177/09596836211033218, 2021.
Edwards, R. L., Chen, J. H., and Wasserburg, G. J.: 238U-234U-230Th-232Th systematics and the precise measurement of time over the past 500,000 years, Earth Planet. Sc. Lett., 81, 175–192, https://doi.org/10.1016/0012-821X(87)90154-3, 1987.
Ellison, C. R., Chapman, M. R., and Hall, I. R.: Surface and deep ocean interactions during the cold climate event 8200 years ago, Science, 312, 1929–1932, https://doi.org/10.1126/science.1127213, 2006.
Fairchild, I. J. and Treble, P. C.: Trace elements in speleothems as recorders of environmental change, Quaternary Sci. Rev., 449–468, https://doi.org/10.1016/j.quascirev.2008.11.007, 2009.
Fairchild, I. J., Borsato, A., Tooth, A. F., Frisia, S., Hawkesworth, C. J., Huang, Y., and Spiro, B.: Controls on trace element (Sr-Mg) compositions of carbonate cave waters: implications for speleothem climatic records, Chem. Geol., 166, 255–269, https://doi.org/10.1016/S0009-2541(99)00216-8, 2000.
Fairchild, I. J., Smith, C. L., Baker, A., Fuller, L., Spötl, C., Mattey, D., Chem. Geol., and McDermott, F.: Modification and preservation of environmental signals in speleothems, Earth-Sci. Rev., 75, 105–153, https://doi.org/10.1016/j.earscirev.2005.08.003, 2006.
Fleitmann, D., Burns, S. J., Mudelsee, M., Neff, U., Kramers, J., Mangini, A., and Matter, A.: Holocene forcing of the Indian monsoon recorded in a stalagmite from southern Oman, Science, 300, 1737–1739, https://doi.org/10.1126/science.1083130, 2003.
Fohlmeister, J.: A statistical approach to construct composite climate records of dated archives, Quatern. Geochronol., 14, 48–56, https://doi.org/10.1016/j.quageo.2012.06.007, 2012.
Godbout, P. M., Roy, M., and Veillette, J. J.: High-resolution varve sequences record one major late-glacial ice readvance and two drainage events in the eastern Lake Agassiz-Ojibway basin, Quaternary Sci. Rev., 223, 105942, https://doi.org/10.1016/j.quascirev.2019.105942, 2019.
Godbout, P. M., Roy, M., and Veillette, J. J.: A detailed lake-level reconstruction shows evidence for two abrupt lake drawdowns in the late-stage history of the eastern Lake Agassiz-Ojibway basin, Quaternary Sci. Rev., 238, 106327, https://doi.org/10.1016/j.quascirev.2020.106327, 2020.
Griffiths, M., Drysdale, R., Gagan, M., Frisia, S., Zhao, J., Ayliffe, L., Hantoro, W., Hellstrom, J., Fischer, M., and Feng, Y.: Evidence for Holocene changes in Australian-Indonesian monsoon rainfall from stalagmite trace element and stable isotope ratios, Earth Planet. Sc. Lett., 292, 27–38, https://doi.org/10.1016/j.epsl.2010.01.002, 2010.
He, C., Liu, Z., Otto-Bliesner, B. L., Brady, E. C., Zhu, C., Tomas, R., and Bao, Y.: Hydroclimate footprint of pan-Asian monsoon water isotope during the last deglaciation, Sci. Adv., 7, eabe2611, https://doi.org/10.1126/sciadv.abe2611, 2021.
Hersbach, H., Bell, B., Berrisford, P., Hirahara, S., Horányi, A., and Muñoz-Sabater, J.: The ERA5 global reanalysis, Q. J. Roy. Meteorol. Soc., 146, 1999–2049, https://doi.org/10.1002/qj.3803, 2020.
Hijma, M. P. and Cohen, K. M.: Timing and magnitude of the sea-level jump preluding the 8200 yr event, Geology, 38, 275–278, https://doi.org/10.1130/G30439.1, 2010.
Jennings, A., Andrews, J., Pearce, C., Wilson, L., and Ólfasdótttir, S.: Detrital carbonate peaks on the Labrador shelf, a 13–7 ka template for freshwater forcing from the Hudson Strait outlet of the Laurentide Ice Sheet into the subpolar gyre, Quaternary Sci. Rev., 107, 62–80, https://doi.org/10.1016/j.quascirev.2014.10.022, 2015.
Johnson, K. R., Hu, C., Belshaw, N. S., and Henderson, G. M.: Seasonal trace-element and stable-isotope variations in a Chinese speleothem: The potential for high-resolution paleomonsoon reconstruction, Earth Planet. Sc. Lett., 244, 394–407, https://doi.org/10.1016/j.epsl.2006.01.064, 2006.
Kerwin, M. W.: A regional stratigraphic isochron (ca. 8000 14C yr BP) from final deglaciation of Hudson Strait, Quatern. Res., 46, 89–98, https://doi.org/10.1006/qres.1996.0049, 1996.
Kleiven, H. K. F., Kissel, C., Laj, C., Ninnemann, U. S., Richter, T. O., and Cortijo, E.: Reduced North Atlantic deep water coeval with the glacial Lake Agassiz freshwater outburst, Science, 319, 60–64, https://doi.org/10.1126/science.1148924, 2008.
Kobashi, T., Severinghaus, J. P., Brook, E. J., Barnola, J.-M., and Grachev, A. M.: Precise timing and characterization of abrupt climate change 8200 years ago from air trapped in polar ice, Quaternary Sci. Rev., 26, 1212–1222, https://doi.org/10.1016/j.quascirev.2007.01.009, 2007.
Kobashi, T., Menviel, L., Jeltsch-Thömmes, A., Vinther, B. M., Box, J. E., and Muscheler, R.: Volcanic influence on centennial to millennial Holocene Greenland temperature change, Sci. Rep., 7, 1–10, https://doi.org/10.1038/s41598-017-01451-7, 2017.
Krklec, K. and Dominguez-Villar, D.: Quantification of the impact of moisture source regions on the oxygen isotope composition of precipitation over Eagle Cave, central Spain, Geochim. Cosmochim. Ac., 134, 39–54, https://doi.org/10.1016/j.gca.2014.03.011, 2014.
Lajeunesse, P. and St-Onge, G.: The subglacial origin of the Lake Agassiz-Ojibway final outburst flood, Nat. Geosci., 1, 184–188, https://doi.org/10.1038/ngeo130, 2008.
Lawrence, T., Long, A. J., Gehrels, W. R., Jackson, L. P., and Smith, D. E.: Relative sea-level data from southwest Scotland constrain meltwater-driven sea-level jumps prior to the 8.2 kyr BP event, Quaternary Sci. Rev., 151, 292–308, https://doi.org/10.1016/j.quascirev.2016.06.013, 2016.
Li, H., Cheng, H., and Wang, J.: Applications of laser induced breakdown spectroscopy to paleoclimate research: reconsturcting speleothem trace element records, Quaternary Sci., 38, 1549–1551, 2018.
Li, H., Sinha, A., Anquetil André, A., Spötl, C., Vonhof, H. B., Meunier, A., and Cheng, H.: A multimillennial climatic context for the megafaunal extinctions in Madagascar and Mascarene Islands, Sci. Adv., 6, eabb2459, https://doi.org/10.1126/sciadv.abb2459, 2020.
Li, X., Cheng, H., Tan, L., Ban, F., Sinha, A., and Duan, W.: The East Asian summer monsoon variability over the last 145 years inferred from the Shihua Cave record, North China, Sci. Rep., 7, 7078, https://doi.org/10.1038/s41598-017-07251-3, 2017.
Li, Y., Rao, Z., Xu, Q., Zhang, S., Liu, X., Wang, Z., and Chen, F.: Inter-relationship and environmental significance of stalagmite δ13C and δ18O records from Zhenzhu Cave, north China, over the last 130 ka, Earth Planet. Sc. Lett., 536, 116149, https://doi.org/10.1016/j.epsl.2020.116149, 2020.
Liu, D., Wang, Y., Cheng, H., Edwards, R. L., and Kong, X.: Cyclic changes of Asian monsoon intensity during the early mid-Holocene from annually-laminated stalagmites, central China, Quaternary Sci. Rev., 121, 1–10, https://doi.org/10.1016/j.quascirev.2015.05.003, 2015.
Liu, Y., Henderson, G. M., Hu, C., Mason, A. J., Charnley, N., and Johnson, K. R.: Links between the East Asian monsoon and north Atlantic climate during the 8,200 year event, Nat. Geosci., 6, 117–120, https://doi.org/10.1038/ngeo1708, 2013.
Lochte, A. A., Repschläger, J., Kienast, M., Garbe-Schönberg, D., Andersen, N., and Hamann, C.: Labrador Sea freshening at 8.5 ka BP caused by Hudson Bay Ice Saddle collapse, Nat. Commun., 10, 1–9, https://doi.org/10.1038/s41467-019-08408-6, 2019.
Ma, Z., Cheng, H., Tan, M., Edwards, R. L., Li, H., and You, C.: Timing and structure of the Younger Dryas event in northern China, Quaternary Sci. Rev., 41, 83–93, https://doi.org/10.1016/j.quascirev.2012.03.006, 2012.
Matero, I. S. O., Gregoire, L. J., Ivanovic, R. F., Tindall, J. C., and Haywood, A. M.: The 8.2 ka cooling event caused by Laurentide ice saddle collapse, Earth Planet. Sc. Lett., 473, 205–214, https://doi.org/10.1016/j.epsl.2017.06.011, 2017.
Matero, I. S., Gregoire, L. J., and Ivanovic, R. F.: Simulating the Early Holocene demise of the Laurentide Ice Sheet with BISICLES (public trunk revision 3298), Geosci. Model. Dev., 13, 4555–4577, https://doi.org/10.5194/gmd-13-4555-2020, 2020.
McDermott, F.: Palaeo-climate reconstruction from stable isotope variations in speleothems: a review, Quaternary Sci. Rev., 23, 901–918, https://doi.org/10.1016/j.quascirev.2003.06.021, 2004.
Mjell, T. L., Ninnemann, U. S., Eldevik, T., and Kleiven, H. K. F.: Holocene multidecadal-to millennial-scale variations in Iceland-Scotland overflow and their relationship to climate, Paleoceanography, 30, 558–569, https://doi.org/10.1002/2014PA002737, 2015.
Morrill, C., Anderson, D. M., Bauer, B. A., Buckner, R., Gille, E. P., Gross, W. S., Hartman, M., and Shah, A.: Proxy benchmarks for intercomparison of 8.2 ka simulations, Clim. Past., 9, 423–432, https://doi.org/10.5194/cp-9-423-2013, 2013.
Morrill, C., Ward, E. M., Wagner, A. J., Otto-Bliesner, B. L., and Rosenbloom, N.: Large sensitivity to freshwater forcing location in 8.2 ka simulations, Paleoceanography, 29, 930–945, https://doi.org/10.1002/2014PA002669, 2014.
NOAA National Climate Data Center: Paleoclimatology data in National Centers for Environmental Information of National Oceanic and Atmospheric Administration, https://www.ncdc.noaa.gov/data-access/paleoclimatology-data (last access: 10 June 2024), 2024.
Polyak, V. J., Rasmussen, J. B., and Asmerom, Y.: Prolonged wet period in the southwestern United States through the Younger Dryas, Geology, 32, 5–8, https://doi.org/10.1130/G19957.1, 2004.
Renold, M., Raible, C. C., Yoshimori, M., and Stocker, T. F.: Simulated resumption of the North Atlantic meridional overturning circulation-slow basin-wide advection and abrupt local convection, Quaternary Sci. Rev., 29, 101–112, https://doi.org/10.1016/j.quascirev.2009.11.005, 2010.
Rohling, E. J. and Pälike, H.: Centennial-scale climate cooling with a sudden cold event around 8,200 years ago, Nature, 434, 975–979, https://doi.org/10.1038/nature03421, 2005.
Roy, M., Dell'Oste, F., Veillette, J. J., De Vernal, A., Hélie, J. F., and Parent, M.: Insights on the events surrounding the final drainage of Lake Ojibway based on James Bay stratigraphic sequences, Quaternary Sci. Rev., 30, 682–692, https://doi.org/10.1016/j.quascirev.2010.12.008, 2011.
Scholz, D. and Hoffmann, D. L.: StalAge-An algorithm designed for construction of speleothem age models, Quatern. Geochronol., 6, 369–382, https://doi.org/10.1016/j.quageo.2011.02.002, 2011.
Sodemann, H., Schwierz, C., and Wernli, H.: Interannual variability of Greenland winter precipitation sources: Lagrangian moisture diagnostic and North Atlantic Oscillation influence, J. Geophys. Res.-Atmos., 113, D3107, https://doi.org/10.1029/2007JD008503, 2008.
Spurk, M., Leuschner, H. H., Baillie, M. G., Briffa, K. R., and Friedrich, M.: Depositional frequency of German subfossil oaks: climatically and non-climatically induced fluctuations in the Holocene, Holocene, 12, 707–715, 2002.
Stein, A. F., Draxler, R. R., Rolph, G. D., Stunder, B. J., Cohen, M. D., and Ngan, F.: NOAA's HYSPLIT atmospheric transport and dispersion modeling system, B. Am. Meteorol. Soc., 96, 2059–2077, https://doi.org/10.1175/BAMS-D-14-00110.1, 2015.
Steinhilber, F., Beer, J., and Fröhlich, C.: Total solar irradiance during the Holocene, Geophys. Res. Lett., L19704, https://doi.org/10.1029/2009GL040142, 2009.
Stríkis, N. M., Cruz, F. W., Cheng, H., Karmann, I., Edwards, R. L., and Vuille, M.: Abrupt variations in South American monsoon rainfall during the Holocene based on a speleothem record from central-eastern Brazil, Geology, 39, 1075–1078, https://doi.org/10.1130/G32098.1, 2011.
Tan, L., Li, Y., Wang, X., Cai, Y., Lin, F., Cheng, H., Ma, L., Sinha, A., and Edwards, R. L.: Holocene monsoon change and abrupt events on the western Chinese Loess Plateau as revealed by accurately dated stalagmites, Geophys. Res. Lett., 47, e2020GL090273, https://doi.org/10.1029/2020GL090273, 2020.
Teller, J. T., Leverington, D. W., and Mann, J. D.: Freshwater outbursts to the oceans from glacial Lake Agassiz and their role in climate change during the last deglaciation, Quaternary Sci. Rev., 21, 879–887, https://doi.org/10.1016/S0277-3791(01)00145-7, 2002.
Thomas, E. R., Wolff, E. W., Mulvaney, R., Steffensen, J. P., Johnsen, S. J., and Arrowsmith, C.: The 8.2 ka event from Greenland ice cores, Quaternary Sci. Rev., 26, 70–81, https://doi.org/10.1016/j.quascirev.2006.07.017, 2007.
Törnqvist, T. E. and Hijma, M. P.: Links between early Holocene ice-sheet decay, sea-level rise and abrupt climate change, Nat. Geosci., 5, 601–606, https://doi.org/10.1038/ngeo1536, 2012.
Voarintsoa, N. R. G., Matero, I. S., Railsback, L. B., Gregoire, L. J., Tindall, J., Sime, L., and Razanatseheno, M. O. M.: Investigating the 8.2 ka event in northwestern Madagascar: Insight from data-model comparisons, Quaternary Sci. Rev., 204, 172–186, https://doi.org/10.1016/j.quascirev.2018.11.030, 2019.
Von Grafenstein, U., Erlernkeuser, H., and Trimborn, P.: Oxygen and carbon isotopes in modern fresh-water ostracod valves: assessing vital offsets and autecological effects of interest for palaeoclimate studies, Palaeogeogr. Palaeoclim. Palaeoecol., 148, 133–152, https://doi.org/10.1016/S0031-0182(98)00180-1, 1999.
Wang, X., Auler, A. S., Edwards, R. L., Cheng, H., Cristalli, P. S., Smart, P. L., and Shen, C. C.: Wet periods in northeastern Brazil over the past 210 kyr linked to distant climate anomalies, Nature, 432, 740–743, https://doi.org/10.1038/nature03067, 2004.
Wanner, H., Solomina, O., Grosjean, M., Ritz, S. P., and Jetel, M.: Structure and origin of Holocene cold events, Quaternary Sci. Rev., 30, 3109–3123, https://doi.org/10.1016/j.quascirev.2011.07.010, 2011.
Wong, C. I., Banner, J. L., and Musgrove, M.: Holocene climate variability in Texas, USA: An integration of existing paleoclimate data and modeling with a new, high-resolution speleothem record, Quaternary Sci. Rev., 127, 155–173, https://doi.org/10.1016/j.quascirev.2015.06.023, 2015.
Wood, C. T., Johnson, K. R., Lewis, L. E., Wright, K., Wang, J. K., and Borsato, A.: High-resolution, multiproxy speleothem record of the 8.2 ka event from Mainland Southeast Asia, Paleoceanogr. Paleocl., 38, e2023PA004675, https://doi.org/10.1029/2023PA004675, 2023.
Yoshimura, K., Kanamitsu, M., Noone, D., and Oki, T.: Historical isotope simulation using reanalysis atmospheric data, J. Geophys. Res.-Atmos., 113, D19108, https://doi.org/10.1029/2008JD010074, 2008.
Zhang, H., Griffiths, M. L., Chiang, J. C., Kong, W., Wu, S., Atwood, A., and Xie, S.: East Asian hydroclimate modulated by the position of the westerlies during Termination I, Science, 362, 580–583, https://doi.org/10.1126/science.aat9393, 2018.
Zhang, H., Ait Brahim, Y., Li, H., Zhao, J,, Kathayat, G., Tian, Y., Baker, J., Wang, J., Zhang, F., Ning, Y., and Cheng, H.: The Asian Summer Monsoon: Teleconnections and forcing mechanisms–a review from Chinese speleothem δ18O records, Quaternary, 2, 26, https://doi.org/10.3390/quat2030026, 2019.
Zhao, J., Cheng, H., Cao, J., Sinha, A., Dong, X., Pan, L., Pérez-Mejías, C., Zhang, H., Li, H., Wang, J., Wang, K., Cui, J., and Yang, Y.: Orchestrated decline of Asian summer monsoon and Atlantic meridional overturning circulation in global warming period, Innovat. Geosci., 1, 100011, https://doi.org/10.59717/j.xinn- geo.2023.100011, 2023.