the Creative Commons Attribution 4.0 License.
the Creative Commons Attribution 4.0 License.
 | 23 May 2024
Aerosol uncertainties in tropical precipitation changes for the mid-Pliocene warm period
Anni Zhao
Ran Feng
Chris M. Brierley
Jian Zhang
The mid-Pliocene Warm Period (mPWP, 3.3–3.0 Ma) was characterised by an atmospheric CO2 concentration exceeding 400 ppmv with minor changes in continental and orbital configurations. Simulations of this past climate state have improved with newer models but still show some substantial differences from proxy reconstructions. There is little information about atmospheric aerosol concentrations during the Pliocene, but previous work suggests that it could have been quite different from the modern period. Here we apply idealised aerosol scenario experiments to examine the importance of aerosol forcing on mPWP tropical precipitation and the possibility of aerosol uncertainty explaining the mismatch between reconstructions and simulations. The absence of industrial pollutants leads to further warming, especially in the Northern Hemisphere. The Intertropical Convergence Zone (ITCZ) becomes narrower and stronger and shifts northward after removal of anthropogenic aerosols. Though not affecting the location of monsoon domain boundary, removal of anthropogenic aerosol alters the amount of rainfall within the domain, increasing summer rain rate over eastern and southern Asia and western Africa. This work demonstrates that uncertainty in aerosol forcing could be the dominant driver in tropical precipitation changes during the mid-Pliocene: causing larger impacts than the changes in topography and greenhouse gases.
- Article
(2270 KB) - Full-text XML
- BibTeX
- EndNote


The mid-Pliocene or mid-Piacenzian Warm Period (mPWP, around 3.3–3.0 Ma, Dowsett et al., 1999; Haywood et al., 2016a) was the most recent time in Earth's history when atmospheric CO2 concentration exceeded 400 ppmv (Bartoli et al., 2011; de la Vega et al., 2020) with nearly the same topography and orbital configuration as modern conditions. This period is recognised as the last period with quasi-equilibrium warm climate before the Pleistocene when the climate had nearly fully responded to the high atmospheric CO2 concentration (e.g. Haywood et al., 2010). Understanding the environmental processes in the mPWP provides a chance to understand how the climate system would respond to a perturbation of radiative forcing and to evaluate the impacts of climate change caused by great CO2 emissions (e.g. Haywood et al., 2016b; Pagani et al., 2010). The first study reconstructing regional Pliocene climate was conducted by Zubakov and Borzenkova (1988) based on more than 20 sequences from terrestrial and marine cores. They pointed out that the Pliocene Optimum could be a future analogue, with high CO2 concentration and climate showing 100–300 kyr cycles with a 4–5 °C amplitude. Proxy data suggested a warming in global mean surface temperature (GMST) of 2.5–4.0 °C during the mPWP over 1850–1900 CE based on the estimation of global sea surface temperature (GSST) anomaly and its relationship in changing rate with the GMST (Gulev et al., 2021). The Pliocene climate was characterised by reduced temperature gradients (Haywood et al., 2013, 2020; Dowsett et al., 2013; Foley and Dowsett, 2019) from the Equator to the poles (e.g. Dowsett and Poore, 1991) and from western to eastern tropical Pacific Ocean, which has been recognised as a tropical Pacific warm pool pattern (Wara, 2005; Dowsett, 2007; Zhang et al., 2014; O'Brien et al., 2014).
Climate models have been used to simulate mPWP climate and to investigate the drivers and mechanisms behind the mPWP climate changes shown in proxy data (e.g. Fedorov et al., 2013). The Pliocene Model Intercomparison Project (PlioMIP; Haywood et al., 2010, 2016b) is a coordinated international climate modelling project initiative aimed at understanding the climate and environments of mPWP, exploring model uncertainties, and evaluating the potential relevance to future climate change. It estimates a warming of 3.2 °C (2.1 to 4.8 °C) compared to the pre-industrial control runs in the PlioMIP2 (Haywood et al., 2020) and 2.7 °C (1.8 to 3.6 °C) in the PlioMIP1 (Haywood et al., 2013). PlioMIP simulations suggest enhanced monsoons in West Africa, India and East Asia (Zhang et al., 2013; Berntell et al., 2021; Han et al., 2021; Feng et al., 2022) and precipitation in the South Pacific Convergence Zone (SPCZ) and the Intertropical Convergence Zone (ITCZ) during the mPWP (Haywood et al., 2020; Han et al., 2021). However, ongoing climate change since the 20th century has not shown those mPWP precipitation changes during which monsoon precipitation is affected by the counteraction between increases induced by greenhouse gases (GHGs) and decreases induced by aerosol emission (Douville et al., 2021). Many climate features of the mPWP, especially the hydroclimate features, differ substantially from the projected features of near-future climate (Feng et al., 2022; Bhattacharya et al., 2022; Burton et al., 2023). Although the mPWP climate was thought to reflect Earth system responses that operate at a longer timescale (Lunt et al., 2010; Feng et al., 2022), Pliocene climate was also likely driven by different atmospheric aerosol forcing conditions (Unger and Yue, 2014; Sagoo and Storelvmo, 2017). Whether those different forcing conditions play an role in driving the Pliocene hydroclimate remains unknown.
Aerosols are an important driver in the climate system. Knowing their atmospheric concentrations and mechanisms behind climate response are key tasks for simulating past and future. Aerosols directly affect absorbed incoming solar radiation and indirectly affect the radiative flux through their role in determining cloud properties. Aerosol–cloud interactions include the changes in cloud albedo through altering droplet size and concentration (Twomey, 1977) and changes in cloud lifetime through altering the precipitation efficiency (Albrecht, 1989). Future changes in the global aerosol burden are dependent on anthropogenic emissions, yet natural sources of aerosol emissions are also expected to change (Tegen and Schepanski, 2018).
The discrepancy between mPWP simulations and reconstructions (Haywood et al., 2013, 2020) implies that models might miss some important mechanisms (Fedorov et al., 2013) or that prescribed forcing could be a source of uncertainty (Feng et al., 2019). The mPWP simulations now use modern-day or pre-industrial aerosol concentrations that are the same as in the control runs that may differ from the conditions during mPWP. Failure to include the effect of aerosol forcings and the usage of unrealistic prescribed aerosol concentrations in mPWP simulations implies that aerosol effects may be one of the possible explanations for the mismatch between reconstructions and simulations. However, little research has been done to try to understand aerosol effects in the Pliocene (e.g. Unger and Yue, 2014). More attention in palaeoclimate studies relevant to aerosols has been paid to the Last Glacial Maximum (LGM) period when the global dust cycle was enhanced (Lambert and Albani, 2021). An idealised study suggests the importance of aerosol and chemistry–climate feedbacks in modelling Pliocene climate, as the aerosol cooling compensates 15 %–100 % of the warming induced by high CO2 while chemistry–climate feedback warms the climate with the magnitude of 30 %–250 % of the CO2-induced warming (Unger and Yue, 2014). Sagoo and Storelvmo (2017) found that indirect dust effects could explain some of the mismatch between model and data for the LGM and mPWP. They used a new empirical parameterisation for ice nucleation on dust particles to investigate radiative forcing induced by different dust loading from low to high values. Their mPWP simulation modified by extreme low dust suggests surface temperature warming and polar amplification due to reduced radiative forcing by increased size and decreased amount of ice crystals in clouds (Sagoo and Storelvmo, 2017).
In this study, we analyse two Pliocene simulations that were performed initially to analyse the effects of aerosol–cloud interactions on the seasonally sea-ice-free mPWP Arctic (Feng et al., 2019) to further investigate the potential effect of aerosol on mPWP climate. Different aerosol scenarios were applied, one with pre-industrial aerosol concentrations and one with present-day aerosol concentrations published in Lamarque et al. (2010). We compare the changes caused by removing anthropogenic concentrations in the Pliocene, in order to raise the importance of considering aerosol effects in modelling Pliocene climate. This investigation also highlights the potentially analogue nature of the Pliocene climate, not to the present-day polluted climate but to future climate scenarios that feature removal of anthropogenic pollutants (Lee et al., 2021). We focus on changes in tropical precipitation because precipitation varies much more than other near-uniform variables like temperature and irradiation in the tropics.
2.1 Model description
Simulations were performed with the Community Earth System Model version 1.2 (CESM1.2; Hurrell et al., 2013), consisting of the Community Atmospheric Model version 5.3 (CAM5.3; Martinez, 2012), Parallel Ocean Program version 2 (POP2; Danabasoglu et al., 2012), Community Land Model version 4 (CLM4; Oleson, 2010) and Community Ice Code version 4 (CICE4; Holland et al., 2012). CESM1 was developed from the Community Climate System Model version 4 (CCSM4, Gent et al., 2011) by adding capabilities related to biogeochemistry processes and aerosol effects (Meehl et al., 2013). Differences and similarities between CESM1 and CCSM4 are summarised in Meehl et al. (2013). The key updates between CCSM4 and CESM1 come from a new aerosol scheme, inclusion of aerosol–cloud interactions, and a more realistic boundary layer and radiation in CAM5 (Meehl et al., 2013; Martinez, 2012). The three-mode version of the modal aerosol module (MAM3; Liu et al., 2012) is used as the aerosol micro-physical scheme for long-term climate simulations, which uses Aitken (0.02–0.08 µm), accumulation (0.08–1 µm) and coarse (1.0–10 µm) modes to solve size and number concentration of internal condensation and coagulation of different species among modes. Assumptions and limitations of MAM3 are described in Liu et al. (2012). Though CAM5 simulates a response that is too strong in cloud-radiative-to-aerosol changes (Martinez, 2012), its ability to simulate cloud and cloud-radiative forcing has been improved since the previous generations (Kay et al., 2012).
2.2 Experimental design
The existing simulations (Feng et al., 2019) were branched from an existing CCSM4-PlioMIP1 simulation that only considers the aerosol direct effect (Rosenbloom et al., 2013). The resolution was set up to 0.9°×1.25° for the atmospheric and land components and ∼1° for the oceanic and sea ice components. Two pollutant scenarios were applied. One simulation applied pre-industrial emissions (hereafter referred as to Plio_Pristine, which can be treated as equivalent to a PlioMIP1 simulation). The other prescribed pre-industrial emissions plus industrial pollutants of anthropogenic SO2, sulfate and organic compounds estimated for the 2000s from a gridded (0.5°×0.5°) emission dataset (hereafter referred as to Plio_Polluted) published in Lamarque et al. (2010). The emission dataset provided consistent gridded anthropogenic (defined as originating from industrial, domestic and agriculture activity sectors) and biomass burning of reactive gases and aerosols covering the historical period from 1850 to 2000 CMIP5 models to use in running chemistry model simulations that would contribute to the assessment in IPCC AR5 (Lamarque et al., 2010). Compared to Plio_Polluted, Plio_Pristine simulates a positive adjusted effective radiative forcing of 1.29 W m−2, in which radiative forcing due to aerosol–cloud interactions contributes to 1.11 W m−2 and direct radiative forcing contributes to 0.18 W m−2 (Feng et al., 2019). The emission dataset (Lamarque et al., 2010) includes reactive gases and aerosols covering the historical period from 1850 to 2000, with the aim of providing consistent gridded emissions for CMIP5 models to run chemistry model simulations that would contribute to the assessment in IPCC AR5. Boundary conditions were set up based on the PlioMIP1 (Haywood et al., 2011). Each simulation was branched from model year 500 of the CCSM4-PlioMIP1 simulation and run for another 300 model years. Outputs are taken as the averaged means of the last 50 model years.
2.3 Analysis techniques
2.3.1 Monsoon analysis
It is not appropriate to use a fixed present-day monsoon domain boundary to analyse paleo-monsoon properties because the monsoon domain varies through time. Here we adopt the definition of monsoon domain in Wang and Ding (2008) and Wang et al. (2014). Local summer is defined as May–September (MJJAS) in the Northern Hemisphere and November–March (NDJFM) in the Southern Hemisphere, and local winter is defined as NDJFM in the Northern Hemisphere and MJJAS in the Southern Hemisphere. Averaged summer rain rate takes the averaged daily rain rate during local summer. Monsoon intensity is the difference in the averaged daily precipitation rate between local summer and local winter. Global monsoon domain is defined as areas where at least 55 % of the annual total rainfall comes from summer, and the monsoon intensity defined as being no lower than 2 mm d−1.
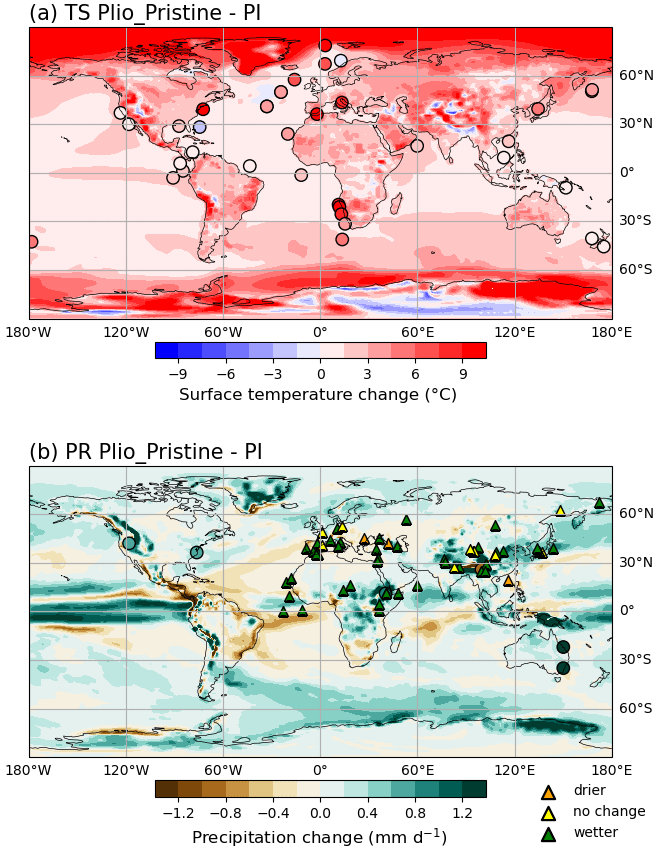
Figure 1Changes in (a) mean annual surface temperature (TS) in °C and (b) precipitation (PR) in mm d−1 (Plio_Pristine–PI). Shaded circles are reconstructed anomalies of (a) SSTs (Foley and Dowsett, 2019) and (b) precipitation (Salzmann et al., 2008). Triangles mark the sign of mPWP hydroclimate changes (mean annual precipitation minus evaporation) published in Feng et al. (2022). See Sect. 2.3.2 for details.
2.3.2 Data model comparison
Simulated mPWP annual mean temperature anomalies between Plio_Pristine and the pre-industrial period (hereafter referred as to PI) are compared to the reconstructed mPWP sea surface temperature (SST) anomalies, which were presented as the reconstructed mPWP SST dataset in PRISM4 (Foley and Dowsett, 2019) with an interval of 30 000 years minus the observed 1870–1988 SSTs from the NOAA Extended Reconstructed Sea Surface Temperature (ERSST) version 5 dataset (Huang et al., 2017). Salzmann et al. (2008) compared 28 present-day mean annual precipitation anomalies (mid-Pliocene − present day) from the literature for selected regions. Only 10 data points were chosen for data–model comparison in this study as their precise coordinates and anomalies could be found in literature. The 10 points have been regenerated into 6 after the combination of points if their sites were located within a single model grid. Three sites on the western coast of the USA and three in Yunnan, China, have been regenerated into a new site by using their averages. Feng et al. (2022) published a compilation of mPWP proxy records reflecting the mPWP terrestrial hydroclimate change shown in the difference between precipitation and evaporation, which consists of 62 data points after the exclusion by quality control. Here we follow the treatment of Feng et al. (2022) to combine the co-located sites if they were less than 150 km apart and featured same-signed anomalies. The combination regenerates the site sets 35, 72; 22, 77; 79, 61; 58, 61, 79, 101; and 65, 66 of Feng et al. (2022) into new sites located at the centre of sets.
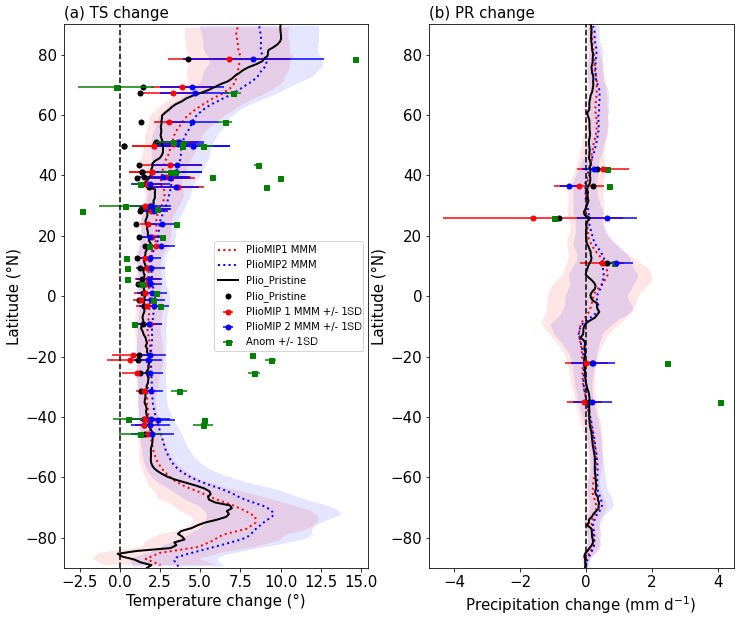
Figure 2Zonal averaged changes in mean annual (a) surface temperature in °C and (b) precipitation in mm d−1. In all panels, solid black lines show the simulated anomalies (Plio_Pristine–PI). Dotted lines represent the multi-model means of the PlioMIP1 (red, Haywood et al., 2013) and PlioMIP2 (blue, Haywood et al., 2020), respectively, with shaded areas showing the model spread, i.e. the standard deviation of the ensemble. Green squares show the site-level reconstructions in Fig. 1, and dots show the corresponding grid level anomalies, with error bars showing the range of the PlioMIPs.
3.1 Simulated mPWP climate change relative to the pre-industrial period
Figure 1a shows that the tropical annual mean surface temperature of Plio_Pristine is overall warmer than the PI. Plio_Pristine produces warmer high-latitude Pacific and Southern oceans than the tropics as compared to PI. The eastern Pacific Ocean along the tropics and the upwelling region along the coastline of North America is about 0.5 °C warmer than the western Pacific. Plio_Pristine captures both reduced meridional and zonal temperature gradients during the mPWP that have been shown in the PlioMIPs (Haywood et al., 2013, 2020), but the amplifying magnitude in Plio_Pristine is weaker than the PlioMIPs (Fig. 2a). The underestimation in Northern Hemisphere warming may be explained by the fact that Plio_Pristine was branched from an earlier CCSM4-PlioMIP1 simulation that had underestimated the warming in the Northern Hemisphere (Rosenbloom et al., 2013). Though Plio_Pristine underestimates positive temperature anomalies, its simulated change is still within the range suggested by the PlioMIPs. A total of 13 out of the 37 sites show a mismatch between simulated surface temperature anomaly and reconstructed SST anomaly (Foley and Dowsett, 2019) smaller than 1.0 °C. A large mismatch occurs in the high-latitude areas of the North Atlantic Ocean and the upwelling region near the western coastline of southern Africa. Reconstructed SST anomalies show an averaged warming of 4.4 °C north to 40° N in the North Atlantic Ocean and 7.0 °C over the upwelling region, which are 3.5 and 5.6 °C higher than the simulated warming, respectively. The reconstructed meridional temperature gradient along the tropical Pacific Ocean (between sites near Colombia and sites near Southeast Asia) is around 0.5 °C greater than simulations (Plio_Pristine–PI). Data–model mismatch suggests that Plio_Pristine underestimates the magnitude of reduction in both SST gradients during the mPWP as compared to reconstructed SST anomalies (Foley and Dowsett, 2019).
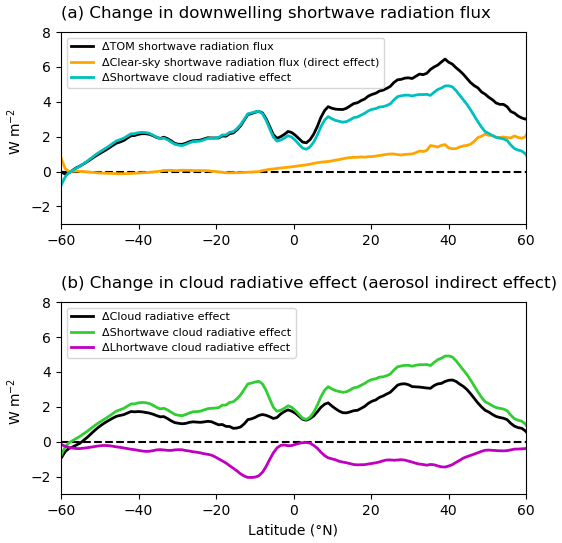
Figure 3Zonal averaged change in (a) short-wave radiation flux and (b) cloud-radiative effect in W m−2 at top of model (TOM) after removal of anthropogenic emissions (Plio_Pristine–Plio_Polluted). TOM radiation fluxes are used to show change at the top of the atmosphere (TOA) because the results are not sensitive to TOM or TOA. (a) Clear-sky short-wave radiation (orange) refers to TOM radiation flux in the absence of clouds, and full-sky short-wave radiation flux (black) is with clouds. Short-wave cloud-radiative effect (cyan) is the difference in short-wave radiation flux between full-sky and clear-sky conditions. (b) Cloud-radiative effect (black) is the sum of downwelling short-wave (green) and long-wave (purple) radiation cloud radiative effect.
Previous studies of mPWP monsoon change based on data were mainly focused on Asian monsoons due to the low availability of geological evidence, which suggested a wetter East Asian monsoon during the mPWP (e.g. Xiong et al., 2010; Nie et al., 2014). The PlioMIPs show enhanced monsoon over western and northern Africa, India, and East Asia that are consistent with proxy data (Li et al., 2018; Feng et al., 2022). Figure 1b shows that compared to the PI, Plio_Pristine produces greater annual mean precipitation (as the sum of stable large-scale and convective precipitation rate) over tropical oceans and land monsoon regions (western and northern Africa, East Asia, Australia, and parts of Southeast Asia). Precipitation decreases over subtropical oceans, the eastern parts of South America and monsoon areas over North America. Plio_Pristine produces the right sign of precipitation, as proxy data suggest, but in general it underestimates the enhancing magnitudes, especially over Australian sites where proxy data suggest a large positive precipitation anomaly (Figs. 1b and 2b). Though Plio_Pristine produces less precipitation over the tropical Northern Hemisphere compared to the multi-model means from PlioMIP1 (Haywood et al., 2013) and PlioMIP2 (Haywood et al., 2020), it agrees overall with the findings from the PlioMIPs.
3.2 Effects of removing anthropogenic aerosols on temperature
According to IPCC AR6, human-induced aerosols contributed to a cooling of 0.0 to 0.8 °C between 2010–2019 relative to 1850–1900 (IPCC, 2021). Therefore, removing anthropogenic aerosols is expected to warm the climate. Removal of present-day anthropogenic aerosols from the atmosphere (Plio_Pristine–Plio_Polluted) causes a global warming of 0.84 °C (Feng et al., 2019), which is close to the estimated modern cooling contributed by aerosols at 0–0.8 °C in the IPCC AR6 (IPCC, 2021). Simulated warming is in line with the theory of aerosol effects, as aerosols contribute a negative forcing on climate, which in turn means that removing aerosols from the atmosphere should lead to a positive forcing.
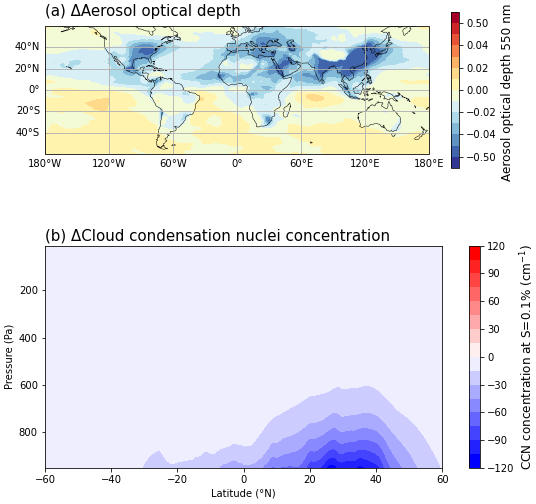
Figure 4Change in (a) aerosol optical depth at 550 nm and (b) cloud condensation nuclei concentration at supersaturation 0.1 % (cm−3) after removal of anthropogenic emissions (Plio_Pristine–Plio_Polluted).
The spatial pattern of temperature change is consistent with the change in energy flux. Overall, asymmetrical change in radiation flux matches with the larger aerosol concentration change in the Northern Hemisphere (Figs. 3a and 4a). A major change in energy flux after the removal of anthropogenic emissions occurs in the Northern Hemisphere that leads to further warming, especially over land. The warming pattern due to asymmetrical emissions concentrated in the Northern Hemisphere agrees with the findings from an earlier study (Samset et al., 2018), in which several models have been applied to test removing all anthropogenic emissions under present-day conditions. Annual mean temperature rises about 0.4–1.0 °C in the tropical Pacific Ocean, and this causes more warming by increasing temperatures by 1.0–1.4 °C in the subtropical Pacific and the upwelling region in the eastern Pacific after removing pollutants (Fig. 5a), which therefore reduces both meridional and zonal temperature gradients in the Pacific Ocean. In future climate projections, removing emitted pollutants is shown to enhance global mean warming, especially in the Northern Hemisphere where the emissions mostly come from. However, the mPWP boundary conditions cause more warming than removing anthropogenic aerosols nearly everywhere, with the exception of the northeastern Pacific Ocean and high-latitude North Atlantic Ocean (Fig. 5a, c and e). More warming being caused by the mPWP boundaries than removal of aerosols suggests that changes in boundary conditions are more important than aerosol effects in mPWP warming.
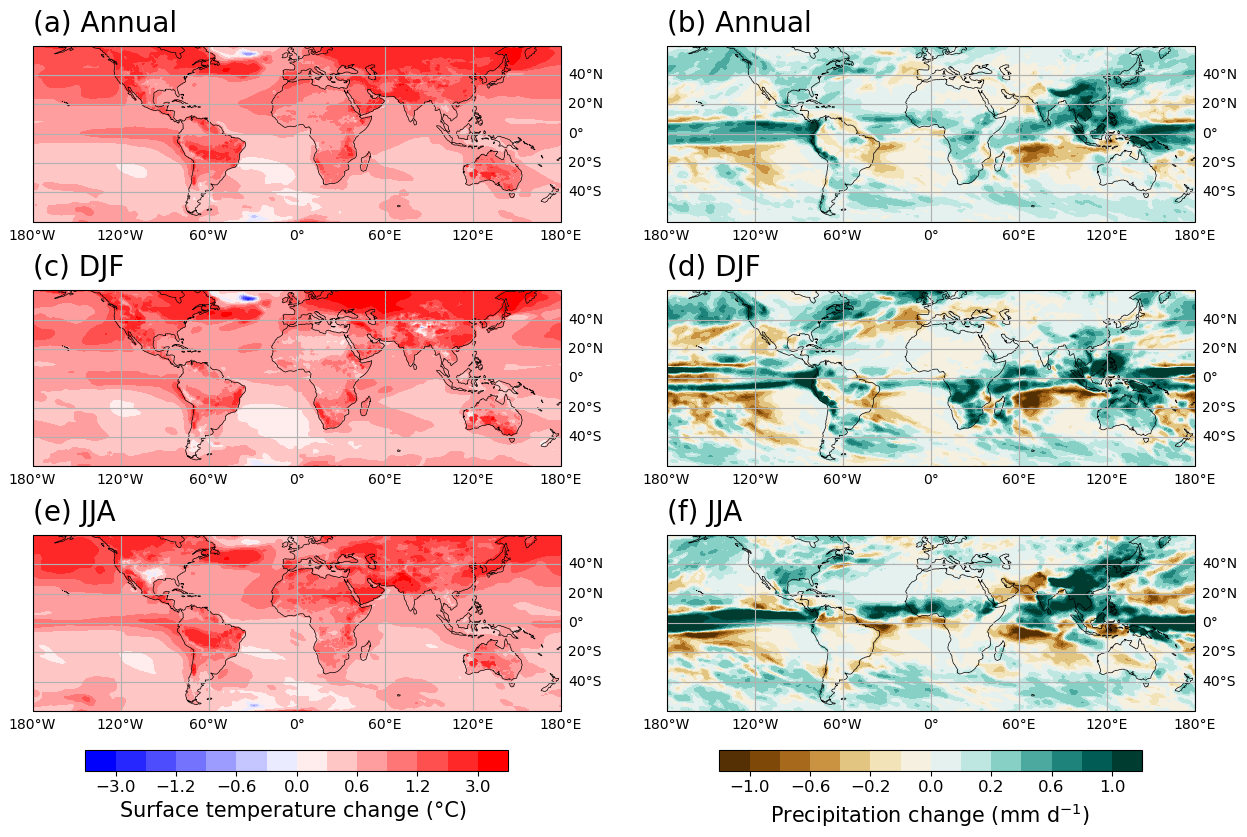
Figure 5Annual, DJF and JJA mean surface temperature change in °C (a, c, e) and precipitation change in mm d−1 (b, d, f) after removal of anthropogenic emissions (Plio_Pristine–Plio_Polluted).
3.3 Effects of removing anthropogenic aerosols on tropical precipitation
Precipitation responds to removal of aerosols in a more complex manner, but in general it responds intensively in deep convective regions (Fig. 5b, d and f). Precipitation enhances in the tropics and reduces in the adjacent subtropics in response to removing emissions. The precipitation change pattern matches more with mid- and high-level clouds (Figs. 6 and A2). Removing anthropogenic aerosols leads to stronger vertical velocity at the Equator (Fig. 7a). The meridional circulation in the tropics is strongly enhanced in the Southern Hemisphere and slightly weakened in the Northern Hemisphere (Fig. 7b) after removing anthropogenic aerosols from the atmosphere, which is related to a northward shift in the ITCZ. The narrower ITCZ is consistent with a warmer climate simulated by Plio_Pristine and agrees with an earlier study that suggests that future ITCZ would become narrower and weaker under global warming in the CMIP5 simulations (Byrne and Schneider, 2016). Ridley et al. (2015) and Voigt et al. (2017) found that introducing anthropogenic aerosols causes a southward shift in the ITCZ. In contrast, removing anthropogenic emissions would be expected to lead to a northward shift in the ITCZ. Our results are consistent with this finding. The pattern of the magnitudes of tropical precipitation anomaly matches the tropical temperature warming over oceans, which agrees with Berg et al. (2013) as higher temperatures cause stronger convective precipitation. Tropical precipitation increases more over the tropical Pacific and Indian oceans where the warming is stronger than the tropical mean warming (Fig. 5), consistent with the positive correlation between tropical precipitation change and spatial deviations of SST warming from the tropical mean (Xie et al., 2010). In the northern tropics, anthropogenic aerosols caused a rainfall reduction through the 20th century (Ridley et al., 2015). Correspondingly, precipitation should increase after removal of emissions. The positive precipitation change over Asia between Plio_Pristine and Plio_Polluted agrees with the argument.
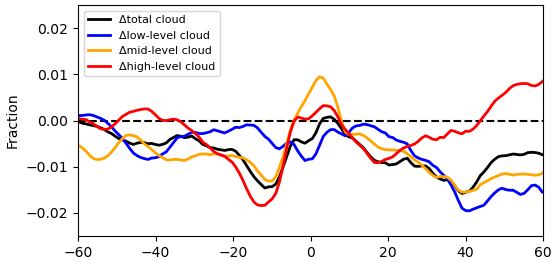
Figure 6Zonal averaged change in high-, mid- and low-level clouds (Plio_Pristine–Plio_Polluted). The corresponding spatial relative changes in cloud fractions are given in Fig. A2.
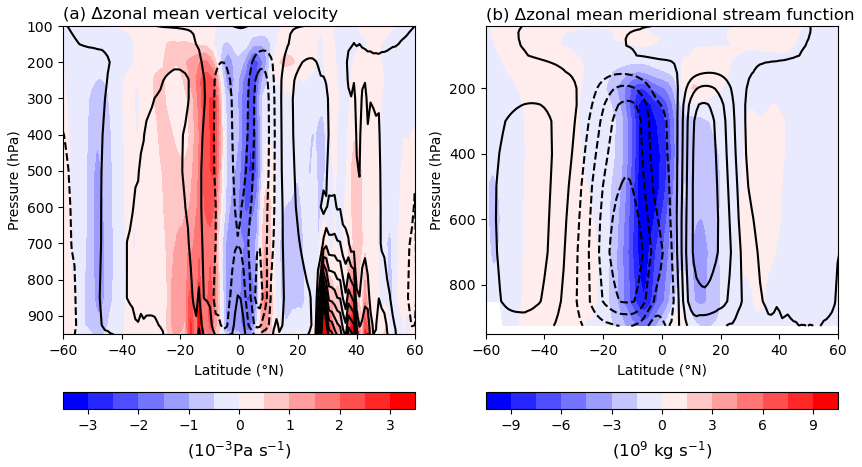
Figure 7Zonal mean changes in (a) vertical velocity (10−3 Pa s−1) and (b) meridional stream function (109 kg s−1) by removing anthropogenic from the mPWP atmosphere (Plio_Pristine–Plio_Polluted). Overlaid contours show the climate mean for the Plio_Pristine simulation (solid for positive values and dashed for negative values).
Strong precipitation response to removal of anthropogenic aerosols implies that the choice of prescribed aerosol scenario could affect simulated mPWP monsoon response. Figure 8 shows the change in global monsoon domain and summer rain rate between Plio_Pristine and PI (Fig. 8a) and between Plio_Pristine and Plio_Polluted (Fig.8b). Little difference among the boundary of global monsoon domain for the PI, Plio_Pristine and Plio_Polluted implies that removal of anthropogenic aerosols has little effect on the location of global monsoon domain. Though not affecting locations, aerosol forcing alters the spatial distribution of land monsoon precipitation. As anthropogenic emission partly caused the global land monsoon precipitation reduction during the 1950s to 1980s and weakened the western African and eastern and southern Asian monsoon over the 20th century via its cooling effect (Douville et al., 2021), reducing aerosol-induced cooling would increase the precipitation over western Africa and eastern and southern Asia during local monsoon seasons. In our case, land regional monsoons are enhanced after removing anthropogenic aerosol, which is consistent with expectations. Comparison between Plio_Pristine and Plio_Polluted shows the expected change in temperature and monsoon (Figs. 5 and 8), which is consistent with projected future monsoon enhancement, as global and Asian summer monsoon precipitation is likely to increase by the 2050s due to the expected reductions in anthropogenic aerosol emissions (Wilcox et al., 2020). Though this study used an idealised aerosol scenario that could not occur during mPWP, it reveals the importance of the prescribed aerosol scenario in simulating mPWP monsoon response.
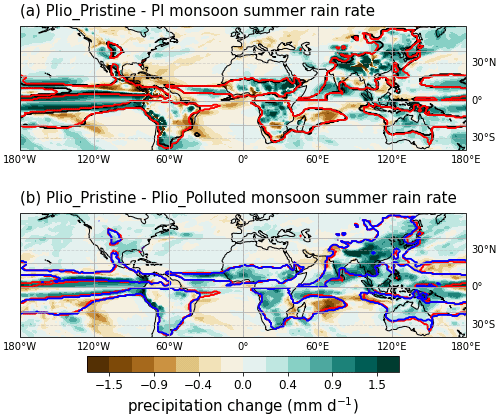
Figure 8Changes in monsoon summer rain rate (mm d−1) during the mPWP (Plio_Pristine–PI, panel a) and by removing anthropogenic emissions from the atmosphere (Plio_Pristine–Plio_Polluted, panel b). Black, red and blue contours represent the boundary of the global monsoon domain following Wang et al. (2014) in PI, Plio_Pristine and Plio_Polluted, respectively.
4.1 Key forcing contributing to aerosol effect
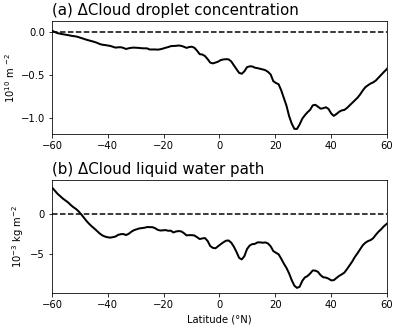
Aerosols affect the climate directly by altering radiation and indirectly by interacting with clouds via changing cloud albedo and cloud lifetime. The largest forcing is due to short-wave cloud-radiative effects (i.e. indirect effect), which primarily drive the energy flux change after removing pollutants (Fig. 3a). Aerosol change causes direct increases in the net incoming short-wave uptake in the Northern Hemisphere through less reflection and plays less of a role in affecting short-wave radiation in the Southern Hemisphere and the tropics (Fig. 3a) due to the asymmetrical change in distribution (Fig. 4a), but its net effect is much smaller than the short-wave indirect effect. The direct radiative forcing due to removing anthropogenic aerosols is much smaller. Feng et al. (2019) have found that the effective radiative forcing due to removing anthropogenic aerosols primarily arises from change in aerosol–cloud interactions. In the tropics, clouds contribute to a net forcing greater than 2 W m−2 with less short-wave reflection at top of clouds and less dowelling long-wave emission (Fig. 3b). Feng et al. (2019) focused on change in cloud droplet properties, as short-wave cloud forcing is dependent on cloud optical depth, whose change is positively correlated with the change in cloud droplet concentration and cloud liquid water content. Figure 9 shows that removal of pollutants decreases droplet concentration (especially over land and at high latitudes, Fig. A3a) and cloud liquid path (except for in the tropical Pacific between 5° S and 5° N and in western Africa, Fig. A3b). The uniform decrease in droplet concentration and overall decrease in cloud liquid path suggests lower cloud albedo and shorter cloud lifetime due to removing anthropogenic aerosols.
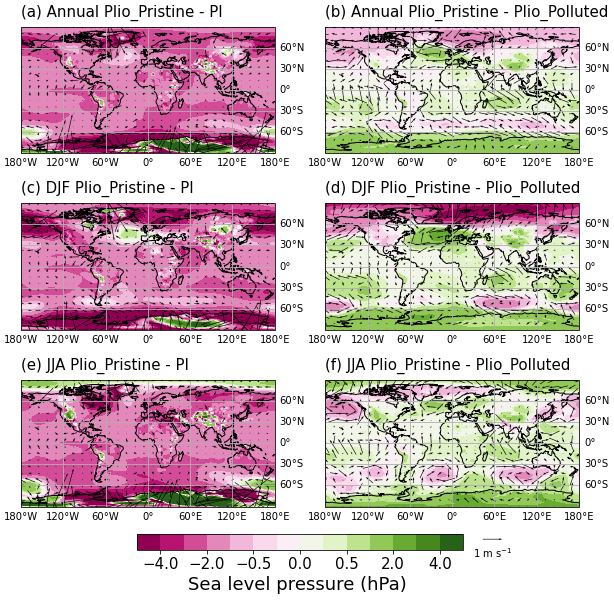
Figure 10Changes in annual and seasonal sea level pressure (hPa) and surface wind (m s−1) during the mPWP (Plio_Pristine–PI, a, c, e) and after removal of anthropogenic aerosols (Plio_Pristine–Plio_Polluted, b, d, f).
4.2 Relative importance comparison between mPWP boundary conditions and aerosol forcing
Over tropical and subtropical regions, the overall uniform warming induced by mPWP boundaries (Plio_Pristine–PI) results in a general decrease in sea level pressure and has a relatively small effect on surface wind (Fig. 10a, c and e). Though removal of anthropogenic aerosols also shows warming in tropical and subtropical regions, it raises the sea level pressure and has a much stronger effect on surface wind that shows seasonal variance (Fig. 10b, d and f). Studies have highlighted that anthropogenic aerosols cause the southward shift in the ITCZ, weaken the Hadley circulation and reduce the precipitation in deep convective areas in response to the Northern Hemisphere cooling induced by aerosols (Hwang et al., 2013; Wang et al., 2019). Removal of human-induced aerosol emissions causes more precipitation change than the mPWP boundary condition over the subtropical Pacific Ocean, southern Atlantic Ocean, Indian Ocean and Southeast Asia. Figure 11 shows the relative importance of removing anthropogenic aerosols and mPWP boundary conditions on mPWP zonal mean precipitation change. Precipitation change in response to aerosol forcing and mPWP boundary conditions (including high CO2) on precipitation shows a complicated pattern as there is no uniform changing trend. The overall aerosol effect is more important over the tropics, which could imply the importance of the aerosol scenario in simulating Pliocene climate. It highlights the importance of aerosol in mPWP data model comparison, as proxy-recorded tropical temperature and hydroclimate conditions can be sensitive to aerosol emission conditions during the Pliocene.
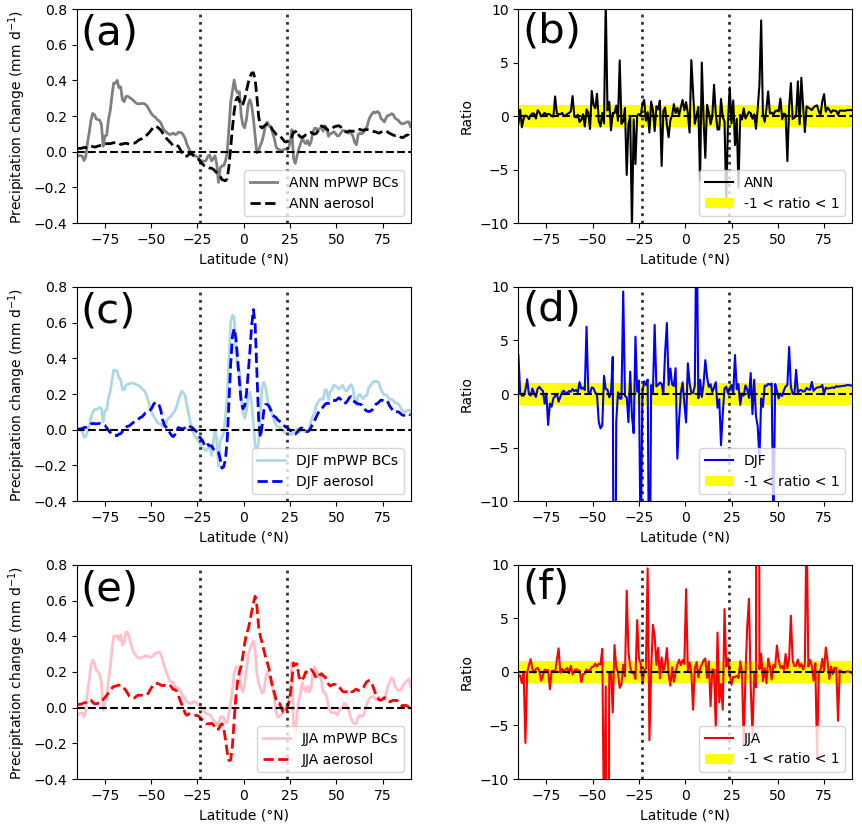
Figure 11Effect of removing anthropogenic aerosols and mPWP boundary conditions on mPWP zonal mean precipitation change and their relative importance. Panels (a), (c) and (e) show zonal averaged (a) annual, (c) DJF and (e) JJA mean precipitation change induced by removing anthropogenic aerosols (dashed) and mPWP boundary conditions (solid). Panels (b), (d) and (f) show the ratio of change in (b) annual, (d) DJF and (f) JJA precipitation change computed as ((Plio_Pristine–Plio_Polluted)(Plio_Pristine–PI)). Yellow shading highlights where −1 < ratio < 1.
4.3 Implications for simulating Pliocene climate
Strong tropical precipitation change in response to removal of anthropogenic aerosols indicates that simulated mPWP precipitation is sensitive to prescribed aerosol scenarios. Previous simulations of the mPWP atmospheric chemistry confirmed that there is a significant increase in the concentrations of aerosol precursors from terrestrial ecosystem emissions (Unger and Yue, 2014) and that simulated mPWP climate is sensitive to indirect effects of dust (Sagoo and Storelvmo, 2017). However, Unger and Yue (2014) only looked at direct radiative effects on mPWP climate induced by feedbacks from physical climate change on reactive composition, and they did not consider aerosol–cloud interactions. To what extent the terrestrial biogenic aerosols may change mPWP hydrological cycle remains unknown. In Unger and Yue (2014), continental greening and a warmer climate during the mPWP leads to greater emissions of aerosols and precursors from more active wildfire and biome productions; however, this increase is likely much smaller than the anthropogenic pollutant emissions. For example, due to the enhanced wildfire activity, SO2 increased by 11 Tg yr−1 in Unger and Yue (2014) mPWP simulations, yet SO2 from anthropogenic sources is estimated to be roughly 120 Tg yr−1 from 1980 to the 2000s (Smith et al., 2011). As such, despite the idea that enhanced biogenic emissions may compensate for some of the responses seen in the Plio_Pristine, we argue that the absence of anthropogenic pollutants from the mPWP troposphere remains one of the important factors driving the differences between the mPWP and near-future climate, especially regarding the Arctic climate (Feng et al., 2019) and hydroclimate. In addition, the mPWP also likely featured a different amount of dust aerosols. The Pliocene simulation of Sagoo and Storelvmo (2017) with an idealised extreme low dust scenario shows greater change in precipitation than only considering CO2 forcing, but it only used an idealised scenario. Usage of a more realistic prescribed aerosol scenario should be considered in future work.
Finally, despite the fact that we analysed change in mPWP hydrological cycle, we did not fully account for changes in the moisture budget that explain our simulated hydroclimate changes in Plio_Pristine. The anomalous moisture budget can be decomposed in to thermodynamic (due to change in specific humidity), dynamic (due to change in mean circulation) and residual (due to transient eddy) components (Trenberth and Guillemot, 1995; Held and Soden, 2006). D'Agostino et al. (2019, 2020) stated that monsoon changes under RCP8.5 are likely driven by thermodynamics and net energy input in response to global warming, which implies that high CO2 concentration would affect precipitation by increasing the thermodynamic component of the moisture budget. As the mPWP simulation also prescribed high atmospheric CO2 concentrations, it implies that thermodynamic change plays an important role in mPWP precipitation change as well. Removal of anthropogenic emissions in this work would logically increase the effects of thermodynamic and net energy input due to its induced further warming and increased net radiative absorption. Further study could focus on decomposing the moisture budget to determine which component plays an important role in generating mPWP precipitation change.
A set of existing simulations with two idealised aerosol scenarios (Feng et al., 2019) are analysed in this study to investigate the importance of aerosol forcing on mPWP tropical climate. Our results highlight the importance of prescribed aerosol scenarios in simulating mPWP precipitation change. In contrast to GHGs, which warm the climate, aerosols cool the climate. As expected, removal of pollutants causes global warming and further warms the Northern Hemisphere due to asymmetrical emissions. Aerosols affect precipitation in a more complicated manner. Precipitation enhances in the tropics especially over deep convective regions, while it reduces in adjacent subtropics, showing a narrower and stronger trend with a northward shift in the ITCZ. Though not affecting the location of the monsoon domain boundary, removal of anthropogenic aerosol changes the precipitation within the domain and increases summer rain rate over eastern and southern Asia and western Africa. Removal of anthropogenic emissions leads to lower cloud albedo and shorter cloud lifetime in simulated mPWP climate. Aerosols have more impacts on annual and seasonal precipitation over the tropics and subtropics than the mPWP boundary conditions.
In reality, the concentration and composition of aerosol during the mPWP were different to those in the pre-industrial period and present day, due to warmer and wetter climate in the mPWP with greater vegetation cover and natural emissions without human effects, respectively. Climate response to aerosol forcing during the mPWP was expected to be different to those periods. Though we investigate idealised aerosol forcing on mPWP climate that cannot quantify the magnitude of uncertainty in Pliocene aerosol, we still argue that aerosol can be a dominant source of uncertainty as it could contribute to change in certain variables, such as tropical rainfall discussed in this study, with effects as large as those from other mPWP boundary conditions. It is important to consider the differences in aerosol conditions across the periods.
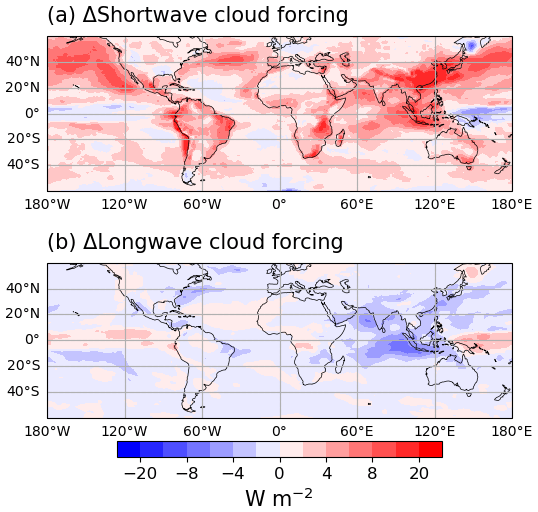
Figure A1Change in (a) short-wave cloud forcing and (b) long-wave cloud forcing in W m−2 (Plio_Pristine–Plio_Polluted).
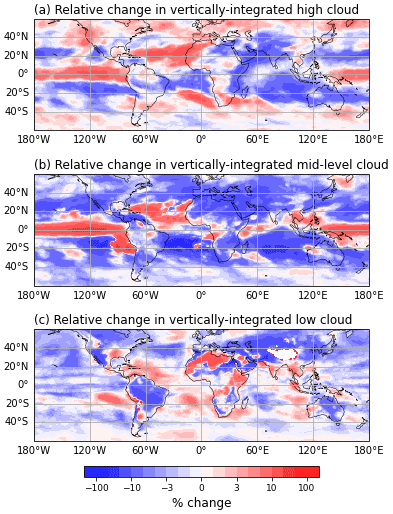
Figure A2Spatial relative change in vertically integrated (a) high-, (b) mid- and (c) low-level cloud ((Plio_Pristine–Plio_Polluted) × 100Plio_Pristine).
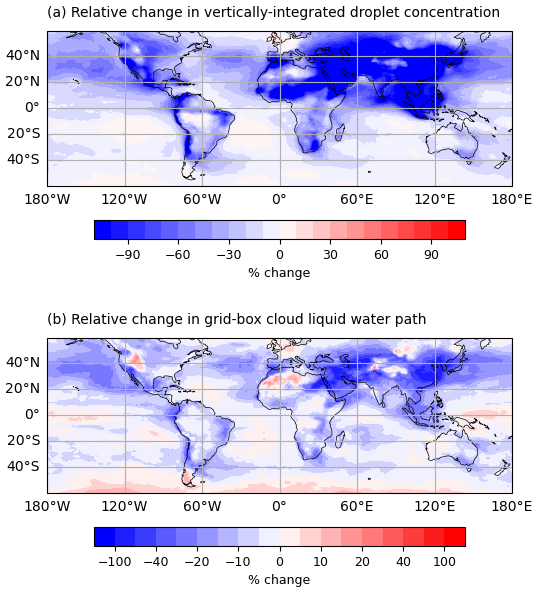
Figure A3Spatial relative change in (a) vertically integrated droplet concentration and (b) grid box cloud liquid water path as compared to Plio_Pristine (i.e. (Plio_Pristine–Plio_Polluted) × 100Plio_Pristine).
The simulation data are hosted at the Cheyenne supercomputer with the following path: /CCSM/csm/CESM-CAM4-PLIOCENE. Instructions and permissions to relevant experiments will be provided upon request to ran.feng@uconn.edu. A Zenodo repository is available at https://doi.org/10.5281/zenodo.10130118 (Zhao, 2024). Source code of CESM1.2 can be downloaded from https://www2.cesm.ucar.edu/models/cesm1.2/ (NCAR, 2024).
AZ and CMB performed the bulk of the writing and analysis. RF contributed data for the manuscript and extensively contributed to revision of the manuscript. YH and JZ revised the manuscript.
At least one of the (co-)authors is a member of the editorial board of Climate of the Past. The peer-review process was guided by an independent editor, and the authors also have no other competing interests to declare.
Publisher's note: Copernicus Publications remains neutral with regard to jurisdictional claims made in the text, published maps, institutional affiliations, or any other geographical representation in this paper. While Copernicus Publications makes every effort to include appropriate place names, the final responsibility lies with the authors.
We acknowledge the high-performance computing support from Cheyenne (https://doi.org/10.5065/D6RX99HX, Computational and Information Systems Laboratory, 2019) and Yellowstone (ark:/85065/d7wd3xhc) provided by NCAR's Computational and Information Systems Laboratory, sponsored by the National Science Foundation. This material is based upon work supported by the National Center for Atmospheric Research, which is a major facility sponsored by the National Science Foundation under Cooperative Agreement 1852977. Yongyun Hu and Jian Zhang acknowledge the National Natural Science Foundation of China. Ran Feng would like to acknowledge the National Science Foundation.
This research has been supported by the National Natural Science Foundation of China (grant nos. 42488201 and 42372120), the National Science Foundation (grant nos. 2103055 and 2238875), and the National Key Scientific and Technological Infrastructure project “Earth System Numerical Simulation Facility” (EarthLab).
This paper was edited by Zhongshi Zhang and reviewed by three anonymous referees.
Albrecht, B. A.: Aerosols, Cloud Microphysics, and Fractional Cloudiness, Science, 245, 1227–1230, https://doi.org/10.1126/science.245.4923.1227, 1989. a
Bartoli, G., Hönisch, B., and Zeebe, R. E.: Atmospheric CO2 decline during the Pliocene intensification of Northern Hemisphere glaciations, Paleoceanography, 26, PA4213, https://doi.org/10.1029/2010PA002055, 2011. a
Berg, P., Moseley, C., and Haerter, J. O.: Strong increase in convective precipitation in response to higher temperatures, Nat. Geosci., 6, 181–185, https://doi.org/10.1038/ngeo1731, 2013. a
Berntell, E., Zhang, Q., Li, Q., Haywood, A. M., Tindall, J. C., Hunter, S. J., Zhang, Z., Li, X., Guo, C., Nisancioglu, K. H., Stepanek, C., Lohmann, G., Sohl, L. E., Chandler, M. A., Tan, N., Contoux, C., Ramstein, G., Baatsen, M. L. J., von der Heydt, A. S., Chandan, D., Peltier, W. R., Abe-Ouchi, A., Chan, W.-L., Kamae, Y., Williams, C. J. R., Lunt, D. J., Feng, R., Otto-Bliesner, B. L., and Brady, E. C.: Mid-Pliocene West African Monsoon rainfall as simulated in the PlioMIP2 ensemble, Clim. Past, 17, 1777–1794, https://doi.org/10.5194/cp-17-1777-2021, 2021. a
Bhattacharya, T., Feng, R., Tierney, J. E., Rubbelke, C., Burls, N., Knapp, S., and Fu, M.: Expansion and Intensification of the North American Monsoon During the Pliocene, AGU Adv., 3, e2022AV000757, https://doi.org/10.1029/2022AV000757, 2022. a
Burton, L. E., Haywood, A. M., Tindall, J. C., Dolan, A. M., Hill, D. J., Abe-Ouchi, A., Chan, W.-L., Chandan, D., Feng, R., Hunter, S. J., Li, X., Peltier, W. R., Tan, N., Stepanek, C., and Zhang, Z.: On the climatic influence of CO2 forcing in the Pliocene, Clim. Past, 19, 747–764, https://doi.org/10.5194/cp-19-747-2023, 2023. a
Byrne, M. P. and Schneider, T.: Narrowing of the ITCZ in a warming climate: Physical mechanisms, Geophys. Res. Lett., 43, 11,350–11,357, https://doi.org/10.1002/2016GL070396, 2016. a
Computational and Information Systems Laboratory: Cheyenne: HPE/SGI ICE XA System, Climate Simulation Laboratory, https://doi.org/10.5065/D6RX99HX, 2019. a
D'Agostino, R., Bader, J., Bordoni, S., Ferreira, D., and Jungclaus, J.: Northern Hemisphere Monsoon Response to Mid-Holocene Orbital Forcing and Greenhouse Gas-Induced Global Warming, Geophys. Res. Lett., 46, 1591–1601, https://doi.org/10.1029/2018GL081589, 2019. a
D'Agostino, R., Brown, J. R., Moise, A., Nguyen, H., Silva Dias, P. L., and Jungclaus, J.: Contrasting Southern Hemisphere monsoon response: midHolocene orbital forcing versus future greenhouse-gas induced global warming, J. Climate, 33, 9595–9613, https://doi.org/10.1175/JCLI-D-19-0672.1, 2020. a
Danabasoglu, G., Bates, S. C., Briegleb, B. P., Jayne, S. R., Jochum, M., Large, W. G., Peacock, S., and Yeager, S. G.: The CCSM4 Ocean Componen, J. Climate, 25, 1361–1389, 2012. a
de la Vega, E., Chalk, T. B., Wilson, P. A., Bysani, R. P., and Foster, G. L.: Atmospheric CO2 during the Mid-Piacenzian Warm Period and the M2 glaciation, Sci. Rep., 10, 11002, https://doi.org/10.1038/s41598-020-67154-8, 2020. a
Douville, H., Raghavan, K., Renwick, J., Allan, R. P., Arias, P. A., Barlow, M., Cerezo-Mota, R., Cherchi, A., Gan, T. Y., Gergis, J., Jiang, D., Khan, A., Pokam Mba, W., Rosenfeld, D., Tierney, J., and Zolina, O.: Water Cycle Changes, in: Climate Change 2021: The Physical Science Basis, Contribution of Working Group I to the Sixth Assessment Report of the Intergovernmental Panel on Climate Change, edited by: Masson-Delmotte, V., Zhai, P., Pirani, A., Connors, S. L., Péan, C., Berger, S., Caud, N., Chen, Y., Goldfarb, L., Gomis, M. I., Huang, M., Leitzell, K., Lonnoy, E., Matthews, J., Maycock, T. K., Waterfield, T., Yelekçi, O., Yu, R., and Zhou, B., Cambridge University Press, 1055–1210, https://doi.org/10.1017/9781009157896.010, 2021. a, b
Dowsett, H.: Faunal re-evaluation of Mid-Pliocene conditions in the western equatorial Pacific, Micropaleontology, 53, 447–456, https://doi.org/10.2113/gsmicropal.53.6.447, 2007. a
Dowsett, H. and Poore, R.: Pliocene sea surface temperatures of the north atlantic ocean at 3.0 Ma, Quaternary Sci. Rev., 10, 189–204, https://doi.org/10.1016/0277-3791(91)90018-P, 1991. a
Dowsett, H. J., Barron, J. A., Poore, R. Z., Thompson, R. S., Cronin, T. M., Ishman, S. E., and Willard, D. A.: Middle Pliocene Paleoenvironmental Reconstruction: PRISM 2, US Geological Survey Open File Report 99-535, eological Survey, http://pubs.usgs.gov/of/1999/of99-535/ (last access: 20 May 2024), 1999. a
Dowsett, H. J., Foley, K. M., Stoll, D. K., Chandler, M. A., Sohl, L. E., Bentsen, M., Otto-Bliesner, B. L., Bragg, F. J., Chan, W.-L., Contoux, C., Dolan, A. M., Haywood, A. M., Jonas, J. A., Jost, A., Kamae, Y., Lohmann, G., Lunt, D. J., Nisancioglu, K. H., Abe-Ouchi, A., Ramstein, G., Riesselman, C. R., Robinson, M. M., Rosenbloom, N. A., Salzmann, U., Stepanek, C., Strother, S. L., Ueda, H., Yan, Q., and Zhang, Z.: Sea Surface Temperature of the mid-Piacenzian Ocean: A Data-Model Comparison, Sci. Rep., 3, 2013, https://doi.org/10.1038/srep02013, 2013. a
Fedorov, A. V., Brierley, C. M., Lawrence, K. T., Liu, Z., Dekens, P. S., and Ravelo, A. C.: Patterns and mechanisms of early Pliocene warmth, Nature, 496, 43–49, https://doi.org/10.1038/nature12003, 2013. a, b
Feng, R., Otto-Bliesner, B. L., Xu, Y., Brady, E., Fletcher, T., and Ballantyne, A.: Contributions of aerosol-cloud interactions to mid-Piacenzian seasonally sea ice-free Arctic Ocean, Geophys. Res. Lett., 46, 9920–9929, https://doi.org/10.1029/2019GL083960, 2019. a, b, c, d, e, f, g, h, i
Feng, R., Bhattacharya, T., Otto-Bliesner, B. L., Brady, E. C., Haywood, A. M., Tindall, J. C., Hunter, S. J., Abe-Ouchi, A., Chan, W.-L., Kageyama, M., Contoux, C., Guo, C., Li, X., Lohmann, G., Stepanek, C., Tan, N., Zhang, Q., Zhang, Z., Han, Z., Williams, C. J. R., Lunt, D. J., Dowsett, H. J., Chandan, D., and Peltier, W. R.: Past terrestrial hydroclimate sensitivity controlled by Earth system feedbacks, Nat. Commun., 13, 1306, https://doi.org/10.1038/s41467-022-28814-7, 2022. a, b, c, d, e, f, g, h
Foley, K. M. and Dowsett, H. J.: Community sourced mid-Piacenzian sea surface temperature (SST) data, US Geological Survey data release, https://doi.org/10.5066/P9YP3DTV, 2019. a, b, c, d, e
Gent, P. R., Danabasoglu, G., Donner, L. J., Holland, M. M., Hunke, E. C., Jayne, S. R., Lawrence, D. M., Neale, R. B., Rasch, P. J., Vertenstein, M., Worley, P. H., Yang, Z.-L., and Zhang, M.: The community climate system model version 4, J. Climate, 24, 4973–4991, https://doi.org/10.1175/2011JCLI4083.1, 2011. a
Gulev, S. K., Thorne, P., Ahn, J., Dentener, F., Domingues, C., Gerland, S., Gong, D., Kaufman, D., Nnamchi, H., Quaas, J., Rivera, J., Sathyendranath, S., Smith, S., Trewin, B., von Shuckmann, K., and Vose, R.: Changing State of the Climate System, in: Climate Change 2021: The Physical Science Basis, Contribution of Working Group I to the Sixth Assessment Report of the Intergovernmental Panel on Climate Change, edited by: Masson-Delmotte, V., Zhai, P., Pirani, A., Connors, S. L., Péan, C., Berger, S., Caud, N., Chen, Y., Goldfarb, L., Gomis, M. I., Huang, M., Leitzell, K., Lonnoy, E., Matthews, J., Maycock, T. K., Waterfield, T., Yelekçi, O., Yu, R., and Zhou, B., Cambridge University Press, Cambridge, UK and New York, USA, 287–422, https://doi.org/10.1017/9781009157896.004, 2021. a
Han, Z., Zhang, Q., Li, Q., Feng, R., Haywood, A. M., Tindall, J. C., Hunter, S. J., Otto-Bliesner, B. L., Brady, E. C., Rosenbloom, N., Zhang, Z., Li, X., Guo, C., Nisancioglu, K. H., Stepanek, C., Lohmann, G., Sohl, L. E., Chandler, M. A., Tan, N., Ramstein, G., Baatsen, M. L. J., von der Heydt, A. S., Chandan, D., Peltier, W. R., Williams, C. J. R., Lunt, D. J., Cheng, J., Wen, Q., and Burls, N. J.: Evaluating the large-scale hydrological cycle response within the Pliocene Model Intercomparison Project Phase 2 (PlioMIP2) ensemble, Clim. Past, 17, 2537–2558, https://doi.org/10.5194/cp-17-2537-2021, 2021. a, b
Haywood, A. M., Dowsett, H. J., Otto-Bliesner, B., Chandler, M. A., Dolan, A. M., Hill, D. J., Lunt, D. J., Robinson, M. M., Rosenbloom, N., Salzmann, U., and Sohl, L. E.: Pliocene Model Intercomparison Project (PlioMIP): experimental design and boundary conditions (Experiment 1), Geosci. Model Dev., 3, 227–242, https://doi.org/10.5194/gmd-3-227-2010, 2010. a, b
Haywood, A. M., Dowsett, H. J., Robinson, M. M., Stoll, D. K., Dolan, A. M., Lunt, D. J., Otto-Bliesner, B., and Chandler, M. A.: Pliocene Model Intercomparison Project (PlioMIP): experimental design and boundary conditions (Experiment 2), Geosci. Model Dev., 4, 571–577, https://doi.org/10.5194/gmd-4-571-2011, 2011. a
Haywood, A. M., Hill, D. J., Dolan, A. M., Otto-Bliesner, B. L., Bragg, F., Chan, W.-L., Chandler, M. A., Contoux, C., Dowsett, H. J., Jost, A., Kamae, Y., Lohmann, G., Lunt, D. J., Abe-Ouchi, A., Pickering, S. J., Ramstein, G., Rosenbloom, N. A., Salzmann, U., Sohl, L., Stepanek, C., Ueda, H., Yan, Q., and Zhang, Z.: Large-scale features of Pliocene climate: results from the Pliocene Model Intercomparison Project, Clim. Past, 9, 191–209, https://doi.org/10.5194/cp-9-191-2013, 2013. a, b, c, d, e, f
Haywood, A. M., Dowsett, H. J., and Dolan, A. M.: Integrating geological archives and climate models for the mid-Pliocene warm period, Nat. Commun., 7, 10646, https://doi.org/10.1038/ncomms10646, 2016a. a
Haywood, A. M., Dowsett, H. J., Dolan, A. M., Rowley, D., Abe-Ouchi, A., Otto-Bliesner, B., Chandler, M. A., Hunter, S. J., Lunt, D. J., Pound, M., and Salzmann, U.: The Pliocene Model Intercomparison Project (PlioMIP) Phase 2: Scientific objectives and experimental design, Clim. Past, 12, 663–675, https://doi.org/10.5194/cp-12-663-2016, 2016b. a, b
Haywood, A. M., Tindall, J. C., Dowsett, H. J., Dolan, A. M., Foley, K. M., Hunter, S. J., Hill, D. J., Chan, W.-L., Abe-Ouchi, A., Stepanek, C., Lohmann, G., Chandan, D., Peltier, W. R., Tan, N., Contoux, C., Ramstein, G., Li, X., Zhang, Z., Guo, C., Nisancioglu, K. H., Zhang, Q., Li, Q., Kamae, Y., Chandler, M. A., Sohl, L. E., Otto-Bliesner, B. L., Feng, R., Brady, E. C., von der Heydt, A. S., Baatsen, M. L. J., and Lunt, D. J.: The Pliocene Model Intercomparison Project Phase 2: large-scale climate features and climate sensitivity, Clim. Past, 16, 2095–2123, https://doi.org/10.5194/cp-16-2095-2020, 2020. a, b, c, d, e, f, g
Held, I. and Soden, B.: Robust responses of the hydrological cycle to global warming, J. Climate, 19, 5686–5699, https://doi.org/10.1175/JCLI3990.1, 2006. a
Holland, M. M., Bailey, D. A., Briegleb, B. P., Light, B., and Hunke, E.: Improved sea ice shortwave radiation physics in CCSM4: The impact of melt ponds and aerosols on Arctic sea ice, J. Climate, 25, 1413–1430, https://doi.org/10.1175/JCLI-D-11-00078.1, 2012. a
Huang, B., Thorne, P. W., Banzon, V. F., Boyer, T., Chepurin, G., Lawrimore, J. H., Menne, M. J., Smith, T. M., Vose, R. S., and Zhang, H.-M.: Extended Reconstructed Sea Surface Temperature, Version 5 (ERSSTv5): Upgrades, Validations, and Intercomparisons, J. Climate, 30, 8179–8205, https://doi.org/10.1175/JCLI-D-16-0836.1, 2017. a
Hurrell, J. W., Holland, M. M., Gent, P. R., Ghan, S., Kay, J. E., Kushner, P. J., Lamarque, J.-F., Large, W. G., Lawrence, D., Lindsay, K., Lipscomb, W. H., Long, M. C., Mahowald, N., Marsh, D. R., Neale, R. B., Rasch, P., Vavrus, S., Vertenstein, M., Bader, D., Collins, W. D., Hack, J. J., Kiehl, J., and Marshall, S.: The Community Earth System Model: A Framework for Collaborative Research, B. Am. Meteorol. Soc., 94, 1339–1360, https://doi.org/10.1175/BAMS-D-12-00121.1, 2013. a
Hwang, Y.-T., Frierson, D. M. W., and Kang, S. M.: Anthropogenic sulfate aerosol and the southward shift of tropical precipitation in the late 20th century, Geophys. Res. Lett., 40, 2845–2850, https://doi.org/10.1002/grl.50502, 2013. a
IPCC: Summary for Policymakers, in: Climate Change 2021: The Physical Science Basis, Contribution of Working Group I to the Sixth Assessment Report of the Intergovernmental Panel on Climate Change, edited by: Masson-Delmotte, V., Zhai, P., Pirani, A., Connors, S. L., Péan, C., Berger, S., Caud, N., Chen, Y., Goldfarb, L., Gomis, M. I., Huang, M., Leitzell, K., Lonnoy, E., Matthews, J., Maycock, T. K., Waterfield, T., Yelekçi, O., Yu, R., and Zhou, B., Cambridge University Press, Cambridge, UK and New York, USA, 3–32, https://doi.org/10.1017/9781009157896.001, 2021. a, b
Kay, J. E., Hillman, B. R., Klein, S. A., Zhang, Y., Medeiros, B., Pincus, R., Gettelman, A., Eaton, B., Boyle, J., Marchand, R., and Ackerman, T. P.: Exposing Global Cloud Biases in the Community Atmosphere Model (CAM) Using Satellite Observations and Their Corresponding Instrument Simulators, J. Climate, 25, 5190–5207, https://doi.org/10.1175/JCLI-D-11-00469.1, 2012. a
Lamarque, J. F., Bond, T. C., Eyring, V., Granier, C., Heil, A., Klimont, Z., Lee, D., Liousse, C., Mieville, A., Owen, B., Schultz, M. G., Shindell, D., Smith, S. J., Stehfest, E., Van Aardenne, J., Cooper, O. R., Kainuma, M., Mahowald, N., McConnell, J. R., Naik, V., Riahi, K., and Van Vuuren, D. P.: istorical (1850–2000) gridded anthropogenic and biomass burning emissions of reactive gases and aerosols: Methodology and application, Atmos. Chem. Phys., 10, 7017–7039, https://doi.org/10.5194/acp-10-7017-2010, 2010. a, b, c, d
Lambert, F. and Albani, S.: mineral dust in PmiP simulations: a short review, PAGES, 29, 86–87, https://doi.org/10.22498/pages.29.2.86, 2021. a
Lee, J. Y., Marotzke, J., Bala, G., Cao, L., Corti, S., Dunne, J., Engelbrecht, F., Fischer, E., Fyfe, J., Jones, C., Maycock, A., Mutemi, J., Ndiaye, O., Panickal, S., and Zhou, T.: Future Global Climate: Scenario-Based Projections and Near-Term Information., in: Climate Change 2021: The Physical Science Basis, Contribution of Working Group I to the Sixth Assessment Report of the Intergovernmental Panel on Climate Change, edited by: Masson-Delmotte, V., Zhai, P., Pirani, A., Connors, S. L., Péan, C., Berger, S., Caud, N., Chen, Y., Goldfarb, L., Gomis, M. I., Huang, M., Leitzell, K., Lonnoy, E., Matthews, J., Maycock, T. K., Waterfield, T., Yelekçi, O., Yu, R., and Zhou, B., Cambridge University Press, 553–672, https://doi.org/10.1017/9781009157896.006, 2021. a
Li, X., Jiang, D., Tian, Z., and Yang, Y.: Mid-Pliocene global land monsoon from PlioMIP1 simulations, Palaeogeogr. Palaeoclim. Palaeoecol., 512, 56–70, https://doi.org/10.1016/j.palaeo.2018.06.027, 2018. a
Liu, X., Easter, R. C., Ghan, S. J., Zaveri, R., Rasch, P., Shi, X., Lamarque, J. F., Gettelman, A., Morrison, H., Vitt, F., Conley, A., Park, S., Neale, R., Hannay, C., Ekman, A. M., Hess, P., Mahowald, N., Collins, W., Iacono, M. J., Bretherton, C. S., Flanner, M. G., and Mitchell, D.: Toward a minimal representation of aerosols in climate models: Description and evaluation in the Community Atmosphere Model CAM5, Geosci. Model Dev., 5, 709–739, https://doi.org/10.5194/gmd-5-709-2012, 2012. a, b
Lunt, D. J., Haywood, A. M., Schmidt, G. A., Salzmann, U., Valdes, P. J., and Dowsett, H. J.: Earth system sensitivity inferred from Pliocene modelling and data, Nat. Geosci., 3, 60–64, https://doi.org/10.1038/ngeo706, 2010. a
Martinez, J. M.: Managing scientific uncertainty in medical decision making: the case of the advisory committee on immunization practices, J. Med. Philos., 37, 6–27, https://doi.org/10.1093/jmp/jhr056, 2012. a, b, c
Meehl, G. A., Washington, W. M., Arblaster, J. M., Hu, A., Teng, H., Kay, J. E., Gettelman, A., Lawrence, D. M., Sanderson, B. M., and Strand, W. G.: Climate change projections in CESM1(CAM5) compared to CCSM4, J. Climate, 26, 6287–6308, https://doi.org/10.1175/JCLI-D-12-00572.1, 2013. a, b, c
NCAR: CESM Models, https://www2.cesm.ucar.edu/models/cesm1.2/ (last access: 22 May 2024), 2024. a
Nie, J., Stevens, T., Song, Y., King, J. W., Zhang, R., Ji, S., Gong, L., and Cares, D.: Pacific freshening drives Pliocene cooling and Asian monsoon intensification, Sci. Rep., 4, 5474, https://doi.org/10.1038/srep05474, 2014. a
O'Brien, C. L., Foster, G. L., Martínez-Botí, M. A., Abell, R., Rae, J. W., and Pancost, R. D.: High sea surface temperatures in tropical warm pools during the Pliocene, Na. Geosci., 7, 606–611, https://doi.org/10.1038/ngeo2194, 2014. a
Oleson, K.: Technical Description of the Community Land Model (CLM), NCAR Technical Note TN-478+STR, NCAR, https://doi.org/10.5065/D6RR1W7M, 2010. a
Pagani, M., Liu, Z., Lariviere, J., and Ravelo, A. C.: High Earth-system climate sensitivity determined from Pliocene carbon dioxide concentrations, Nat. Geosci., 3, 27–30, https://doi.org/10.1038/ngeo724, 2010. a
Ridley, H. E., Asmerom, Y., Baldini, J. U., Breitenbach, S. F., Aquino, V. V., Prufer, K. M., Culleton, B. J., Polyak, V., Lechleitner, F. A., Kennett, D. J., Zhang, M., Marwan, N., Macpherson, C. G., Baldini, L. M., Xiao, T., Peterkin, J. L., Awe, J., and Haug, G. H.: Aerosol forcing of the position of the intertropical convergence zone since ad 1550, Nat. Geosci., 8, 195–200, https://doi.org/10.1038/ngeo2353, 2015. a, b
Rosenbloom, N. A., Otto-Bliesner, B. L., Brady, E. C., and Lawrence, P. J.: Simulating the mid-Pliocene Warm Period with the CCSM4 model, Geosci. Model Dev., 6, 549–561, https://doi.org/10.5194/gmd-6-549-2013, 2013. a, b
Sagoo, N. and Storelvmo, T.: Testing the sensitivity of past climates to the indirect effects of dust, Geophys. Res. Lett., 44, 5807–5817, https://doi.org/10.1002/2017GL072584, 2017. a, b, c, d, e
Salzmann, U., Haywood, A. M., Lunt, D. J., Valdes, P. J., and Hill, D. J.: A new global biome reconstruction and data-model comparison for the Middle Pliocene, Global Ecol. Biogeogr., 17, 432–447, https://doi.org/10.1111/j.1466-8238.2008.00381.x, 2008. a, b
Samset, B. H., Sand, M., Smith, C. J., Bauer, S. E., Forster, P. M., Fuglestvedt, J. S., Osprey, S., and Schleussner, C. F.: Climate Impacts From a Removal of Anthropogenic Aerosol Emissions, Geophys. Res. Lett., 45, 1020–1029, https://doi.org/10.1002/2017GL076079, 2018. a
Smith, S. J., van Aardenne, J., Klimont, Z., Andres, R. J., Volke, A., and Delgado Arias, S.: Anthropogenic sulfur dioxide emissions: 1850–2005, Atmos. Chem. Phys., 11, 1101–1116, https://doi.org/10.5194/acp-11-1101-2011, 2011. a
Tegen, I. and Schepanski, K.: Climate Feedback on Aerosol Emission and Atmospheric Concentrations, Curr. Clim. Change Rep., 4, 1–10, https://doi.org/10.1007/s40641-018-0086-1, 2018. a
Trenberth, K. E. and Guillemot, C. J.: Evaluation of the global atmospheric moisture budget as seen from analyses, J. Climate, 8, 2255–2272, 1995. a
Twomey, S.: The Influence of Pollution on the Shortwave Albedo of Clouds, J. Atmos. Sci., 34, 1149–1152, https://doi.org/10.1175/1520-0469(1977)034<1149:TIOPOT>2.0.CO;2, 1977. a
Unger, N. and Yue, X.: Strong chemistry-climate feedbacks in the Pliocene, Geophys. Res. Lett., 41, 527–533, https://doi.org/10.1002/2013GL058773, 2014. a, b, c, d, e, f, g
Voigt, A., Pincus, R., Stevens, B., Bony, S., Boucher, O., Bellouin, N., Lewinschal, A., Medeiros, B., Wang, Z., and Zhang, H.: Fast and slow shifts of the zonal-mean intertropical convergence zone in response to an idealized anthropogenic aerosol, J. Adv. Model. Earth Syst., 9, 870–892, https://doi.org/10.1002/2016MS000902, 2017. a
Wang, B. and Ding, Q.: Global monsoon: Dominant mode of annual variation in the tropics, Dynam. Atmos. Oceans, 44, 165–183, https://doi.org/10.1016/j.dynatmoce.2007.05.002, 2008. a
Wang, C., Lee, W.-L., and Chou, C.: Climate Effects of Anthropogenic Aerosol Forcing on Tropical Precipitation and Circulations, J.Climate, 32, 5275–5287, https://doi.org/10.1175/JCLI-D-18-0641.1, 2019. a
Wang, P. X., Wang, B., Cheng, H., Fasullo, J., Guo, Z. T., Kiefer, T., and Liu, Z. Y.: The global monsoon across timescales: coherent variability of regional monsoons, Clim. Past, 10, 2007–2052, https://doi.org/10.5194/cp-10-2007-2014, 2014. a, b
Wara, M. W.: Permanent El Nino-Like Conditions During the Pliocene Warm Period, Science, 309, 758–761, https://doi.org/10.1126/science.1112596, 2005. a
Wilcox, L. J., Liu, Z., Samset, B. H., Hawkins, E., Lund, M. T., Nordling, K., Undorf, S., Bollasina, M., Ekman, A. M. L., Krishnan, S., Merikanto, J., and Turner, A. G.: Accelerated increases in global and Asian summer monsoon precipitation from future aerosol reductions, Atmos. Chem. Phys., 20, 11955–11977, https://doi.org/10.5194/acp-20-11955-2020, 2020. a
Xie, S.-P., Deser, C., Vecchi, G. A., Ma, J., Teng, H., and Wittenberg, A. T.: Global Warming Pattern Formation: Sea Surface Temperature and Rainfall, J. Climate, 23, 966–986, https://doi.org/10.1175/2009JCLI3329.1, 2010. a
Xiong, S., Ding, Z., Zhu, Y., Zhou, R., and Lu, H.: A ∼6Ma chemical weathering history, the grain size dependence of chemical weathering intensity, and its implications for provenance change of the Chinese loess–red clay deposit, Quaternary Sci. Rev., 29, 1911–1922, doi10.1016/j.quascirev.2010.04.009, 2010. a
Zhang, R., Yan, Q., Zhang, Z. S., Jiang, D., Otto-Bliesner, B. L., Haywood, A. M., Hill, D. J., Dolan, A. M., Stepanek, C., Lohmann, G., Contoux, C., Bragg, F., Chan, C. L., Chandler, M. A., Jost, A., Kamae, Y., Abe-Ouchi, A., Ramstein, G., Rosenbloom, N. A., Sohl, L., and Ueda, H.: Mid-Pliocene East Asian monsoon climate simulated in the PlioMIP, Clim. Past, 9, 2085–2099, https://doi.org/10.5194/cp-9-2085-2013, 2013. a
Zhang, Y. G., Pagani, M., and Liu, Z.: A 12-Million-Year Temperature History of the Tropical Pacific Ocean, Science, 344, 84–87, https://doi.org/10.1126/science.1246172, 2014. a
Zhao, A.: Aerosol uncertainties in tropical precipitation changes for the mid-Pliocene Warm Period v1.1, Zenodo [code], https://doi.org/10.5281/zenodo.10130118, 2024. a
Zubakov, V. and Borzenkova, I.: Pliocene palaeoclimates: Past climates as possible analogues of mid-twenty-first century climate, Palaeogeogr. Palaeoclim. Palaeoecol., 65, 35–49, https://doi.org/10.1016/0031-0182(88)90110-1, 1988. a